Heterogeneous resource allocation can change social hierarchy in public goods games.
Abstract
Public Goods Games represent one of the most useful tools to study group interactions between individuals. However, even if they could provide an explanation for the emergence and stability of cooperation in modern societies, they are not able to reproduce some key features observed in social and economical interactions. The typical shape of wealth distribution – known as Pareto Law – and the microscopic organization of wealth production are two of them. Here, we introduce a modification to the classical formulation of Public Goods Games that allows for the emergence of both of these features from first principles. Unlike traditional Public Goods Games on networks, where players contribute equally to all the games in which they participate, we allow individuals to redistribute their contribution according to what they earned in previous rounds. Results from numerical simulations show that not only a Pareto distribution for the payoffs naturally emerges but also that if players don’t invest enough in one round they can act as defectors even if they are formally cooperators. Finally, we also show that the players self-organize in a very productive backbone that covers almost perfectly the minimum spanning tree of the underlying interaction network. Our results not only give an explanation for the presence of the wealth heterogeneity observed in real data but also points to a conceptual change regarding how cooperation is defined in collective dilemmas.
One of the key elements of human and animal societies is the interaction between groups of individuals to achieve a common goal. The study of cooperation and coordination between individuals has always attracted the attention of scientists from very different fields, ranging from biologymaynard and sociologyfehr07 ; gintis03 to economycamerer ; nunn . On the theoretical side, scientists have tackled this problem using the tools offered by evolutionary game theoryaxelrod81 ; smith82 ; gintis00 ; nowak06book , using among others, Public Goods Games (PGG)hardin68 ; sigmund ; archetti12 ; perc13 . Mathematically, PGG are usually represented as the N-person version of the prisoner’s dilemmaszabo07 ; santos05 ; gardenes07 ; poncela07 where individuals can decide to contribute (cooperate) or not (defect) to the creation of the public goods. The added value generated by the public goods is modeled by a synergy factor that multiplies the collected investments resulting in a benefit that is divided equally between all the participants of the group. Then, to mimic the effect of evolution on the two strategies an evolutionary rule is applied to all players simultaneouslyaxelrod81 ; nowak06book ; hofbauer88 ; hofbauer03 . Despite of its simplicity, this representation shows a very rich behavior and demonstrated itself able to reproduce important traits of real world societies.
I Results
Recently the search for more realistic models led to the formulation of several modifications of the traditional setup of the PGG. In this direction, one of the first steps has been the introduction of a structure in the population to take into account the complex interaction patterns present in real societiesboccaletti06 ; santos08 ; killingback06 . Simultaneously, other efforts have been put in mimicing realistic traits of our societies like reputationfehr04 , rewardrand09 ; szolnoki10 and punishment mechanismsfehr00 ; sigmund07 ; helbing10a ; helbing10b ; perc12 , human mobilitycardillo12 ; helbing09 ; jiang10 ; yang10 ; roca11 ; cong12 ; xia12 ; chen12 and different types of social heterogeneitypeng10 ; lei10 ; zhang10 ; yang12 ; perc07 ; shi10 ; zhang_10 ; gao10 ; vukov11 ; cao_10 ; zhang_12 ; kun13 . Heterogeneity seems to play a fundamental role in cooperative behavior -although some results question the role of network heterogeneity pnas_gracia ; sr_gracia -, and several works have dealt with the effects of allowing an uneven distribution of players’ resourcesgao10 ; vukov11 ; cao_10 ; zhang_12 ; kun13 . However, even if the latter studies have helped to understand the emergence of cooperation in large groups, key aspects of the organization of human societies and markets still remain unexplained; a relevant example being the typical wealth distribution observed in economic systems, which cannot be obtained within the formalism of classical PGG.
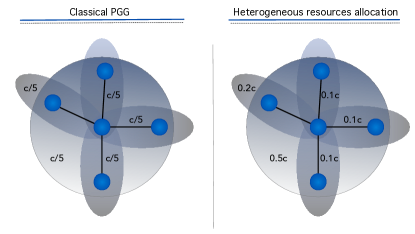
Here, we address the previous shortcomings and consider a modification of the classical N-person prisoner’s dilemma on networks. In our model, players are allowed to distribute their investments unevenly, allocating more resources to profitable games and less in unfavorable ones. In the classical formulation of PGG on networks each neighborhood is considered as a group and individuals participate in different groups according to the number of their neighbors. Thus a player with neighbors will contribute to distinct games (the one centered in her and the centered on her neighbors) and will divide equally her capital between all the groups. In our setting, players decide how to distribute their capital according to what they earned in previous rounds (Fig. 1). We employ a simple distribution function with a parameter allowing a linear or non-linear allocation of the resources; recovers the classical formulation with equal investments in all the games (see Methods for model’s details).
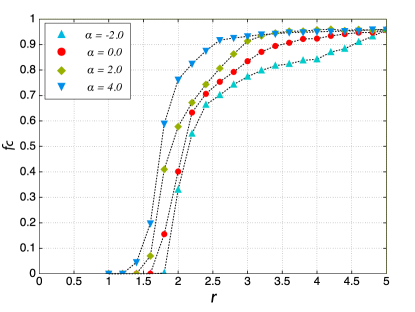
Computer simulations of our model for different values of the allocation parameter show that when individuals are allowed to distribute their investments unevenly, an increase in the cooperation level is observed with a shift of the critical synergy parameter to lower values (Fig. 2) with respect to the static allocation scheme . The increase in cooperation is more marked for larger values of while negative values of the parameter – i.e. invest more in less remunerative games – lead to a substantial decrease of both the critical synergy factor and the levels of cooperation. Even though these results are consistent with previous studies on similar modelsgao10 ; vukov11 ; cao_10 ; zhang_12 ; kun13 the mechanisms behind this increase and their consequences on the organization of the system are still unclear.
I.1 Microscopic organization
To address these questions, we focus on the region where cooperation dominates () and look how individuals distribute their investments. Fig. 3 depicts the distribution of the fraction of total investments for all the players (see Methods for details) once the system reached a stationary state. For the static resource allocation the investment distribution clearly follows the degree distribution of the underlying social graph as players only can distribute their contribution evenly between all the games in which they participate. The picture totally changes even when we consider a linear allocation of the investments. As increases from , the investment distribution rapidly become more heterogenous. Beyond , two large peaks centered respectively at very large and very small (¡ 0.05) values of appear.
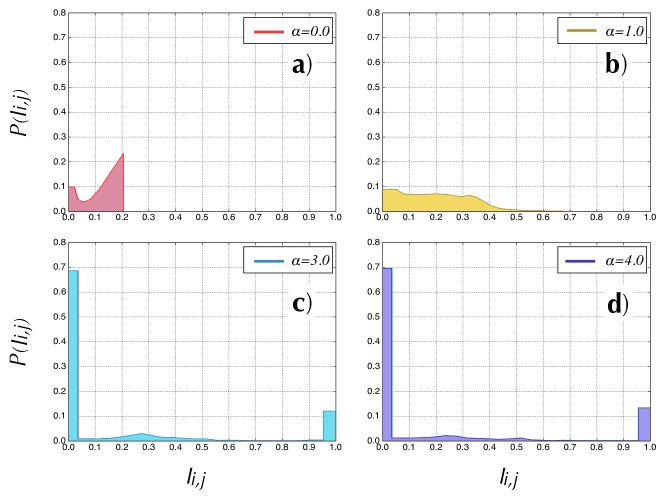
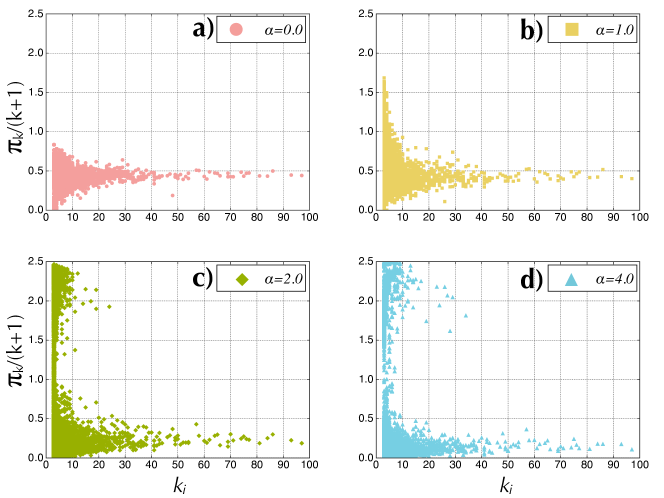
Results shown in Fig. 3 suggest that, once players are free to allocate their resources, a very peculiar organization emerges. The peak for large values of the investments indicates that most of the players (almost the totality for ) allocate the majority of their resources in only one market – the most profitable one – while they distribute evenly between all the other games the remaining part of their capital creating the peak for small values of . The previous findings could explain the observed increase in players’ cooperationgao10 ; vukov11 ; cao_10 ; zhang_12 ; kun13 , but it is not the only consequence of the observed investment distribution. Indeed, an established result in public goods games is that the most connected nodes – the hubs – are responsible for the emergence of cooperation and for the production of the majority of the payoff. However, the results in Fig. 4 depict a totally different scenario. If we consider the total normalized payoff produced in games centered on nodes of degree , , we find that, in the classical case, it is distributed almost homogeneously among all the degrees, with a mean value around (Fig. 4a). However, for strong differences arise. As increases, the distribution of the payoff for games taking place on low degree nodes starts to become more heterogenous until, finally, for (Fig. 4d) a large number of games produce very high payoffs (note that the maximum payoff does not depend on , as ). This means that all the players invested all their contributions in that game. Moreover, with the increase of the average payoff produced in the hubs decreases substantially.
These results, also at the light of the investments’ distribution (Fig 3), indicate a radical change in the social structure of the system. While in classical PGG, hubs represent the driving force and the centers where the majority of the wealth is produced, in our model, games on poorly connected nodes are responsible for the creation of the largest part of the public goods. Specifically, our results demonstrate that individuals self-organize in a large number of small sized clusters formed exclusively by cooperators where all the players invest almost their entire capital. This paradigm shift also has other interesting consequences that will be discussed in the next sections.
I.2 Wealth distribution
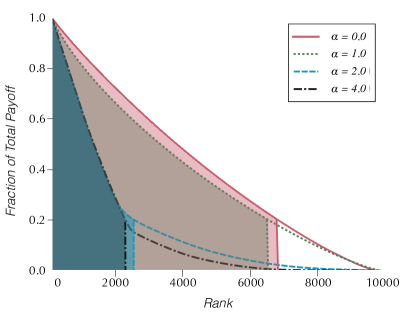
One of the criticisms to the classical N-persons’ prisoner’s dilemma (also on heterogeneous social structures) is that it fails to reproduce the wealth distribution observed in real economic systems – the so-called Pareto principlepareto – where the of the total wealth is generated by the of the population. This is mainly due to the fact that, even if games centered on hubs provide higher payoffs because many players participate in them, they are only a small fraction of the population (surely much less than the ) and are not able to significantly change the overall wealth distribution. As in our model cooperators tend to form small but very productive clusters it is interesting to look at the wealth distribution produced for different values of .
The colored area in Fig. 5 indicates the of the cumulative fraction of the total normalized payoff produced by nodes ranked from the most to the least productive ones. In the classical PGG almost the of the nodes are required to reach the of the wealth while for a quadratic () resource allocation setup, this value reaches approximatively the and for higher becomes more stable and asymptotically approaches the (see SI). Given that we have not imposed any rule on the PGG other than a stochastic investment mechanism and a replicator-like evolution of the strategies,, it can be said that the resulting Pareto Law is obtained from first principles.
I.3 Negative links
The uneven investment distribution observed in Fig. 3 also has another important implication for the games’ dynamics. In fact, we noted that if the contribution of a player in a game is significantly smaller than the average of the other ones, the payoff obtained by the other players is smaller than what they would obtain if player did not participate, i.e., if the link between and the focal player of the game doesn’t exist. In this context it is important to notice that, even if player is formally a cooperator, for that specific game she is acting as a sort of defector as her presence has the effect of reducing the income of other players. Mathematically this condition can be represented by the following inequality:
| (1) |
where represents all the neighbors of agent while stands for the same set excluding player . An important implication of Eq. (1) is that it allows to classify every directed link according to whether it is verified or not. In this way we can define a link as positive if eq. 1 is not satisfied – the contribution on the link is large enough to create an added value in the game – or, in the opposite way, a link as negative if the contribution of player is small enough to satisfy eq. 1 implying that the absence of the link would be beneficial for the other players of the game.
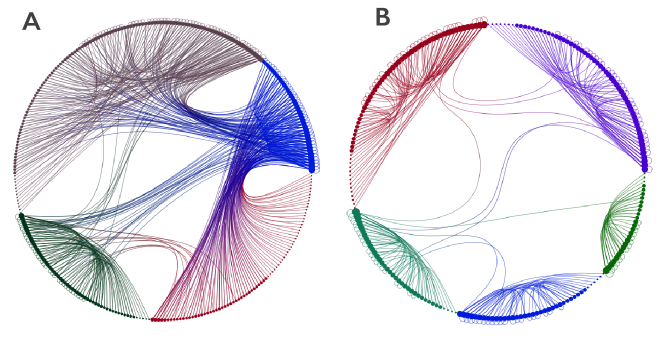
By analyzing how the two types of links are organized we can dissect the entire network in two subgraphs: one formed only by negative links and the other containing the positive ones. The analysis of the two networks brings about unexpected results. We found that in almost all the realizations the two networks were connected graphs (only in few cases the positive network presented some isolated nodes) and, more importantly, in all the cases the positive network had a backbone-like structure with similar topological features of the minimum spanning tree of the original network. On the other hand, the negative network always includes the majority of the links and its structure strictly resemble the original one (the details of the topological analysis and the comparison between the positive network and the minimum spanning tree are given in the SI). Also visually (Fig. 6) the difference between the two networks are notable with the positive network formed by long chains of poorly connected nodes resembling the spanning tree. It is worth stressing that this backbone organization of the links at the entire network level spontaneously emerges as a consequence of the self-organization of the players at the local level without any control mechanism.
Finally, it is also noteworthy that even if all the presented results have been obtained in the so-called fixed cost per player paradigm where each individual has the same capital , our results qualitatively hold also for the opposite case of a fixed cost per interaction paradigm, where players have a capital for each game (link) in which they participate (see SI). In addition, to further prove the robustness of our findings we also test different evolutionary rules beyond the finite size equivalent of the replicator dynamics like unconditional imitation, the Fermi rule and a Moran process. In all the cases (not shown) the results reveal the same qualitative behavior and very small quantitative differences.
II Discussion
Even though heterogeneity has been recognized as one of the most effective mechanisms to favor cooperation in evolutionary gamespeng10 ; lei10 ; zhang10 ; yang12 ; perc07 ; shi10 ; zhang_10 ; gao10 ; vukov11 ; cao_10 ; zhang_12 ; kun13 some of its consequences still remain uncovered.
Aimed at shedding light on the organization of cooperation in public goods games, in this paper we have focused on a different rule for investments that allows players to allocate their resources unevenly. Although this modification might appear not significant, it leads to a radical paradigm shift that can help us explain social and economic hierarchies observed in our complex society. Specifically, despite of its simplicity, our model offers a first-principled explanation of the Pareto Law for wealth distributionpareto . This result is a direct consequence of the bimodal distribution of investments observed in Fig 3, resulting from a behavior in which players invest the majority of their contribution in one game creating small productive clusters of nodes. Although the emergence of those clusters is responsible for the heterogeneity observed in the cumulative payoff distribution (Fig. 5) the reason why this rule is so stable for a large range of values of are still unclear and surely deserve further studies.
The heterogenous payoff distribution is not the only consequence of the uneven investment allocation. Analyzing how players distribute their contribution we also found that if the investment on one link is below the threshold given by Eq. (1), the presence of the link is detrimental for the other players leading to a lower payoff. This result imposes a change in how we think about cooperation in evolutionary game theory as one player can act as a cooperator in one game (link) and as a defector in others. This concurrent behavior makes it more meaningful to speak in terms of cooperation in games rather than of cooperators. That is, it suggests that in some contexts, the term cooperation should be carefully used, and that it may be more natural to change the reference of cooperation from players to games.
It is also important to note that the presence of these so-called negative links is not an exclusive feature of our model but it represents a usual situation also in the classical formulation of PGG on heterogeneous networks with the fixed cost per player paradigm. To clarify this point, it is instructive to focus on a toy example. Let’s consider a simple network composed by a ring of nodes in which each node is connected only to its two nearest neighbors and to a hub placed at the center of the ring, i.e., a wheel-like configuration. In this case, the hub will have degree while the other nodes in the ring degree . In the fixed cost per player setup, the hub will be involved in games and its contribution in each game will be while the other nodes will participate in different games and contribute to each . It is straightforward to demonstrate that in the games centered on the the leaves for Eq. 1 holds for all possible values of and . In this case even if the hub is formally a cooperator its presence reduces the payoff obtained by all the other nodes in the ring.
Eq. 1 allowed us also to classify contributions as negative or positive and to split the original network into two layers each one made up of links of the same type. Astonishingly, we found that not only players self-organize their positive links to create highly productive groups but also at a higher level they tend to form a backbone of the entire network. The structure we found strictly resembles the minimum spanning tree of the original interaction network and in most of the cases cover more than of the agents in the system.
Finally, taken together, our findings not only explain the increase in cooperation observed in previous studiesgao10 ; vukov11 ; cao_10 ; zhang_12 ; kun13 but also can help to understand the basis behind the heterogeneity in wealth distribution observed in almost all human societies and give a hint about the organization and functioning of large economic systems. Our results also impose a radical change in our idea of cooperation in evolutionary game theory as they demonstrate that also in the classical formulation of Public Goods Games on networks players can act as cooperators and defectors at the same time.
III Methods
We consider a PGG game on networkssantos08 with a dynamical resource allocation scheme that allows individuals to invest higher quantities in profitable groups and reserve their resources from unfavorable ones. Each node of the network is considered as a player participating in different PGGs with its neighbors. Participating in a PGG round each individual can decide to contribute (cooperate) a part of its resources or act as free-riders (defect). For the fixed cost per player scheme the total amount of resources for each round is fixed to and equal for all the players, whereas in the fixed cost per game each player has a quantity . In case of cooperation, the contribution of each agent in a game is calculated dynamically and depends on the payoff obtained by the player in the previous round of the game. Specifically, the investment of player at time in the game where node is the focal player is defined as and for the fixed cost per player reads as:
| (2) |
while in the fixed cost per game:
| (3) |
where is the payoff obtained by agent in the game centered on node at the previous time step, is the set of all the first neighbors of node and is a parameter that allows to differentiate between a static and homogeneous resource allocation () and heterogeneous distributions where higher resources are invested in best performing games (). At time , as all the previous payoffs are set to zero, the contribution is divided evenly between all the games.
In this setting the payoff of player in the game where is the focal player can be calculated as:
| (4) |
where is the synergy factor and is a dichotomous variable representing cooperation and defection respectively. Summing over all the games in which player participates the total payoff earned by at time reads as:
| (5) |
At the end of each round players update synchronously their strategies according to the finite population equivalent of the replicator dynamics. Each player selects with uniform probability one of her neighbors and compare their respective payoffs. If the player will keep its strategy in the next time step otherwise, with probability player will copy the strategy of . We can calculate as:
| (6) |
where is a normalization factor defined as the maximum possible payoff difference between two players in the network assuring that .
III.1 Numerical setup
Numerical results presented in the text are the average of at least independent runs with randomly chosen initial conditions. At the beginning of each run players are assigned randomly one of the two available strategies (cooperate or defect) with probability . The average density of cooperators and the other quantities considered are evaluated at the stationary state after a sufficiently long relaxation time (usually time-steps) and then averaged over additional steps. As a substrate we employ scale-free networks generated according to the uncorrelated configuration model Catanzaro2005 ; boccaletti06 with mean degree , exponents and and sizes and . The results presented are independent of the system size, and mean degree.
Acknowledgements.
This work has been partially supported by MINECO through Grants FIS2014-55867-P; Comunidad de Aragón (Spain) through a grant to the group FENOL and by the EC FET-Proactive Project MULTIPLEX (grant 317532 to YM and SM). SM is supported by the MINECO through the Juan de la Cierva Program. CYX has been supported by the National Natural Science Foundation of China (NSFC) through Grant No. 61374169References
- (1) Smith JM, Szathmáry E (1995) The Major Transition in Evolution (W.H. Freeman).
- (2) Fehr E, Gintis H, (2007) Human Motivation and Social Cooperation: Experimental and Analytical Foundations. Annual Review of Sociology 33:43-64.
- (3) Gintis H, Bowles S, Boyd R, Fehr E (2003) Explaining altruistic behavior in humans. Evolution and Human Behavior 24:153 1 72.
- (4) Camerer CF (2003) Behavioural Game Theory: Experiments in Strategic Interaction (Princeton University Press).
- (5) Nunn CL, Lewis RJ (2001) Cooperation and collective action in animal behaviour in Economics in Nature (eds Noë R, van Hooff J-A-R-A-M, Hammerstein P) 42 1 7 (Cambridge University Press).
- (6) Axelrod R, Hamilton WD (1981) The evolution of cooperation. Science 211:1390 1 796.
- (7) Smith JM (1982) Evolution and the Theory of Games. (Cambridge University Press)
- (8) Gintis H (2000) Game theory evolving. (Princeton University Press)
- (9) Nowak MA (2006) Evolutionary dynamics: exploring the equations of life. (Harvard Universtiy Press).
- (10) Hofbauer J, Sigmund K (1988) The theory of evolution and dynamical systems. (Cambridge University Press).
- (11) Hofbauer J, Sigmund K (2003) Evolutionary game dynamics. Bull. Amer. Math. Soc. 40:479-519.
- (12) Hardin G (1968) The tragedy of the commons. Science 162:1243 1 748.
- (13) Sigmund K (2010) The calculus of selfishness. (Princeton University Press).
- (14) Archetti M, Scheuring I. 2012 Review: game theory of public goods in one-shot social dilemmas without assortment. J. Theor. Biol. 299: 9 1 7
- (15) Perc M, Gómez-Gardeñes J, Szolnoki A, Floría LM, Moreno Y (2013) Evolutionary dynamics of group interactions on structured populations: a review. J. R. Soc. Interface 10 80:20120997.
- (16) Szabó G, Fáth G (2007) Evolutionary games on graphs. Phys. Rep. 446:97 1 76.
- (17) Santos FC, Pacheco JM (2005) Scale-free networks provide a unifying framework for the emergence of cooperation. Phys. Rev. Lett. 95:098104.
- (18) Gómez-Gardeñes J, Campillo M, Floría LM, Moreno Y (2007) Dynamical Organization of Cooperation in Complex Topologies Phys. Rev. Lett. 98:108103.
- (19) Poncela J, Gómez-Gardeñes J, Floría LM, Moreno Y (2007) Robustness of cooperation in the evolutionary prisoner’s dilemma on complex networks. New J. Phys. 9:184.
- (20) Vukov G, Szabó G, Szolnoki A (2008) Evolutionary prisoner’s dilemma game on Newman-Watts networks. Phys. Rev. E 77:026109.
- (21) Boccaletti S, Latora V, Moreno Y, Chavez M, Hwang D-U, (2006) Complex networks: structure and dynamics, Phys. Rep. 424:175-308.
- (22) Santos FC, Santos MD, Pacheco JM (2008) Social diversity promotes the emergence of cooperation in public goods games. Nature 454:313-316.
- (23) Killingback T, Bieri J, Flatt T (2006) Evolution in group-structured populations can resolve the tragedy of the commons. Proc. R. Soc. Lond. B 273:1477–1481.
- (24) Fehr E (2004) Don’t lose your reputation. Nature 432:449 1 70.
- (25) Rand DG, Dreber A, Ellingsen T, Fudenberg D, Nowak MA (2009) Positive interactions promote public cooperation. Science 325:1272 1 775.
- (26) Szolnoki A, Perc M (2010) Reward and cooperation in the spatial public goods game. EPL 92:38003.
- (27) Fehr E, Gächter S (2000) Cooperation and punishment in public goods experiments. Am. Econ. Rev. 90:980 1 74.
- (28) Sigmund K (2007) Punish or perish? Retaliation and collaboration among humans. Trends Ecol. Evol. 22:593 1 70.
- (29) Helbing D, Szolnoki A,Perc M, Szabó G (2010) Evolutionary establishment of moral and double moral standards through spatial interactions. PLoS Comput. Biol. 6:e1000758.
- (30) Helbing D, Szolnoki A, Perc M, Szabó G (2010) Punish, but not too hard: how costly punishment spreads in the spatial public goods game. New J. Phys. 12:083005.
- (31) Perc M (2012) Sustainable institutionalized punishment requires elimination of second- order free-riders. Sci. Rep. 2:344.
- (32) Cardillo A, Meloni S, Gómez-Gardeñes J, Moreno Y (2012) Velocity-enhanced cooperation of moving agents playing public goods games. Phys. Rev. E 85:067101.
- (33) Helbing D, Yu W (2009) The outbreak of cooperation among success-driven individuals under noisy conditions. Proc. Natl Acad. Sci. USA 106:3680 1 785.
- (34) Jiang L-L, Wang W-X, Lai Y-C, Wang B-H (2010) Role of adaptive migration in promoting cooperation in spatial games. Phys. Rev. E 81:036108.
- (35) Yang H-X, Wu Z-X, Wang B-H (2010) Role of aspiration-induced migration in cooperation. Phys. Rev. E 81:065101(R).
- (36) Roca CP, Helbing D (2011) Emergence of social cohesion in a model society of greedy, mobile individuals. Proc. Natl Acad. Sci. USA 108:11370 1 7374.
- (37) Cong R, Wu B, Qiu Y, Wang L (2012) Evolution of cooperation driven by reputation-based migration. PLoS ONE 7:e35776.
- (38) Xia C-Y, Meloni S, Moreno Y (2012) Effects of environment knowledge on agglomeration and cooperation in spatial public goods games. Adv. Complex Syst. 15:1250056.
- (39) Chen X, Szolnoki A, Perc M (2012) Risk-driven migration and the collective-risk social dilemma. Phys. Rev. E 86:036101.
- (40) Peng D, Yang H-X, Wang W-X, Chen GR, Wang B-H (2010) Promotion of cooperation induced by nonuniform payoff allocation in spatial public goods game. Eur. Phys. J. B 73:455 1 79.
- (41) Lei C, Jia TWJ-Y, Cong R, Wang L (2010) Heterogeneity of allocation promotes cooperation in public goods games. Physica A 389:4708 1 714.
- (42) Zhang H, Yang H, Du W, Wang B, Cao X (2010) Evolutionary public goods games on scale-free networks with unequal payoff allocation mechanism. Physica A 389:1099 1 704.
- (43) Yang H-X, Rong Z, Lu P-M, Zeng Y-Z (2012) Effects of aspiration on public cooperation in structured populations. Physica A 391:4043 1 749.
- (44) Perc M (2007) Does strong heterogeneity promote cooperation by group interactions? New J. Phys. 13:123027.
- (45) Shi D-M, Zhuang Y, Wang B-H (2010) Group diversity promotes cooperation in the spatial public goods game. EPL 90:58003.
- (46) Zhang H-F, Yang H-X, Du W-B, Wang B-H and Cao X-B (2010) Evolutionary public goods games on scale-free networks with unequal payoff allocation mechanism. Physica A 389:1099.
- (47) Gao J, Li Z, Wu T, Wang L. 2010 Diversity of contribution promotes cooperation in public goods games. Physica A 389:3166 1 771.
- (48) Vukov J, Santos FC, Pacheco J. 2011 Escaping the tragedy of the commons via directed investments. J. Theor. Biol. 287:37 1 7.
- (49) Cao X-B, Du W-B, Rong Z-H (2010) Evolutionary public goods game on scale-free networks with heterogeneous investment, Physica A 389:1273-1280.
- (50) Zhang H, Shi D, Liu R, Wang B (2012) Dynamic allocation of investments promotes cooperation in spatial public goods game, Physica A 391:2617-2622.
- (51) Kun A and Dieckmann U (2013) Resource heterogeneity can facilitate cooperation. Nat. Comm. 4: 2453.
- (52) Gracia-Lázaro, Ferrer A., Ruíz G., Tarancón A., Cuesta J. A., S nchez A., and Y. Moreno (2012) Heterogeneous networks do not promote cooperation when humans play a Prisoner?s Dilemma. Proc. Nat. Acad. Sci. USA 109:12922-12926.
- (53) Gracia-Lázaro, Ferrer A., Ruíz G., Tarancón A., Cuesta J. A., S nchez A., and Y. Moreno (2012) Human behavior in Prisoner?s Dilemma experiments suppresses network reciprocity, Sci. Rep. 2:325
- (54) Pareto V (1927) Manual of Political Economy. (Augustus M. Kelley Publishers, reprinted 1971).
- (55) Catanzaro M, Boguña M, Pastor-Satorras R. (2005) Generation of uncorrelated random scale-free networks. Phys. Rev. E 71:027103.