Growth of bacteria in 3-d colonies
Xinxian Shao1, Andrew Mugler1,2, Justin Kim3, Ha Jun Jeong3, Bruce Levin3, Ilya Nemenman1,3,
1 Department of Physics, Emory University, Atlanta, GA 30322, USA
2 Department of Physics and Astronomy, Purdue University, West Lafayette, IN 47907, USA
3 Department of Biology, Emory University, Atlanta, GA 30322, USA
* ilya.nemenman@emory.edu
Abstract
The dynamics of growth of bacterial populations has been extensively studied for planktonic cells in well-agitated liquid culture, in which all cells have equal access to nutrients. In the real world, bacteria are more likely to live in physically structured habitats as colonies, within which individual cells vary in their access to nutrients. The dynamics of bacterial growth in such conditions is poorly understood, and, unlike that for liquid culture, there is not a standard broadly used mathematical model for bacterial populations growing in colonies in three dimensions (3-d). By extending the classic Monod model of resource-limited population growth to allow for spatial heterogeneity in the bacterial access to nutrients, we develop a 3-d model of colonies, in which bacteria consume diffusing nutrients in their vicinity. By following the changes in density of E. coli in liquid and embedded in glucose-limited soft agar, we evaluate the fit of this model to experimental data. The model accounts for the experimentally observed presence of a sub-exponential, diffusion-limited growth regime in colonies, which is absent in liquid cultures. The model predicts and our experiments confirm that, as a consequence of inter-colony competition for the diffusing nutrients and of cell death, there is a non-monotonic relationship between total number of colonies within the habitat and the total number of individual cells in all of these colonies. This combined theoretical-experimental study reveals that, within 3-d colonies, E. coli cells are loosely packed, and colonies produce about 2.5 times as many cells as the liquid culture from the same amount of nutrients. Our model provides a baseline description of bacterial growth in 3-d, deviations from which can be used to identify phenotypic heterogeneities and inter-cellular interactions that further contribute to the structure of bacterial communities.
Author Summary
It is convenient for theoreticians as well as experimentalists to maintain the fiction that bacteria exist as planktonic cells in well-mixed liquid cultures, all with equal access to nutrients, wastes, toxins, antibiotics, bacterial viruses, and each other. However, in the real world, bacteria are more often found in physically structured, spatially heterogeneous habitats as colonies and micro-colonies. While one can experimentally explore the population and evolutionary dynamics of bacteria in such physically structured habitats, there is dearth of mathematical models to generate hypotheses for and to interpret results of these experiments. As a step towards the construction of a theory of the population dynamics of bacteria in physical structured habitats, we develop and experientially explore the simplest such model of the dynamics of bacterial growth in 3-d structured colonies.
Introduction
In 1942, Jacques Monod developed a mathematical model of bacterial growth in a liquid culture, where the bacterial cells and nutrient molecules were homogeneously distributed [1, 2]. A simple ordinary differential equation was accurate enough to account for the exponential growth of bacteria and their ascent into stationary phase following the exhaustion of the limiting resource. The model has proven to be long-lived since most experimental studies of the population dynamics of bacteria are in liquid culture[3, 4]. In contrast, outside the tubes, flasks, and chemostats of laboratory culture, bacteria most commonly live as physically structured habitats as colonies or microcolonies. Such colonies are heterogeneous; at a minimum, their cells vary in their access to nutrients depending on their position within the colony and thereby divide at different rates.
The majority of research directed at understanding structured bacterial population growth has been confined to two dimensional (2-d) surfaces [5, 6, 7, 8, 9, 10], including studying the interplay of evolution and the physical structure [11, 12], or analyzing effects of mechanical interactions in an expanding colony [13, 14, 15]. However, diffusion in two dimensions is different from three, making it easier to form diffusion-limited instabilities [16, 5, 17]. In 3-d, work has been done to understand nutrient shielding of the interior of a colony by the microbes on the surface, treating them as individual agents [18]. However, we are not aware of 3-d models of colony growth that account for the spatially varying density of nutrients and bacteria, explain the observed experimental phenomenology of bacterial growth in such colonies, and do so in a relatively simple coarse-grained (PDE) Monod-style manner, rather than relying on complex agent simulations of individual bacteria
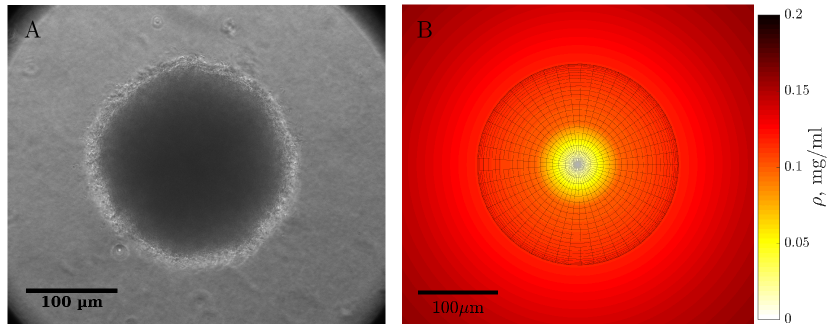
Here we develop such a model that treats the growth rate heterogeneity due to the non-uniform nutrient distribution produced self-consistently by consumption of a nutrient by the bacteria. We explore its fit experimentally with the growth of E. coli maintained and growing as colonies embedded in 3-d matrix of soft agar with an initially uniform spatial distribution of a limiting carbon source, glucose (Fig. 1). We compare dynamics of growth of bacteria in colonies with that of planktonic cells in liquid culture with the same concentration of limiting glucose. In our model, we assume that the colony is essentially unconstrained by the soft agar and is free to expand, and the bacteria within them are non-motile. This combined theoretical-experimental study reveals two surprising features of bacterial populations growing as colonies: (i) the bacteria within these structures exist as loosely packed viable cells, and (ii) the viable cell densities of bacteria produced in colonies is more than two-fold greater than that in liquid cultures with the same concentration of the limiting glucose.
Results
Experimental characterization of bacterial growth
We use population growth of E. coli in minimal medium as the basis for developing the model. To control the amount of nutrients available to the bacteria, we use glucose at the initial concentration mg/ml, at which it limits the stationary phase density of E. coli produced as planktonic cells and as colonies in soft agar. We grow bacteria either in liquid cultures or as three-dimensional colonies embedded in soft agar (Fig. 1). Unless otherwise noted, 3-d colonies are grown in ml of soft agar, inoculated with approximately bacteria/ml. Under these conditions, each colony has an access to a nutrient subvolume of ml, or, on average, a nutrient sphere of radius mm. For the liquid and the 3-d growth, we estimate the density of viable cells, , at different times diluting and plating and then counting the number of resulting colonies (colony-forming units, or CFU), see Methods for details. For each time point, we obtain 6 independent replicates of CFU density estimates, and each experiment was replicated at least 3 times.
The results of these population growth experiments are shown in Fig. 2 (data points). In liquid, the density of the population increases exponentially, and then abruptly stops and begins to decline at a low rate, presumably because the bacteria consume the available glucose and enter the stationary phase, at which time the rate of cell mortality exceeds that of division. In contrast, in 3-d colonies, the exponential growth and the stationary phase are separated by a gradual decline in the net rate of growth. We expect that this is because the growth of the population here is limited by the speed with which diffusion brings glucose from the periphery of the available nutrient volume to the colony, where it is consumed by the bacteria. Surprisingly, the maximum density of bacteria growing as colonies is substantially greater than that in liquid, despite the concentration of the limiting glucose being equal for liquid and the soft agar. To understand these findings quantitatively, we now develop a simple (minimalist) mathematical model of resource-limited bacterial growth in liquid and as spatially structured colonies.
Minimal model of resource-limited bacterial growth
Our liquid culture model of bacterial growth is a variant of that of Monod [2]. In this model, all bacteria have the same resource (glucose) concentration dependent growth rate , where is the concentration of glucose, is the maximum growth rate, and , the Monod constant, is the concentration of the resource when the growth rate is half its maximum value . With these parameters, the rate of change of the density of the bacterial population is given by
| (1) | ||||
| (2) |
Here is the volume of the liquid where the culture grows, and is the liquid yield, which measures the number of bacteria produced by a microgram of the nutrient. Further, is the Heaviside -function, which is equal to zero for , and to unity otherwise. It represents the lag phase before the growth starts after a transfer to a new environment. Note that Eqs. (1) and (2) differ slightly from the standard Monod model. Specifically, we added a small constant death rate to account for the decrease of the population in the liquid culture after the saturation (Fig. 2). Thus the population has a zero net growth at a critical nutrient density of , which represents the minimum nutrient concentration needed to sustain life without growth [19].
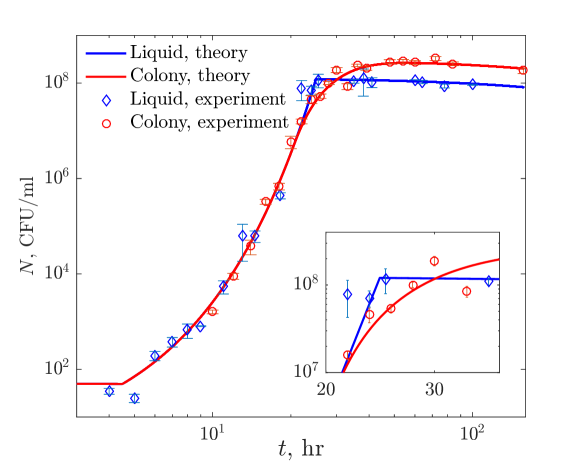
We fit the five growth parameters (, , , , and ) to the experimental data using nonlinear least squares fitting, and estimate uncertainties of the fit using bootstrapping (see Materials and Methods, and also Table 1). As seen in Fig. 2 (blue curve), after the lag phase, the population increases exponentially before it saturates abruptly when all the cells in the colony run out of food at the same time. The excellent agreement between the experiments and the model is encouraging. It allows us to use the Monod model with death as the basis for 3-d studies.
To develop the minimal model of 3-d growth, we assume that the bacteria within the colony are physiologically identical, but depending on their position, vary in their access to the diffusing carbon source. Thus all cells grow according to the Monod model, differing only by the local availability of the limiting nutrient, glucose, . We assume that soft agar is too soft to provide mechanical resistance to the colony, but sufficiently dense to keep cells from moving. As the cells divide, the colony expands symmetrically as a sphere, keeping a constant cell density per volume of the space occupied by the colony. This leads to the following equations for the spherically-symmetric local number density of cells and nutrient concentration :
| (3) | ||||
| (4) |
with the initial uniform spatial concentration of the nutrient at time , and a single bacterium starting the colony at . In these equations, is the nutrient (glucose) diffusion coefficient. Further, we allow for the yield in the colony to be different from the liquid yield to account for the different saturation values in Fig. 2, as further discussed below. Importantly, since the agar is more than 99% liquid, the four other growth parameters , , , and are taken to be the same in both media.
To keep the colony at the same fixed cellular packing density , we require that the overall increase in cell number leads to the proportionate growth of the colony radius , so that . Thus at each point in time, we impose the condition that
| (5) |
where is the radius of the nutrient subvolume accessible to the colony. To reconcile Eqs. (3) and (5), we say that all new growth is immediately transferred to the colony edge, , while the death results in a decrease in the cell density locally (see Materials and Methods for description of the algorithm for simulating this growth model).
To illustrate the behavior of this 3-d model of bacterial growth as colonies, we plot numerical solutions of Eqs. (3)-(5) for different values of the nutrient diffusion coefficient in Fig. 3 (A). Especially at small , two different growth regimes are clearly visible after the lag but before the ultimate saturation and the slow cell death. The first is the fast exponential growth based on local, immediately accessible resources. This regime is indistinguishable from the growth in liquid. When the local nutrients are depleted at a certain time following the start of the growth at , new nutrients must be brought from afar by diffusion. This is slow, resulting in a slower diffusion-limited growth regime. Here the overall colony growth rate is an average over cells growing at different rates due to different concentrations of the locally accessible nutrient. Our simulations suggest that, in this regime, the nutrient concentration at the colony edge decays exponentially fast, in agreement with Ref. [18], cf. Fig. 3 (B). The nutrient penetration depth is only a few m, or a few cell layers. Therefore, in the diffusion-limited regime, there are, essentially, no nutrients deep inside a colony, and only cells at the periphery can grow. In the absence of resource storage [20], nutrient sharing from the outer cells, or cannibalism (we model none of these), interior cells would not grow at all and will eventually die. The diffusion-limited growth regime finally ends with saturation and slow death when most of the nutrients in the accessible subvolume are depleted at time after . The onset of the saturation takes longer than in liquid since small (but larger than ) amounts of the nutrient linger at the far edges of the nutrient subvolume for a long time.
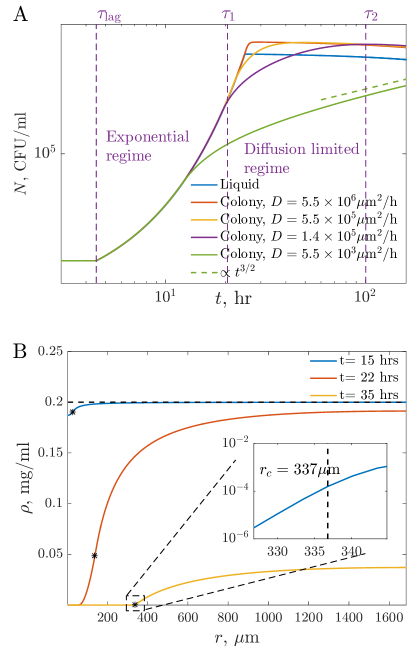
Analytical expressions for , , and the growth dynamics can be obtained from the following arguments. First, in the exponential growth regime, the population grows as . This requires of the nutrient mass, which must come from the volume immediately accessible by diffusion, equal to . Equating the two expressions gives, to the leading order, . When local resources are exhausted, growth is limited by nutrients diffusing in from the volume . However, because the encounter probability for a 3-d random walk is less than one [21], most of the nutrient molecules coming from afar will not be immediately absorbed. In fact, since the box-counting dimension of a diffusive process is two, only nutrient molecules will be captured in time , resulting in . On the other hand, the radius of the colony grows as . Combining these expressions gives in the diffusion-limited regime. Finally, the total amount of nutrients available to the colony is , and so the diffusion-limited growth will saturate, and the cells will start dying with the rate of when the colony grows to , which occurs at . Altogether, we find
| (6) |
These analytical estimates are supported by the numerical solutions in Fig. 3(A).
We note that in one or two dimensions, the diffusion limited growth would scale as for dimension , independently of the (small) colony radius, or even for a point colony, since the random walk encounter probability there is one [21]. In contrast, our three-dimensional result depends critically on knowing how the radius of the colony scales with the number of growing bacteria. In particular, here we cannot model the colony as a point-like object. Thus the exponent of the power law scaling is not universal in 3-d, and it may change for heterogeneous colonies with varying cell size and cell density.
Experimental tests of the minimal model of bacterial growth
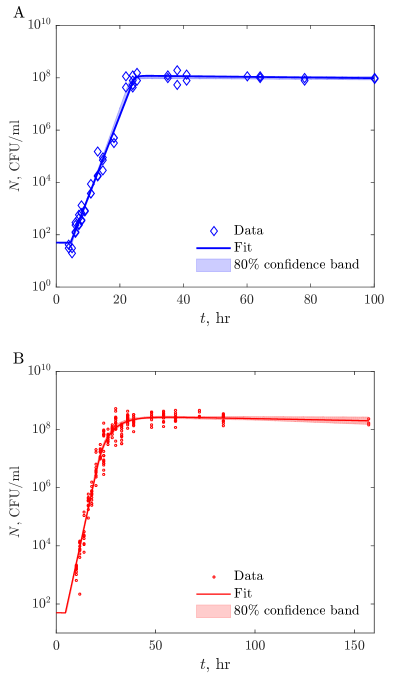
To determine the extent to which our minimal model accounts for the dynamics of growth of bacteria in colonies, we fit the model to data using nonlinear least squares fitting, similar to the liquid case. We keep the parameters , , , , and equal to the values inferred for liquid, and only optimize , , and for the 3-d culture data. See Materials and Methods for the details of the fits, including estimation of the prediction uncertainty using bootstrapping. Table 1 shows fitted parameter values with the corresponding nominal values from the literature. The fitted parameters are consistent with the nominal values where the latter are known. Further, the best fit curve shows an excellent agreement with data (cf. Fig. 2, red), and the prediction confidence bands are very narrow (cf. Fig. 4). This suggests that nutrient diffusion and the ensuing geometric heterogeneity of growth are sufficient to explain the population dynamics of these E. coli colonies in 3-d at our experimental precision, and consideration of additional phenotypic inhomogeneities is not needed.
Our analysis also provides estimates of two previously unknown parameters, (packing density) and (yield in 3-d colonies). The inferred packing density is CFU/m3, with the 80% confidence interval of CFU/m3 . Since an E. coli cell has a volume of between and m3 [22, 23], this suggests that only about % of all space in a colony is occupied by viable cells. This is a surprising finding, and it requires an independent corroboration. Towards this end, we measure radii of large colonies and calculate their packing densities by diving colony volumes by the average CFUs per colony. This gives CFU/, consistent with our estimation of from the fitted growth model. In other words, in our experiments, viable E. coli cells like to keep their distance from each other.
The second inferred parameter is . We find that the yield as measured by the ratio of the CFU estimated stationary phase density and the quantity of glucose in 3-d is 2 to 3 times higher than that in liquid culture, (cf. Table 1). This implies that, at saturation, colonies produce more CFUs than liquid cultures, which is directly apparent from Fig. 2. This is a surprising result, since in the colony the bacteria grow more slowly and there is more time for cell death. Nonetheless, similar results have been reported for colonies growing on surfaces [24]. Here this effect is likely a direct consequence of the growth dynamics during the diffusion-limited regime. Indeed, E. coli cells growing at a rate of hr-1 grow to be to times larger than cells growing at a rate of hr-1 [25]. While the diffusion limited regime lasts only for a few hours (cf. Fig. 2), more than 90% of all cells emerge at that time, so that the majority of cells in the colony are smaller than in liquid, yielding more cells from the same nutrient amount.
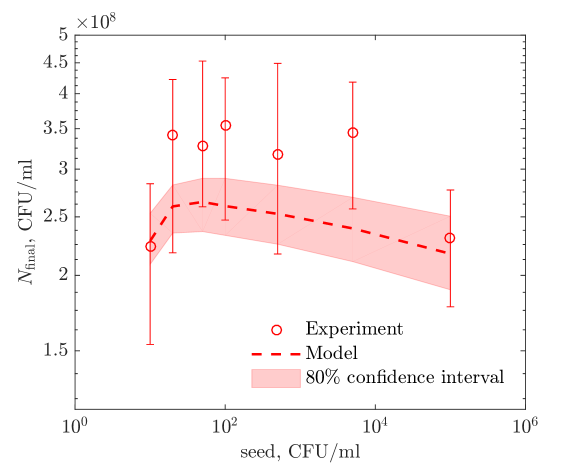
As an independent test of the developed 3-d growth model, we use it to predict results of experiments distinct from those used for fitting the model. Specifically, we investigate how the population size depends on the density of bacteria used to inoculate the soft agar. At a long measurement time (72 hrs), our model predicts a non-monotonic dependence of the population size on the inoculation density (cf. Fig. 5, dashed line). This is because, at very low densities, each colony has access to a large nutrient subvolume, and the colony cannot clear this subvolume by diffusion in just 72 hrs. As a result, at the end of the experiment, there are still nutrients in the media, and the colony does not reach its maximum size. In contrast, at very high inoculating densities, colonies rapidly exhaust their small available nutrient subvolumes, the cell death becomes important throughout much of the experiment duration, and the population is smaller again. Thus the population reaches its maximum at intermediate densities, where these two effects balance. We test this prediction by experimentally measuring population sizes at 72 hrs for E. coli growing in soft agar at inoculums varying from to cells/ml As seen in Fig. 5, the experimental data agree with the prediction within errors and, in particular, exhibit the expected non-monotonicity. We emphasize that no additional fitting was done for this figure, and yet the agreement between the experiment and the theory is very good.
| Name | Description | Literature | References | Fitted value | 80% confidence |
| values | interval | ||||
| maximum growth rate, | [22, 26, 27] | ||||
| half-saturation constant, | [27] | ||||
| yield in liquid, CFU/g glucose | [28, 29] | ||||
| lag phase duration, | [30] | ||||
| death rate, | [19, 27] | ||||
| yield in 3-d colony, CFU/g glucose | N/A | ||||
| glucose diffusion in agar, m2/hr | [31] | ||||
| packing density, | N/A |
Discussion
To our knowledge, the model developed here is the first continuous, rather than agent-based, model to explicitly study bacterial growth as colonies. We consider this the minimal model because it assumes that the availability of nutrients (a carbon source) is the sole factor determining the rate of cell division within colonies. In reality, the cellular growth, division, and death rates would also depend on cell-to-cell interactions of various sorts, on the enrichment and deterioration of the environment due to the buildup of secondary metabolites and waste, on cell-environment mechanical interactions, and on diverse cellular phenotypic commitments. The model we developed and experimentally tested here only accounts for the spatial heterogeneity in access to the diffusing nutrient and assumes no such additional effects [32, 33, 20].
Nevertheless, despite these limitations, with only five parameters describing the growth in liquid, and only three additional parameters specific to the 3-d colony growth, this model provides an impressively accurate description of growth of populations of E. coli as colonies in soft agar as well as planktonic cells in liquid. Unlike the anticipated and observed nearly precipitous termination of growth in liquid culture as nutrients become depleted, our 3-d model accounts for the experimentally observed gradual reduction in net rate of replication as diffusion of the resource increasingly limits colony growth with time. With no additional fitting, the model also correctly predicted the non-monotonic, upside-down U shaped dependence of the population size on the inoculating bacterial density. Moreover, all of the best-fit parameters inferred from the data agreed with prior estimates in the literature, where these are available (see Table 1 and references therein), indicating high-quality fits without overfitting.
Our study has revealed and/or confirmed several intriguing observations about bacteria growing in colonies. First, the growth in colonies yielded substantially greater viable cell densities than obtained in liquid culture with the same concentrations of limiting carbon source. We propose that this is a direct consequence of the diffusion-limited growth, which happens at a slower division rate. In turn, slow division is correlated with smaller size of bacterial cells [25], resulting in more bacteria for the same nutrient amount. This slowing down is very important phenotypically — according to our model, over of all bacteria in the colony are formed at such decreased growth rate, and the yield is an average over yields at different stages of the slowing. We will explore the relation between the division rate and the cell size experimentally in a future publication. A natural extension of our model would come from measuring the dependence of the yield on the growth rate and then verifying if both the liquid and the colony growth can be described by the same dependence .
Our second intriguing observation, which is supported by two independent sets of measurements, is that the packing density inside colonies is very low, CFU/m3, so that the vast majority of a volume of a colony is not occupied by viable cells. It is possible that the colonies are, indeed, largely void of viable cells, with extracellular fluids and matrix fibers filling in the gaps. Another possibility is that cells deep inside the colony are dead or dormant due to the absence of nutrients, or due to other effects, such as mechanical stresses, so that the viable cells that we measure are a minority of all the bacterial cells that existed. Our experiments show no evidence for such deviations from the minimal growth model, but it is clear that additional studies, including direct imaging of the colony structure, must be done in the future.
One interpretation of the close fit between the predictions of this minimal model and the results of our soft-agar experiments is that heterogeneities beyond nutrient access contribute little to the growth dynamics of bacteria in colonies. It remains to be tested how general this result is. Is the E. coli in glucose-limited minimal medium used in this experiment exceptional? Will the results hold for other bacterial species and for complex media, like broth? We propose that the minimal model developed here be used as a baseline to address such question of generality with other bacteria and media. Models are most useful when they do not fit data and thus point to other factors contributing to the studied dynamics. For growth of bacteria in colonies, such factors can be mechanical or other stresses, cell-cell interactions, and others. From an evolutionary perspective particularly intriguing in this regard would be studies of growth of bacteria in colonies initiated with multiple cells of different genotypes (or even species), where deviations from the model could signal such important phenomena as clonal competition or cooperation within a clone.
Materials and Methods
Bacteria
Media, culture and sampling procedures
Overnight cultures were grown in Lysogeny Broth (LB), Becton Dickinson (Franklin Lakes, NJ, USA), diluted in saline and introduced into in liquid or into Bacto agar with Davis minimal salts[35] supplemented with glucose as the sole and limiting carbon source. The liquid cultures were maintained with 10 ml of the medium in 50 ml flasks. For the 3-d colony experiments, of bacteria suspended in soft agar were put into the wells of 6-well Costar Macrotiter plates, set in a tray with distilled water to reduce the rate of evaporation.
Sampling
The viable cell densities in both the liquid and soft agar cultures were estimated by serial dilution in saline and plating on LB agar. The bacteria from the soft agar in each well were taken up with Samco Scientific long transfer pipettes, VWR International, transferred to glass tubes with 10 ml of saline. To suspend the bacteria in the soft agar, tubes with the 10 ml of saline and 3 ml of soft agar were disrupted with the long transfer pipettes until the soft agar was fully mixed with saline, and then vortexed for 30 seconds.
Numerical solution of the model
The well-mixed Monod model, Eqs. (1), (2), was solve using ode15s MatLab routine. To solve the growth equations Eqs. (3)-(5) numerically, we rewrote the equations in spherically symmetric coordinates, and then discretize the space into concentric shells so that the partial differential equations become sets of coupled ordinary differential equations describing dynamics within each shell. These were then solved again using Matlab’s ode15s, with an additional constraint that redistributed the total number of bacteria into a bacterial colony with the constant cell packing density, as in Eq. (5), at every time step. That is, each discretized shell of the space had a maximum cellular capacity given by the packing density and the shell volume. The constraint redistributed those cells that overflowed each shell’s capacity to the colony’s edge, but we did not shrink the inner shells when the cells in them started dying. Newly grown cells are first filled in the colony’s current edge shell. If the current edge shell is overflowed, the extra cells are filled in the next shell, and so on.
Model fitting and confidence intervals estimation
We first fitted the five parameters of the Monod model for the growth in the liquid culture, Eqs. (1), (2). For this we defined the loss function , where was the population size (in CFU/ml) in the ’th measurement, and was the model prediction for the same time and for given parameter values. Note that we did not average measurements at the same , but incorporated all individual observations into the loss function, cf. Fig. 4. We optimized over the five parameters using MatLab’s fmincon. For and , which are small and have large uncertainties, we optimized w. r. t. their logarithms, thus enforcing their positivity (the other parameters were sufficiently constrained by data away from zero even without this reparameterization). The optimization was performed with ten different random initial conditions for the parameters, and the best values from among all the runs were chosen, resulting in the best-fit parameters , which we report in Tbl. 1.
To estimate the confidence intervals for these inferences, we bootstrapped the data 1000 times [36]. When re-sampling with replacements for bootstrapping, we resampled separately from the exponential growth region ( hrs) and the saturated region ( hrs), so that the number of data points in each of the regions was fixed in all resampled datasets. We refitted the five growth parameters for each of the resampled data sets. The middle 80% of the best-fit parameter realizations are reported in Tbl. 1 as confidence intervals, and the covariances among the bootstrapped best-fit values are reported in Tbl. 2. Since the sensitivities to the parameters vary widely, and near its minimum is badly approximated by a quadratic form, we additionally report confidence intervals directly on the model predictions, rather than just the parameters. For this, for each of the 1000 resampled datasets, we calculated the population growth with the best-fit parameters, and the middle 80% of these growth curves are shown as the colored band in Fig. 4 (top).
For fitting the 3-d growth model, Eqs. (3)-(5), we write the loss function . This is minimized as above over , with the first four parameters inherited from the optimizations for liquid data. Results of the optimization are shown in Fig. 4 (bottom). To establish confidence intervals, we bootstrap the entire analysis pipeline 30 times (the number is limited since parameter optimizations for PDEs describing the nutrient dynamics are computationally costly), resampling both the liquid and the 3-d colony data. While resampling the colony data, we keep the number of data points in each of the three regions constant (exponential, , diffusion-limited, , and saturated, ). Confidence intervals on parameters and model predictions in Fig. 4 (bottom) and Fig. 5 are then done as explained above. We use the same bootstrapped data sets to estimate the covariances and correlations of the parameters (Tbl. 2). These are evaluated as empirical covariances and correlation coefficients of the best-fit values for the bootstrapped data sets.
Supporting Information
| , | , | , CFU/g glucose | , | , | , | , | , |
|---|---|---|---|---|---|---|---|
| 0.029 | 0.19 | 0.0018 | 0.0041 | 0.0047 | 6.0 | 0.018 | 5.1 |
| 0.99 | 3.4 | 0.022 | 0.047 | 0.23 | 0.11 | -0.018 | 0.0056 |
| 0.022 | 0.015 | 0.0049 | -0.0021 | 0.061 | 0.0023 | -0.0012 | 1.0 |
| 0.26 | 0.19 | 0.046 | 0.041 | -0.018 | 0.0035 | -0.021 | -2.8 |
| 0.12 | 0.082 | 0.81 | 0.50 | 1.8 | 0.070 | -0.089 | 9.1 |
| 0.021 | 0.014 | 0.23 | 0.14 | 0.28 | 0.018 | -0.012 | 4.5 |
| 0.25 | 0.26 | -0.046 | -0.33 | 0.041 | -0.27 | 0.12 | 0.0033 |
| 0.19 | 0.18 | 0.11 | -0.12 | 0.24 | 0.27 | 0.77 | 1.5 |
The upper right quadrant shows in Roman font the covariance of the fitted parameters established by bootstrapping (see Materials and Methods). The diagonal are the parameter variances. The lower left quadrant shows the correlation coefficients in Italic. Units for the parameters are the same as in Table 1. While we report these values, we emphasize that these values must be interpreted with care since posterior distributions of the parameters are sloppy [37] and do not look like multivariate normal distributions. Instead they show long nonlinear ridges of parameters with nearly-equivalent likelihoods.
Acknowledgments
This work was partially supported by the James S. McDonnell Foundation grant No. 220020321 (IN), by the National Science Foundation grant No. PoLS-1410978 (IN), and by GM098175 (BL).
References
- 1. Monod J. Recherches sur la croissance des cultures bacteriennes. Hermann; 1942.
- 2. Monod J. The growth of bacterial cultures. Ann Rev Microbiol. 1949;3:371–394.
- 3. Kubitschek HE. Introduction to research with continuous cultures. Prentice-Hall; 1970.
- 4. Stewart F, Levin B. Partitioning of Resources and the Outcome of Interspecific Competition: A Model and Some General Considerations. American Naturalist. 1973;107(954):171–198.
- 5. Ben-Jacob E, Schochet O, Tenenbaum A, Cohen I, Czirok A, Vicsek T. Generic Modeling of Cooperative Growth-Patterns in Bacterial Colonies. Nature. 1994;368:46–49.
- 6. Ben-Jacob E, Cohen I, Shochet O, Tenenbaum A, Vicsek T, Czirok A. Cooperative Formation of Chiral Patterns During Growth of Bacterial Colonies. Phys Rev Lett. 1995;75:2899–2902.
- 7. Croze OA, Ferguson GP, Cates ME, Poon WC. Migration of chemotactic bacteria in soft agar: role of gel concentration. Biophys J. 2011;101:525–534.
- 8. Rudge TJ, Federici F, Steiner PJ, Kan A, Haseloff J. Cell polarity-driven instability generates self-organized, fractal patterning of cell layers. ACS Synth Biol. 2013;2:705–714.
- 9. Liu C, Fu X, Liu L, Ren X, Chau C, Li S, et al. Sequential establishment of stripe patterns in an expanding cell population. Science. 2011;334(6053):238–241.
- 10. Asally M, Kittisopikul M, Rue P, Du Y, Hu Z, Cagatay T, et al. Localized cell death focuses mechanical forces during 3D patterning in a biofilm. Proc Natl Acad Sci (USA). 2012;109:18891–18896.
- 11. Wei Y, Wang X, Liu J, Nemenman I, Singh A, Weiss H, et al. The population dynamics of bacteria in physically structured habitats and the adaptive virtue of random motility. Proc Natl Acad Sci (USA). 2011;108(10):4047–4052.
- 12. Kim W, Racimo F, Schluter J, Levy S, Foster K. Importance of positioning for microbial evolution. Proc Natl Acad Sci (USA). 2014;111(16):E1639–47.
- 13. Mertz AF, Banerjee S, Che Y, German GK, Xu Y, Hyland C, et al. Scaling of Traction Forces with the Size of Cohesive Cell Colonies. Phys Rev Lett. 2012;108:198101.
- 14. Farrell F, Hallatschek O, Marenduzzo D, Waclaw B. Mechanically Driven Growth of Quasi-Two-Dimensional Microbial Colonies. Phys Rev Lett. 2013;111:168101.
- 15. Ghosh P, Mondal J, Ben-Jacob E, Levine H. Mechanically-driven phase separation in a growing bacterial colony. Proc Natl Acad Sci U S A. 2015;112(17):E2166–73.
- 16. Witten T, Sander L. Diffusion-Limited Aggregation, a Kinetic Critical Phenomenon. Phys Rev Lett. 1981;47:1400–1403.
- 17. Family F. Fractal growth of bacterial colonies. Fractals. 1995;3:869–877.
- 18. Lavrentovich MO, Koschwanez JH, Nelson DR. Nutrient shielding in clusters of cells. Phys Rev E. 2013;87.
- 19. Phaiboun A, Zhang Y, Park B, Kim M. Survival Kinetics of Starving Bacteria Is Biphasic and Density-Dependent. PLoS Comput Biol. 2015 04;11(4):e1004198.
- 20. Saint-Ruf C, Garfa-Traoré M, Collin V, Cordier C, Franceschi C, Matic I. Massive diversification in aging colonies of Escherichia coli. Journal of bacteriology. 2014;196(17):3059–3073.
- 21. Redner S. A Guide to First-Passage Processes. Cambridge UP; 2007.
- 22. Pierucci O. Dimensions of Escherichia coli at various growth rates: model for envelope growth. J Bacteriol. 1978;135(2):559–74.
- 23. Taheri-Araghi S, Bradde S, Sauls JTT, Hill NSS, Levin PAA, Paulsson J, et al. Cell-Size Control and Homeostasis in Bacteria. Curr Biol. 2014;25(3):385–391.
- 24. Simonsen L. Dynamics of plasmid transfer on surfaces. J Gen Microbiol. 1990;136:1001–1007.
- 25. Ecker RE, Schaechter M. Bacterial growth under conditions of limited nutrition. Annals NY Acad Sci. 1963;102:549–563.
- 26. Pelletier J, Halvorsen K, Ha BY, Paparcone R, Sandler SJ, Woldringh CL, et al. Physical manipulation of the Escherichia coli chromosome reveals its soft nature. Proc Natl Acad Sci. 2012;109(40):E2649–E2656.
- 27. Füchslin HP, Schneider C, Egli T. In glucose-limited continuous culture the minimum substrate concentration for growth, Smin, is crucial in the competition between the enterobacterium Escherichia coli and Chelatobacter heintzii, an environmentally abundant bacterium. ISME J. 2012;6(4):777–89.
- 28. Levin BR. Coexistence of Two Asexual Strains on a Single Resource. Science. 1972;175(4027):1272–1274.
- 29. Chao L, Levin BR. Structured habitats and the evolution of anticompetitor toxins in bacteria. Proc Natl Acad Sci U S A. 1981;78(10):6324–6328.
- 30. Buchanan R, Klawitter L. The effect of incubation temperature, initial pH, and sodium chloride on the growth kinetics of Escherichia coli O157: H7. Food Microbiology. 1992;9(3):185–196.
- 31. van Stroe-Biezen SAM, Everaerts FM, Janssen LJJ, Tacken RA. Diffusion coefficients of oxygen, hydrogen peroxide and glucose in a hydrogel. Analytica chimica acta. 1993;273:553–560.
- 32. Asally M, Kittisopikul M, Rue P, Du Y, Hu Z, Cagatay T, et al. Localized cell death focuses mechanical forces during 3D patterning in a biofilm. Proc Natl Acad Sci (USA). 2012;109:18891–18896.
- 33. Wentland EJ, Stewart PS, Huang CT, McFeters Ga. Spatial variations in growth rate within Klebsiella pneumoniae colonies and biofilm. Biotechnol Prog. 1996;12(3):316–321.
- 34. Lenski RE, Rose MR, Simpson SC, Tadler SC. Long-term experimental evolution in Escherichia coli. I. Adaptation and divergence during 2,000 generations. American naturalist. 1991;p. 1315–1341.
- 35. Carlton B, Brown B. Gene mutation in Manual of Methods for General Bacteriology. Gerhardt et al, ed, American Society for Microbiology, Washington, DC. 1981;.
- 36. Efron B, Tibshirani R. An introduction to the bootstrap. Boca Raton, FL: Chapman & Hall/CRC; 1994.
- 37. Gutenkunst RN, Waterfall JJ, Casey FP, Brown KS, Myers CR, Sethna JP. Universally sloppy parameter sensitivities in systems biology models. PLoS Comp Biol. 2007;3(10):1871–1878.