FAST MAPPING OF TERAHERTZ BURSTING THRESHOLDS AND CHARACTERISTICS AT SYNCHROTRON LIGHT SOURCES
Abstract
Dedicated optics with extremely short electron bunches enable synchrotron light sources to generate intense coherent THz radiation. The high degree of spatial compression in this so-called low- optics entails a complex longitudinal dynamics of the electron bunches, which can be probed studying the fluctuations in the emitted terahertz radiation caused by the micro-bunching instability (“bursting”). This article presents a “quasi-instantaneous” method for measuring the bursting characteristics by simultaneously collecting and evaluating the information from all bunches in a multi-bunch fill, reducing the measurement time from hours to seconds. This speed-up allows systematic studies of the bursting characteristics for various accelerator settings within a single fill of the machine, enabling a comprehensive comparison of the measured bursting thresholds with theoretical predictions by the bunched-beam theory. This paper introduces the method and presents first results obtained at the ANKA synchrotron radiation facility.
pacs:
no PACS numbers yetI Introduction
Short intense pulses of coherent synchrotron radiation (CSR) in the terahertz (THz) frequency range are generated at synchrotron radiation facilities when electron bunches are compressed to picosecond timescales. In this operation mode the high degree of spatial compression of the optics with reduced momentum compaction factor (“low- optics”) entails complex longitudinal dynamics of the electron bunches, leading to the so-called micro-bunching instability. This causes time-dependent fluctuations and strong bursts in the radiated THz intensity and is characterized by a threshold current per bunch, the so-called bursting threshold.
The bursting threshold in the generation of CSR was studied at several synchrotron light sources, e.g. ANKA Müller (2010), BESSY II Abo-Bakr et al. (2003), DIAMOND Shields et al. (2012), MLS Wüstefeld et al. (2010), NSLS VUV Ring Carr et al. (1999) and SOLEIL Evain et al. (2012). One of the first theoretical explanations of this threshold was given by Stupakov Stupakov and Heifets (2002). Later work extended the theory by considering self-interactions due to CSR and shielding effects due to the vacuum chamber, considering coasting or bunched electron beams Venturini and Warnock (2002); Stupakov and Heifets (2002); Bane et al. (2010); Cai (2011). First comparisons between the measured bursting threshold and theoretical models were done for the bunched-beam theory in Cai (2011) and Ries et al. (2012).
This article presents a novel “quasi-instantaneous” approach to study the bursting threshold, based on high-rate sampling over many turns of the radiation emitted from all electron bunches circulating in the ANKA storage ring. These so-called “snapshot measurements” drastically reduce the time necessary for mapping the bursting behavior and the bursting threshold at different machine settings. The measured bursting thresholds at these different configurations are compared to the bunched-beam theory Bane et al. (2010), which is briefly outlined below.
II Bunched-Beam theory
For wavelengths longer than the emitting charge structure, synchrotron radiation is emitted coherently with a spectral power proportional to the number of electrons squared, the power spectrum of a single electron and a form factor, which is the modulus squared of the Fourier transform of the normalized charge distribution of the radiating electron bunch Müller et al. (2012). If sufficiently narrow sub-structures exits, CSR can be emitted at shorter wavelengths than expected from the natural bunch length. In a storage ring, above a certain threshold in the bunch current, the CSR impedance causes a modulation of the longitudinal phase space, which gives rise to time-evolving sub-structures in the longitudinal particle distribution. As a consequence of continuous changes in the form factor, this micro-bunching instability Stupakov and Heifets (2002) leads to strong fluctuations in the emitted CSR power, referred to as bursting, which occur with characteristic frequencies. Formally the occurrence of sub-structures in the longitudinal phase space above the bursting threshold can be described by the Vlasov-Fokker-Planck equation Venturini and Warnock (2002), taking into account the geometry of the storage ring and accelerator parameters, like the accelerating voltage and the momentum compaction factor.
The bunched-beam theory Bane et al. (2010) describes the influence of the vacuum chamber on a bunched electron beam. The resulting condition for the bursting threshold, , as a function of the shielding parameter , in the following taken from the parallel plates model Bane et al. (2010) for a vacuum chamber of height , is found to be
| (1) |
Here the threshold is expressed in terms of the CSR strength , with , the normalized bunch current, the bunch current, the bending radius, the natural bunch length, the momentum compaction factor, the relative energy spread, the Lorentz factor and the Alfvén current. The momentum compaction factor and the natural bunch length are determined by the beam energy , the synchrotron frequency , the RF frequency , the revolution frequency , the RF peak voltage and the radiated energy per particle and revolution as
| (2) |
The above relations allow to express the bunch current at the bursting threshold
| (3) |
as a function of parameters characterizing the longitudinal beam dynamics: the momentum compaction factor, the energy spread and the natural bunch length and, therefore, the RF-voltage and the synchrotron frequency. Likewise, using these dependencies, studies of the bursting threshold allow non-invasive diagnostics of the beam dynamics in longitudinal phase space.
III Experimental setup
The core of the ANKA synchrotron radiation source of the Karlsruhe Institute of Technology, Germany, is a 110.4 m long electron storage ring, operating in the energy range from 0.5 GeV to 2.5 GeV. The low- mode at ANKA allows the reduction of the bunch length down to a few picoseconds Müller et al. (2005). A state-of-the-art bunch-by-bunch feedback system Hertle et al. (2014) is used to generate custom filling patterns (e.g., a single bunch, arbitrary bunch distances and varying bunch currents) required for the beam dynamics studies presented in this paper.
For the investigations of the micro-bunching instability at ANKA, a variety of fast THz detector systems are used in combination with fast, in-house built, high-repetition-rate data acquisition (DAQ) systems. For the bunch-by-bunch, turn-by-turn studies of the rapidly fluctuating THz radiation, fast detectors with different characteristics, e.g., sensitivity, or noise figures, are available at KIT. One example is an in-house developed THz detector system based on a YBCO sensor Raasch et al. (2015). The investigations of this paper were performed with a broad band quasi-optical Schottky diode (ACST GmbH, Hanau, Gemany) with a sensitivity in the spectral range from several 10 GHz up to 2 THz with the peak sensitivity around 80 GHz Advanced Compound Semiconductor Technologies GmbH() (ACST). With a bunch spacing at ANKA of 2 ns, corresponding to the maximum bunch repetition rate of 500 MHz, the built-in 4 GHz amplifier of the detector is fast enough to resolve the THz pulse of each bunch individually.
The KArlsruhe Pulse Taking and Ultrafast Readout Electronics system (KAPTURE) Caselle et al. (2014a), developed at KIT, implements a memory-efficient approach to acquire the detector signal on a bunch-by-bunch basis. The signal of the fast THz detector is fed via high bandwidth connectors into a track-and-hold unit and a 12-bit, 500 MSa/s analog-to-digital converter. KAPTURE offers up to 4 sampling channels with individual delay units, whose sampling trigger points can be adjusted in 3 ps steps each. This enables a “local sampling” of a detector signal in minimum steps of 3 ps. This local sampling depends on the chosen delays between the channels, with a maximum rate of 330 GSa/s, compared to a global sampling rate of approximately 500 MSa/s in each channel Caselle et al. (2014b).
For the studies detailed below, the fast THz detector measures the THz pulse emitted by each bunch at each turn. The DAQ system, KAPTURE, was configured to record only the amplitude of the detector response to the THz pulse. During a measurement period of one second, the amplitude of the detector pulses for each individual bunch is thus recorded for approximately 2.7 million consecutive turns. In the following, we will refer to this data as the THz signal of each bunch.
IV Beam studies
The threshold current for bursting emission of CSR depends on several (key) beam parameters, such as the momentum compaction factor and the natural bunch length (see Eq. 2). It can therefore be used to access the longitudinal beam dynamics. Furthermore, knowledge of the bunch currents where the micro-bunching instability occurs for a given set of machine parameters is also critical for experiments that rely on stable THz emission.
IV.1 Bursting THz radiation
With the setup described above, the amplitude of the detector response for the individual THz pulse of each bunch is recorded for every turn of over 2.7 million consecutive revolutions. Such a dataset contains the THz trace of all bunches during the measurement time of one second. The first 130 thousand turns of one such dataset are displayed in Fig. 1.
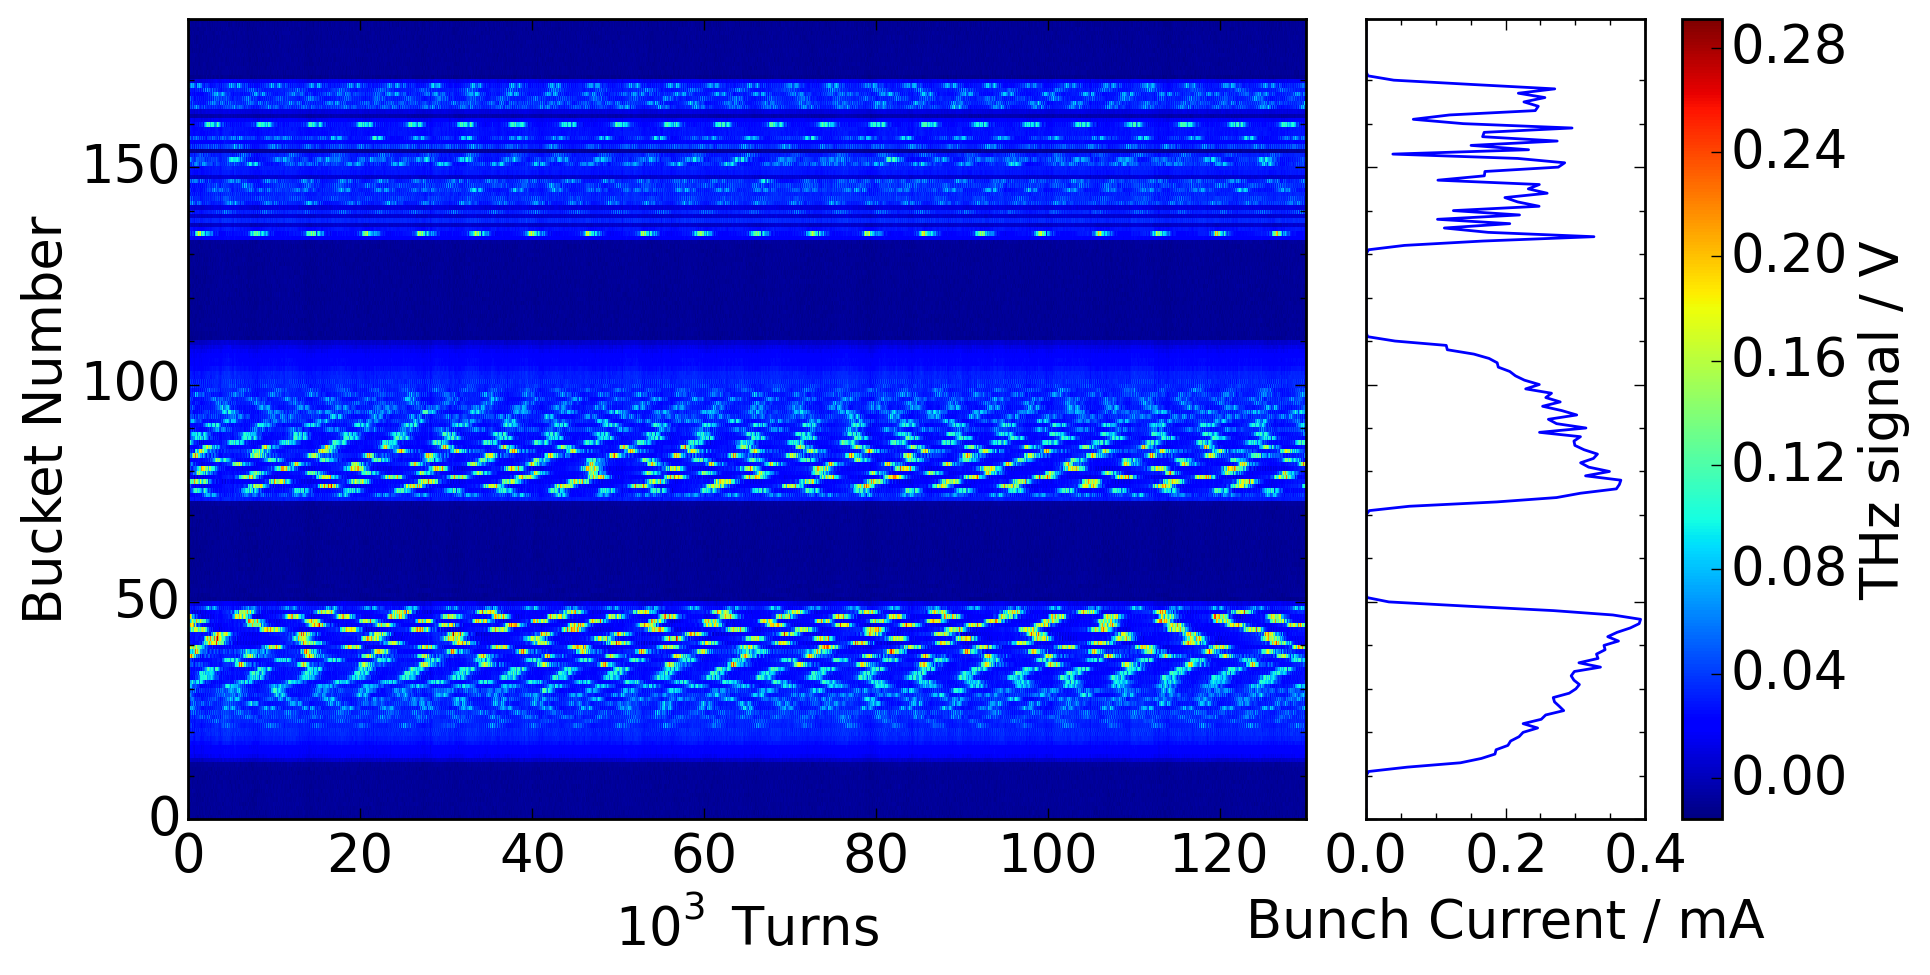
Each horizontal row shows the THz signal as a function of the turn number. A vertical column yields the THz signal for all bunches at a specific turn. The filling pattern for this measurement consisted of three trains with about 30 bunches each (Fig. 1). The bunch currents were measured with a time-correlated single-photon counting setup Kehrer et al. (2015).
The fluctuations in the intensity due to the bursting are clearly visible for each bunch. Bunches with different currents display a different bursting behavior, i.e., temporal evolution of a burst and its repetition rate. To measure these current-dependent changes, a dataset was taken every 10 seconds while the total beam current decreased. Combined with the measured bunch currents, these measurements allow to map fluctuations of the intensity emitted by each bunch as a function of the turn number ( for ANKA) and of the decreasing bunch current (time scale typically between one and several hours).
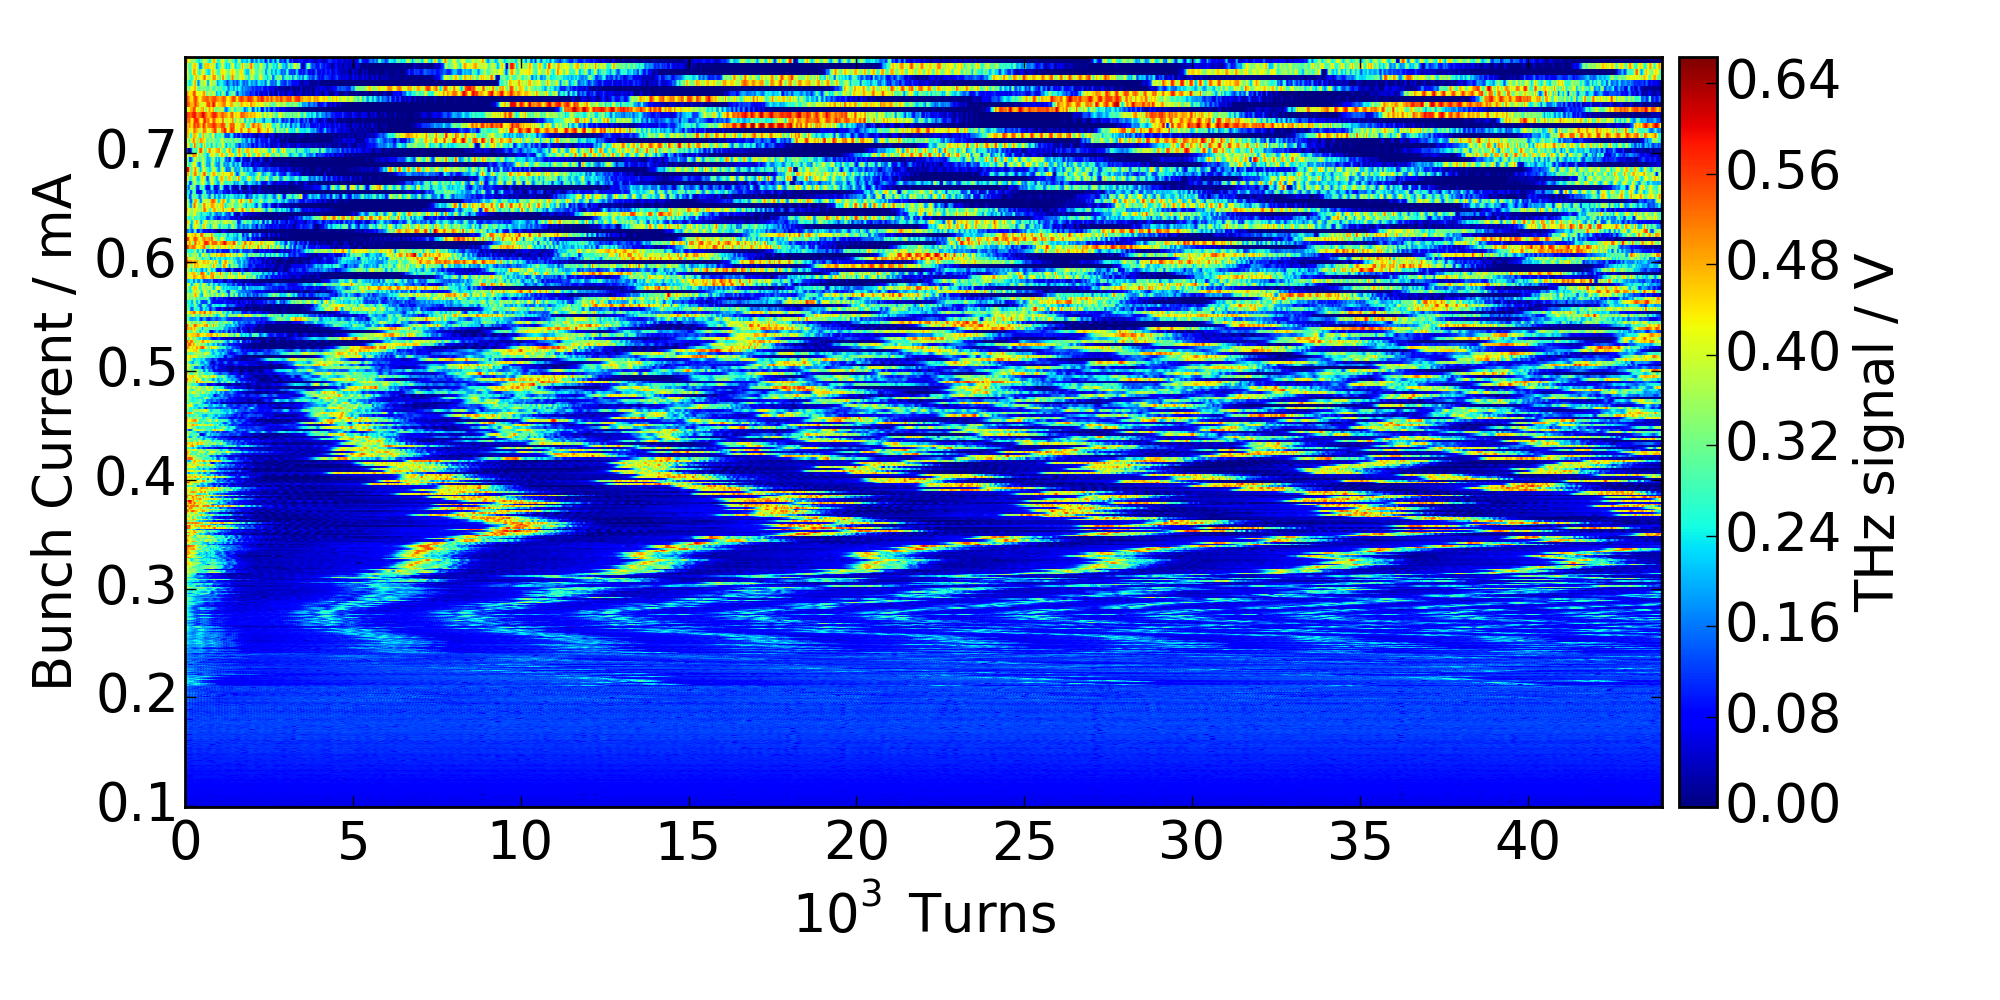
In Fig. 2 the THz signal of one individual bunch is displayed as a function of the decreasing bunch current, showing changes in the bursting behavior as well as the onset of bursting in the detection range of the detector system used for this study, in this case, at 0.2 mA.
IV.2 Fast mapping technique
The measurement technique described in the previous section collects the THz signal traces of all 184 RF-buckets for one second, during which time the bunch currents stay approximately constant. This way, a study of current dependent effects is usually achieved by repeating those one-second-measurements of THz signal traces for changing beam currents. To avoid possible influences from continued beam injection, or in the absence of a full energy injection, the measurement series are performed while the beam current slowly decays due to a limited beam lifetime over a time span of several hours.
The fast mapping technique (the so-called ”snapshot” measurement), enabled by the unique combination of fast THz detectors with high-data-throughput DAQ systems, drastically reduces the time required to cover the full bunch current range of interest: instead of following one single bunch during an hour-long beam current decrease, the technique makes use of the quasi-simultaneous acquisition of all bunches, for this purpose filled to cover the full current range of interest, to achieve the same result in one second. The special, tailored filling pattern required is achieved with the help of a bunch-by-bunch feedback system Hertle et al. (2014).
With such a filling pattern, a snapshot measurement of one dataset within one second is sufficient to analyze the bursting behavior at different bunch currents and to determine the bursting threshold corresponding to the present machine settings. Measurements, which previously lasted typically up to 5 hours, depending on the lifetime of the electron beam, now only require one second or less.
IV.2.1 Mapping the bursting behavior
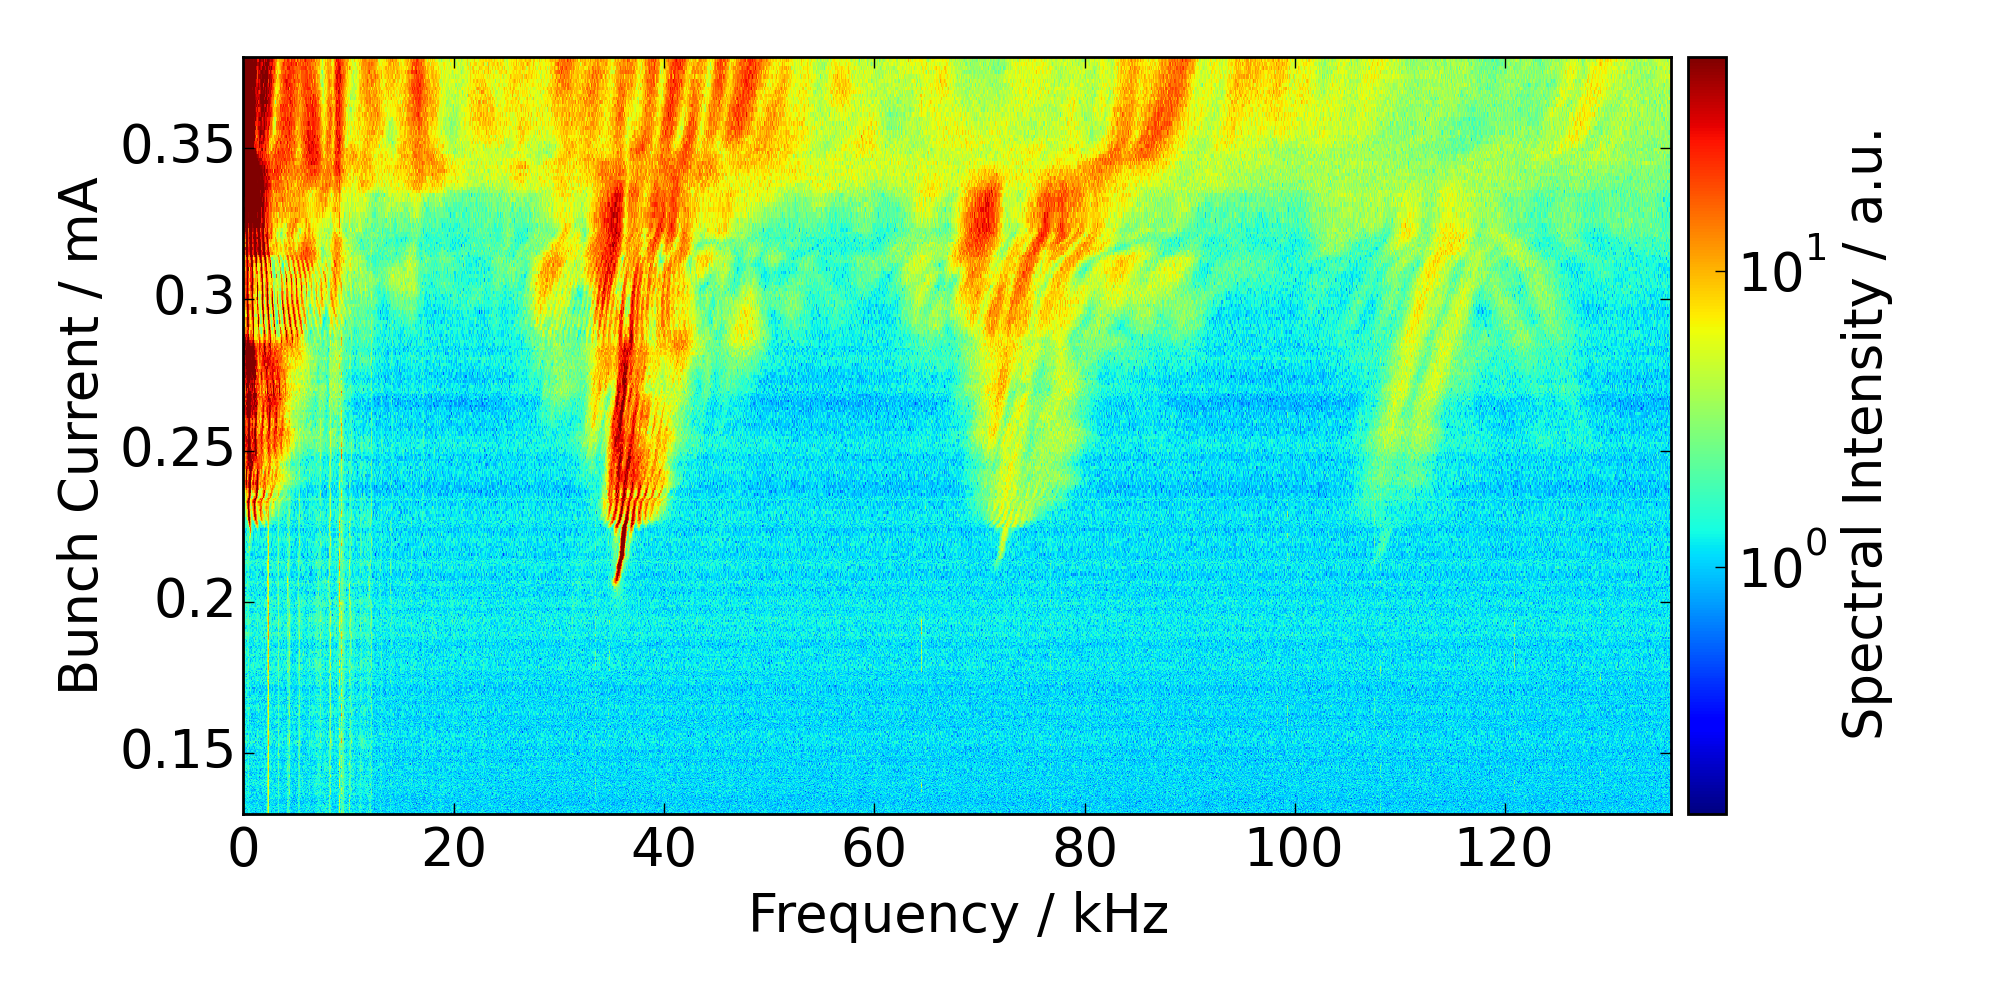
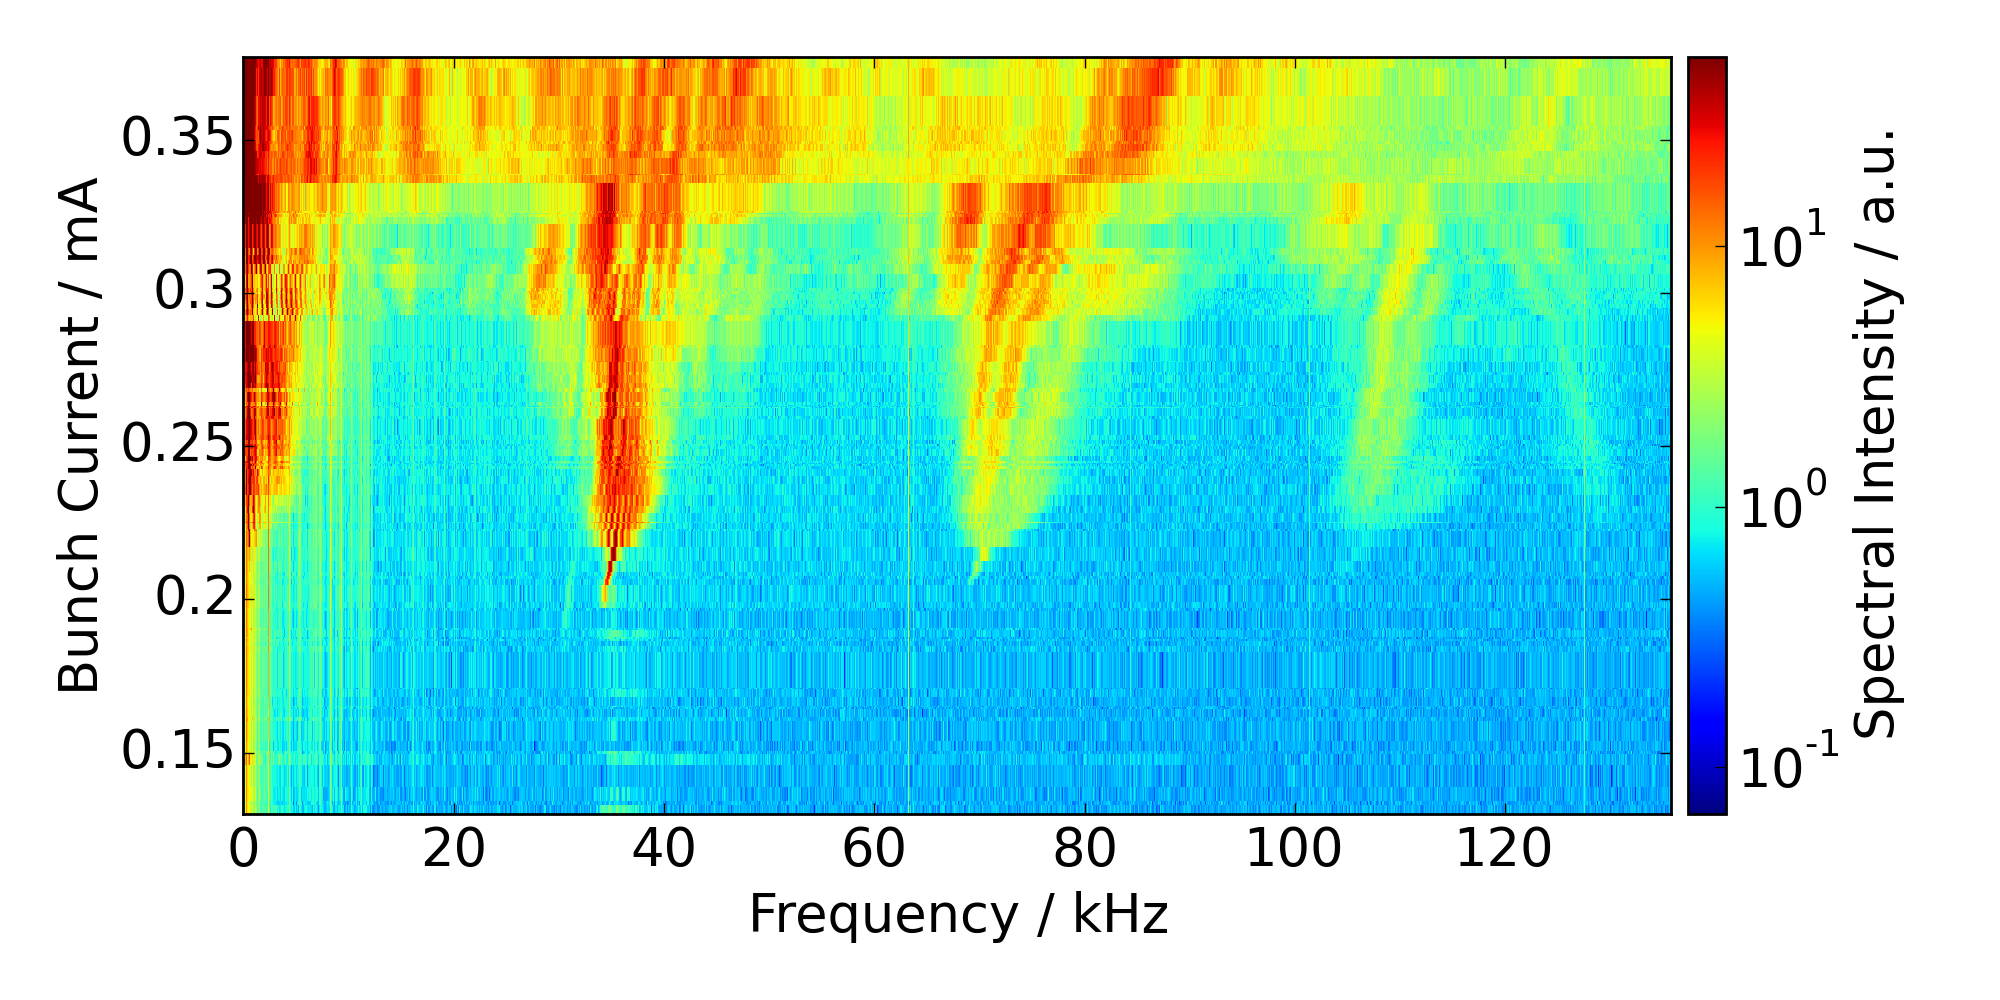
The snapshot measurements offer the opportunity to acquire fast, comprehensive maps of the micro-bunching instability in dependence of various accelerator parameters. To visualize the change in bursting periodicity as a function of the bunch current, the Fourier transform of the THz signal is displayed for the investigated bunch current range in a spectrogram (see Fig.3). Bunch currents that mark a change in the fluctuation of the THz signal and therefore in the driving micro-bunching instability are easily accessible in the visualization Schwarz et al. (2013). With the quasi-simultaneous acquisition of bunches covering the full bunch current range, a spectrogram can now be created from just one dataset.
The resulting spectrogram has a limited resolution on the current axis, due to the limited number of bunches and hence current bins, as shown in Fig. 3b in comparison to the spectrogram obtained from measurements of a single bunch for different bunch currents shown in Fig. 3a. However, the different dominant frequencies and regions are clearly visible and give an overview of the bursting behavior for these accelerator settings. A comparison between the snapshot spectrogram and a spectrogram taken during a standard current decay of one bunch at the same accelerator settings (Fig. 3) shows the excellent agreement of the two methods and that the dominant structures can easily be reproduced by the time-saving snapshot measurement.
IV.2.2 Fast threshold determination
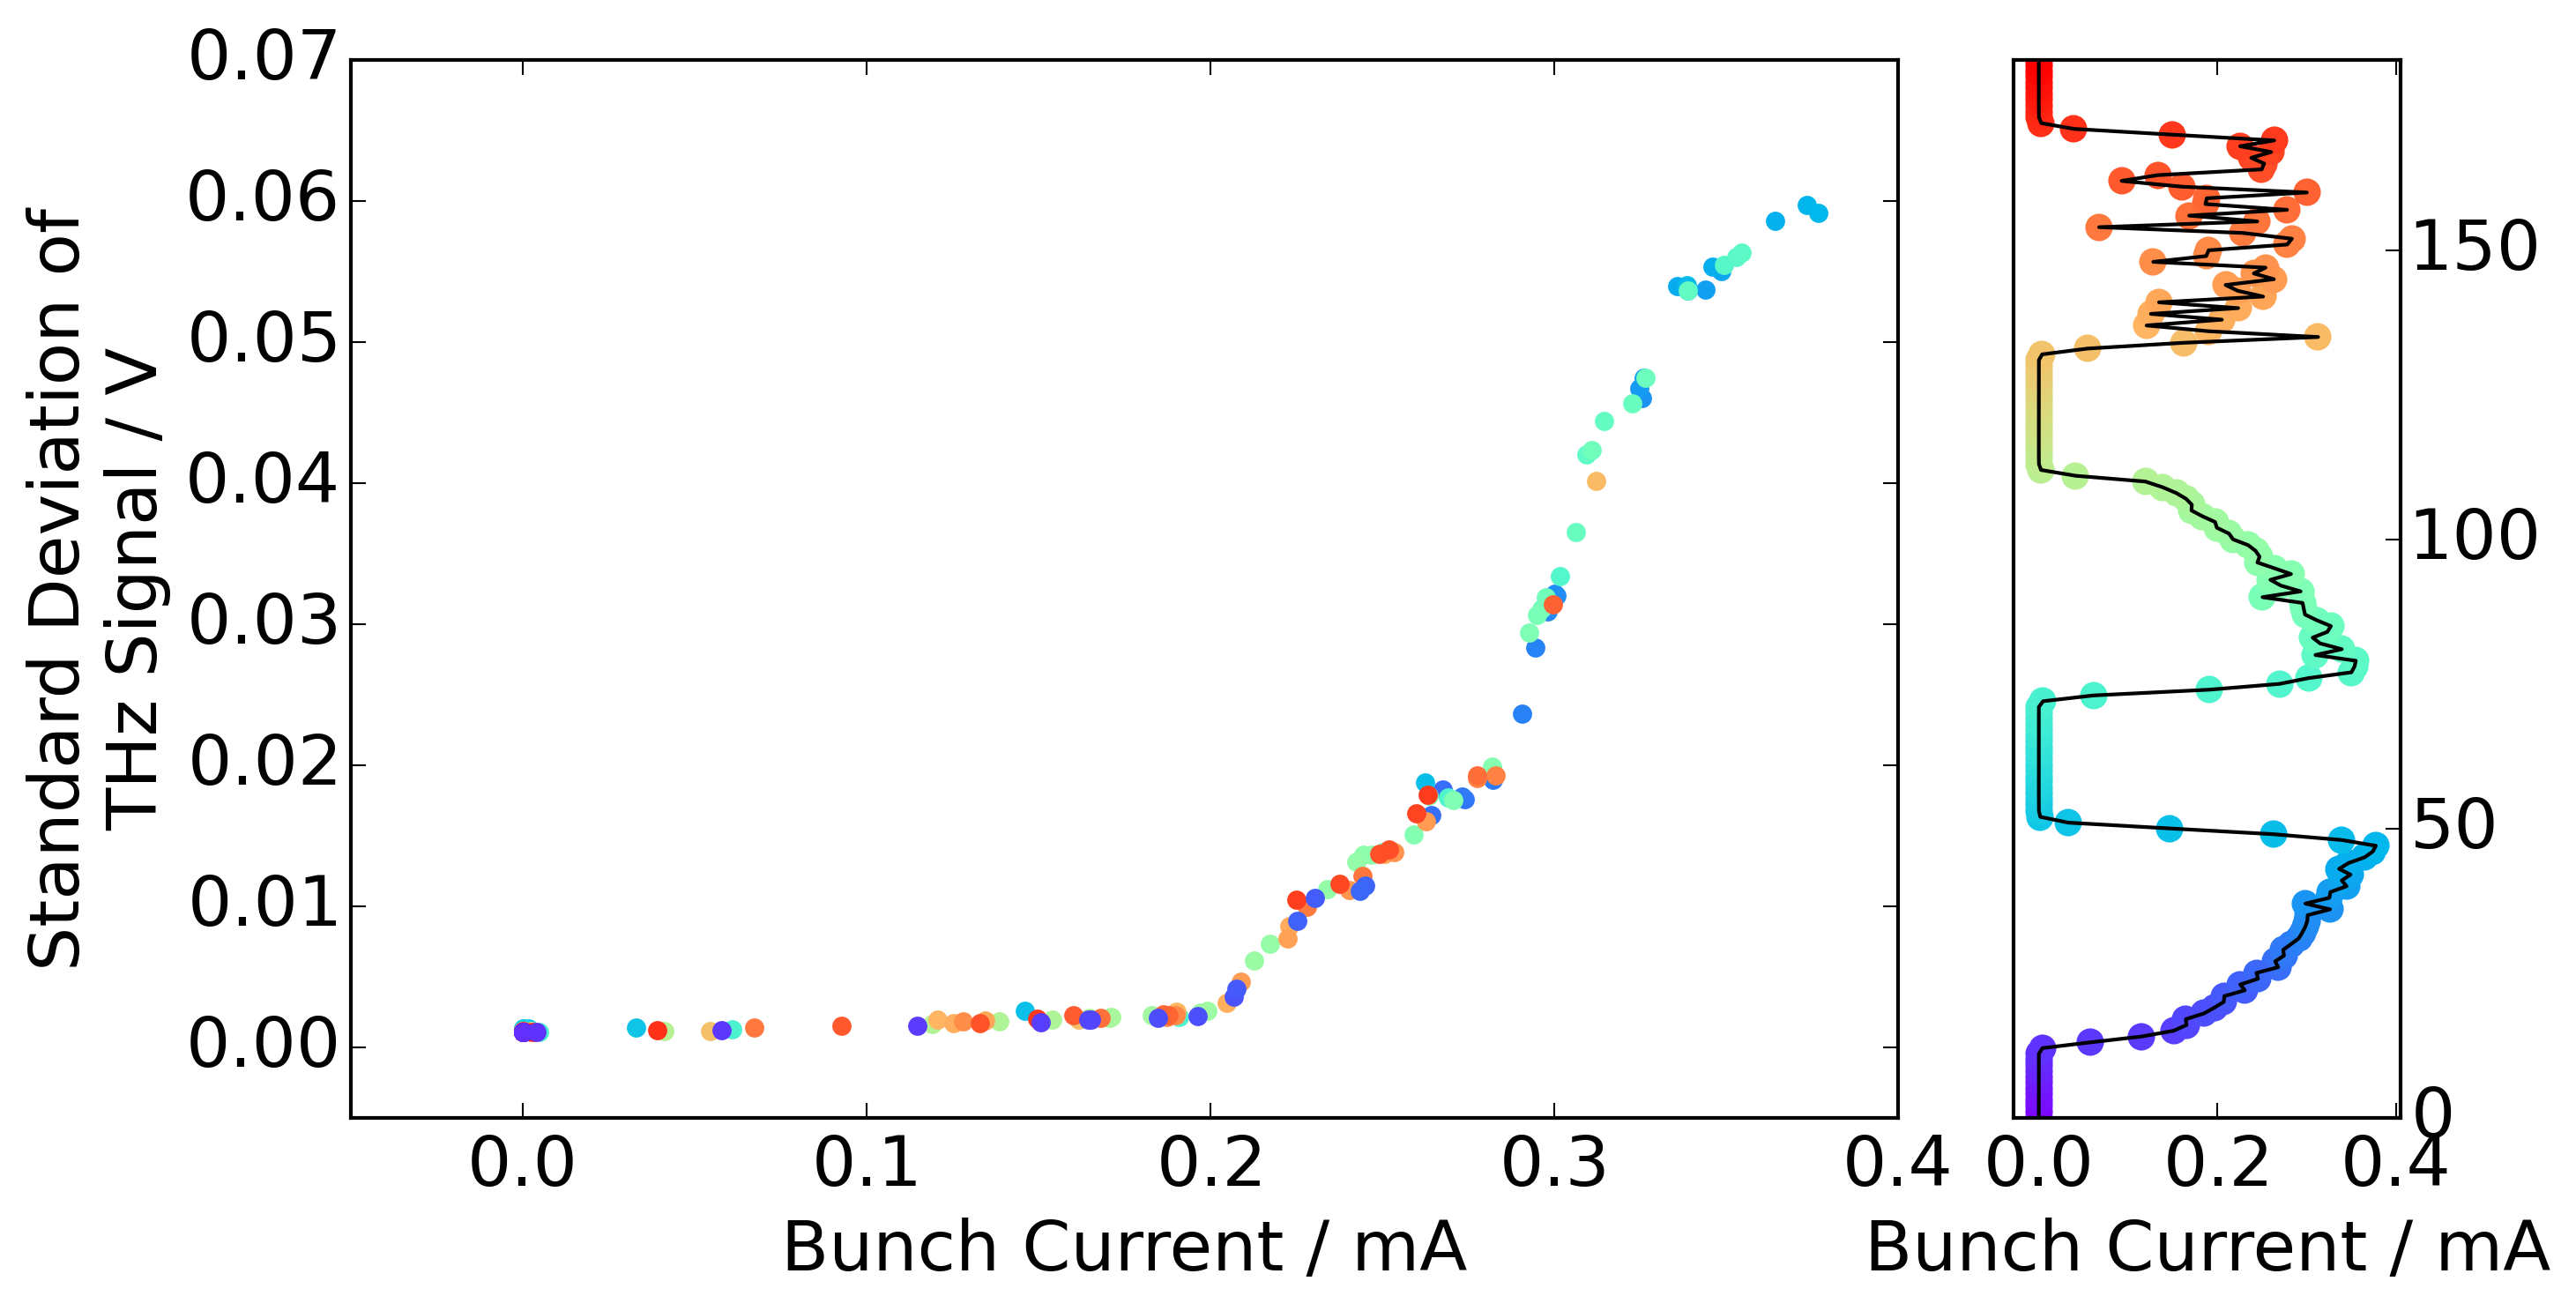
To extract the bursting threshold from a snapshot measurement, the standard deviation of the THz signal of each bunch is calculated and displayed as a function of the momentary current of the bunch in question (Fig. 4). The bursting threshold is immediately visible as a kink in the standard deviation, because the THz signal is stable at currents below the threshold. Above the instability threshold, when the THz signal starts to fluctuate over the turns, the value of the standard deviation increases.
Figure 4 shows that the THz signals of bunches below the threshold of 0.2 mA show hardly any fluctuations compared to the signal of bunches with higher current.
IV.2.3 Bursting threshold and beam optics
The bursting threshold depends on the momentum compaction factor , both directly (Eq. 3) and indirectly through the natural bunch length . Through and it also depends indirectly on the RF-voltage and the synchrotron frequency (Eq. 2).
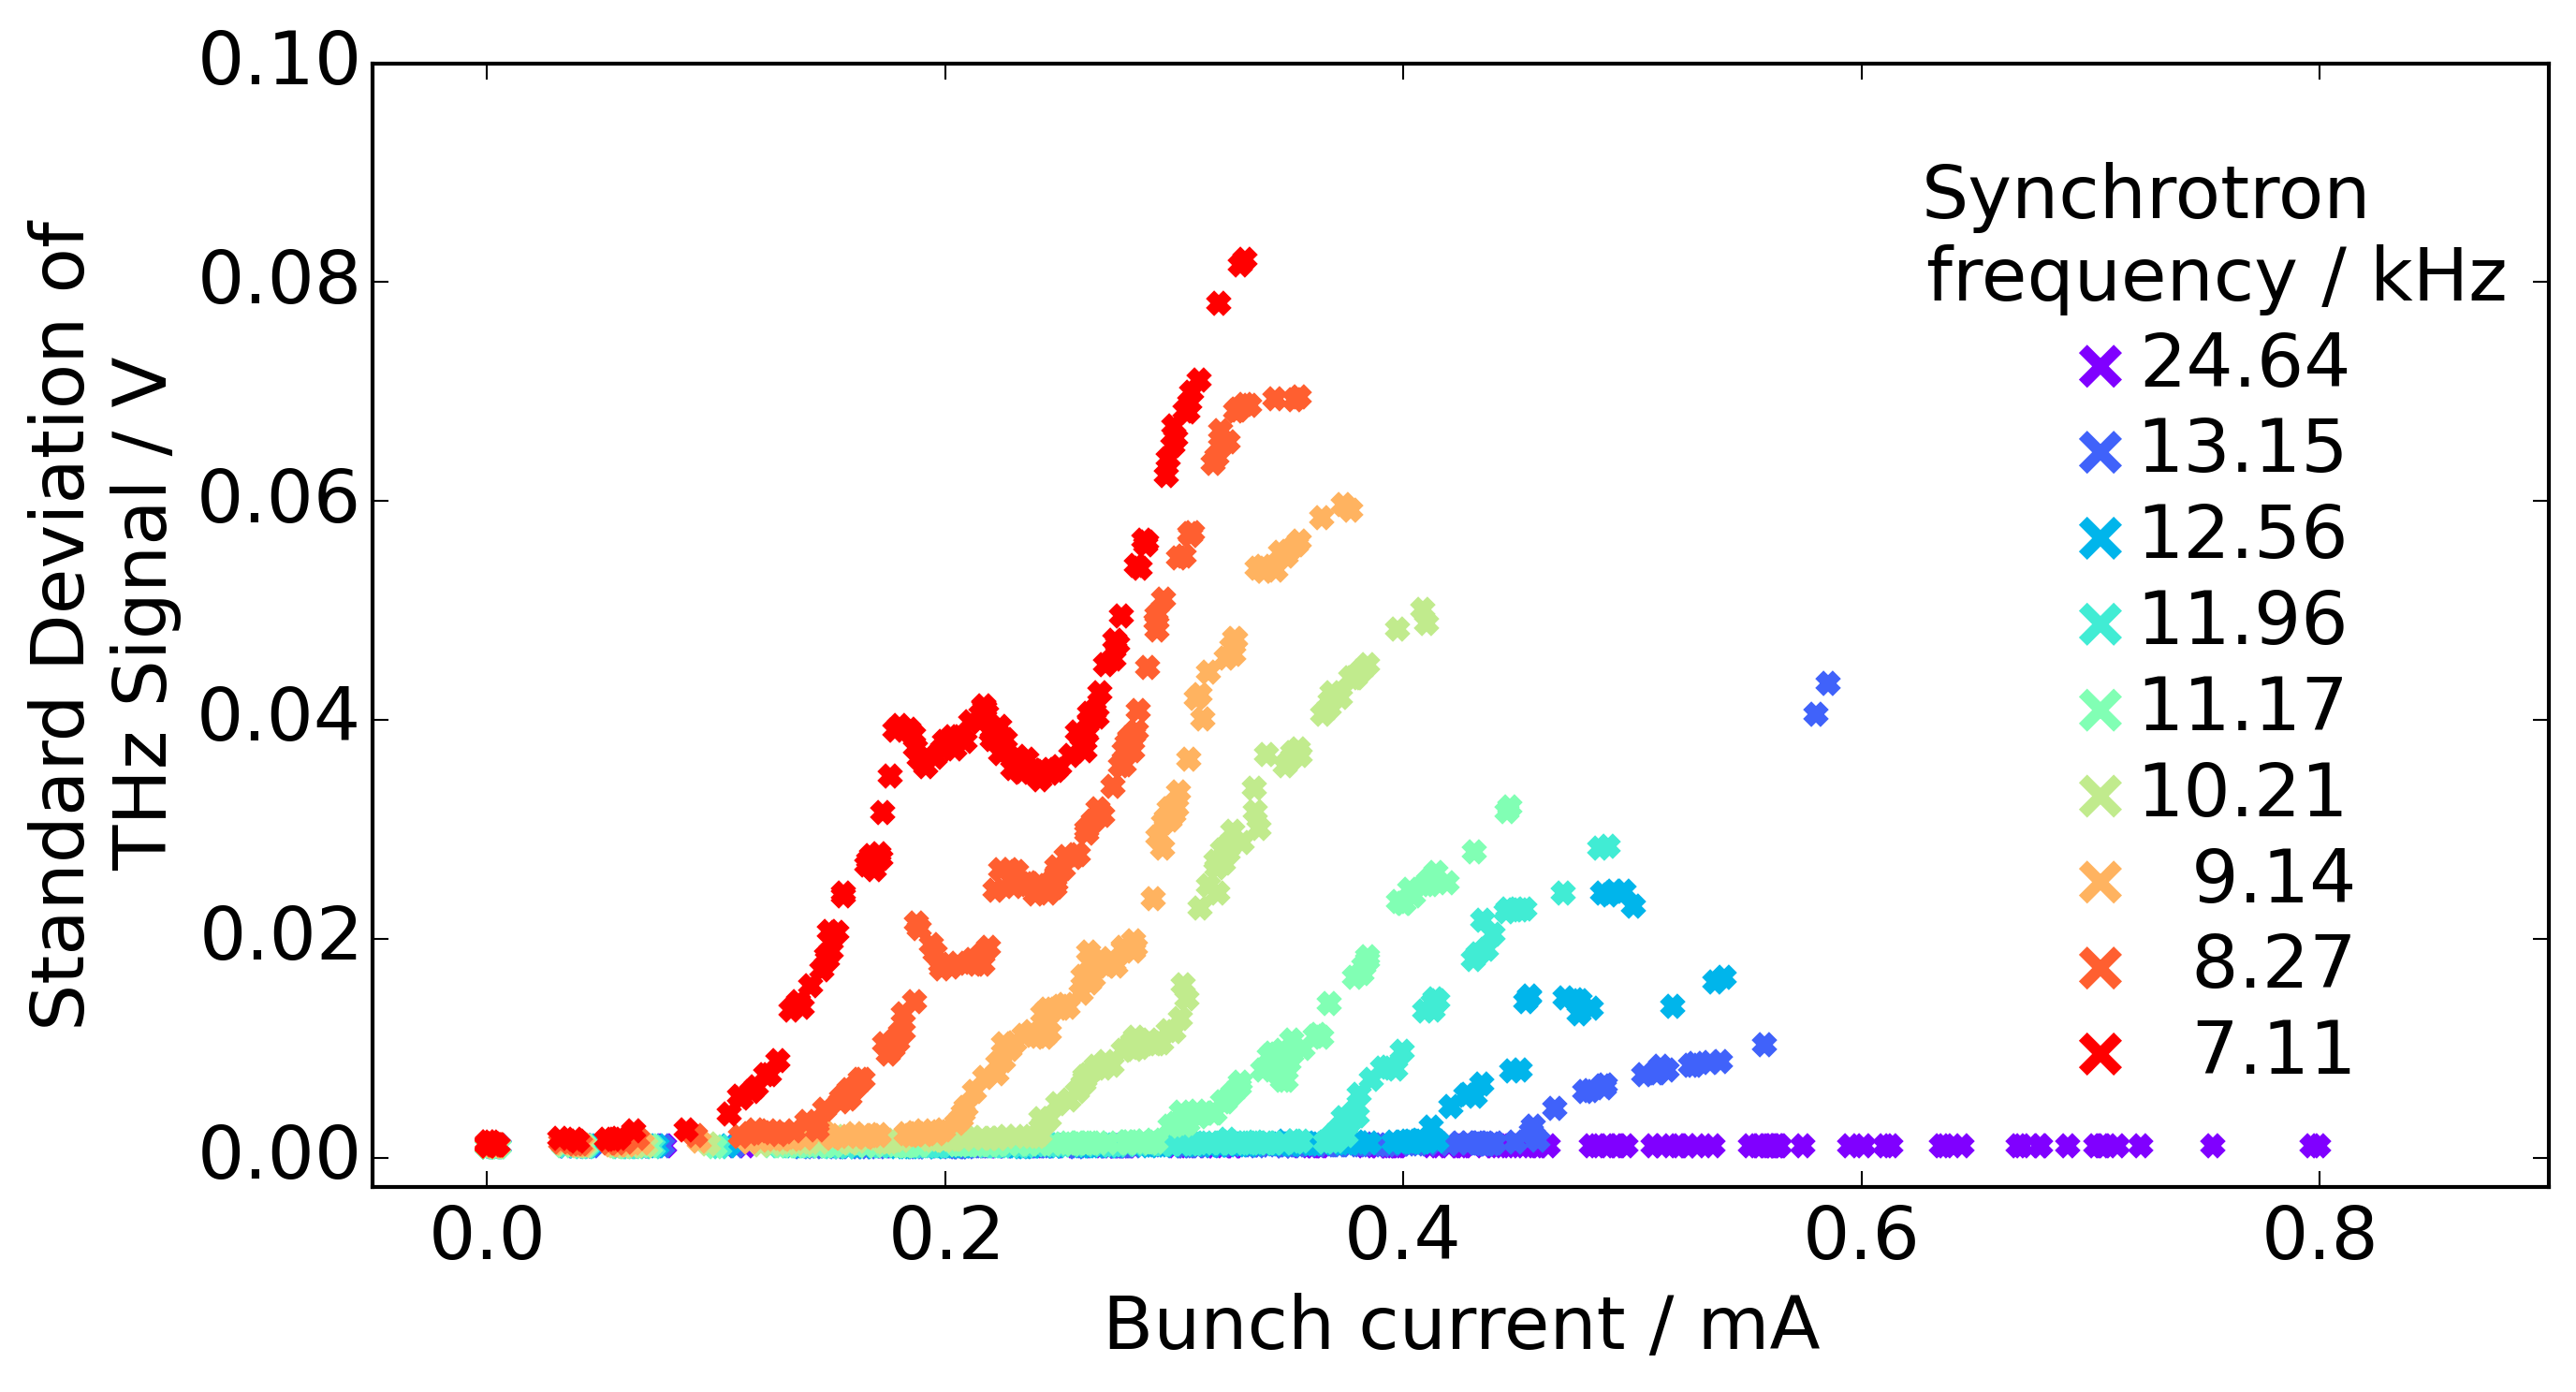
To study these dependencies, snapshot measurements were used to determine the bursting threshold for different settings of the magnet optics, resulting in different values of the momentum compaction factor at a fixed RF-voltage. In the following, the stepwise change of the magnet optics will be referred to as “magnet sweep”. At each step a snapshot measurement was taken. Figure 5 shows the standard deviation of the intensity of the THz signal as a function of the bunch current for several steps of the sweep. With decreasing synchrotron frequency a change in the threshold, i.e., the onset of the fluctuations, is visible.
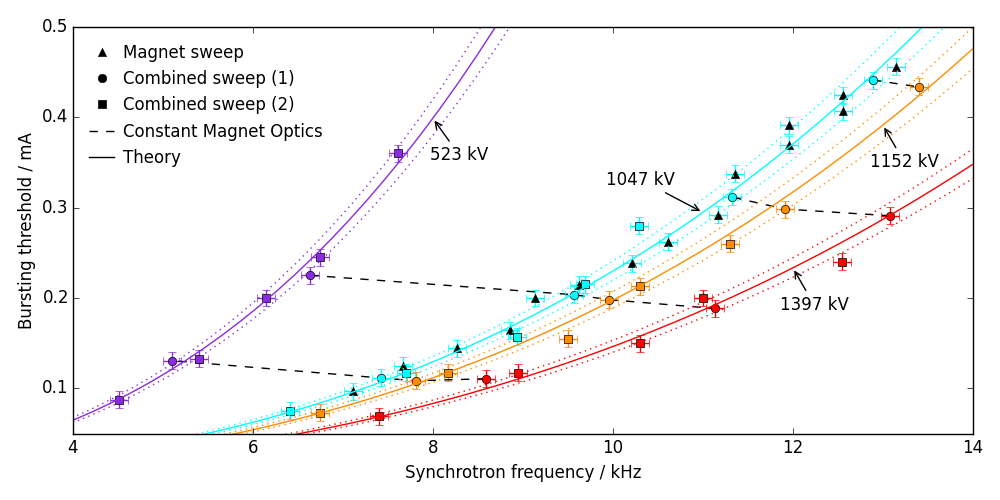
Displaying the bursting threshold in dependence of the measured synchrotron frequency for each step of the magnet sweep shows the correlation even more clearly (Fig. 6). The decrease of the threshold with decreasing synchrotron frequency matches the expected behavior. For a fixed acceleration voltage the synchrotron frequency decreases for a lower momentum compaction factor, which leads to a shorter bunch length. For a shorter bunch length the critical charge density above which the micro-bunching instability occurs is reached at a lower current. For a fixed RF-voltage, a lower synchrotron frequency corresponds to a lower bursting threshold (Fig. 6).
The error on the threshold contains the uncertainties of the threshold detection algorithm, the measured bunch current and the error expected by the spread of the threshold due to multi-bunch effects Brosi et al. (2015).
IV.2.4 Bursting threshold, beam optics, and RF-voltage
In a second measurement the RF-voltage was changed stepwise together with the magnet optics, in the following referred to as “combined sweep”. Figure 6 shows the measured bursting thresholds as a function of the measured synchrotron frequency. For an RF-voltage of the thresholds are in good agreement with the thresholds seen in the magnet sweep study (Sec. IV.2.3), where the same voltage was used.
As described above, a bunch length reduction due to a change of the magnet optics that leads to a lower momentum compaction factor, decreases the threshold. Furthermore, for a fixed momentum compaction factor, a shortening of the bunch by an increase in the RF-voltage which is accompanied by an increase of the synchrotron frequency (Eq. 2) also results in a decrease of the threshold. For the second effect the relative changes of the threshold with the synchrotron frequency are smaller than for the first one (Fig. 6).
V Comparison with bunched-beam theory
In the following, the measured bursting thresholds are compared to absolute predictions of the bunched-beam theory. For this comparison the synchrotron frequency as well as the accelerating voltage were determined for each setting during the measurements. The compact Compton backscattering setup at ANKA Chang et al. (2015) was used to determine the momentum compaction factor for several different magnet optics Chang (2016). This allowed the extraction of a voltage calibration factor, which relates the acceleration voltage seen by the electrons to the set values of the cavities. Knowledge of these parameters is then used to calculate the natural bunch length for each sweep step, and from that the theoretically predicted bursting threshold according to Eq. 3.
Figure 6 shows the measured bursting thresholds of three different sets of measurements, the magnet sweep and two combined sweeps (taken 11 months apart) as a function of the synchrotron frequency. The theoretical prediction according to Eq. 3 for the four different acceleration voltages is shown, and the one standard deviation uncertainty on the theoretical values, calculated from the errors on the measured input parameters used in Eqs. 2 and 3, is indicated. Within the uncertainties, the measured thresholds agree extremely well with the theoretical values, derived from the model as detailed in Sec. II.
VI Conclusion
Fast snapshot measurements, enabled by the unique combination of fast THz detectors with the high-data-throughput KAPTURE DAQ system, drastically speed up time consuming surveys of the micro-bunching instability for different accelerator settings. The quasi-simultaneous acquisition of THz signals from all bunches allows the determination of the bursting threshold and the calculation of a spectrogram. This spectrogram shows the characteristic bursting frequencies from a single dataset covering one second of beam time, compared to the previously used methods requiring several hours. This speed-up by about 4 orders of magnitude permits systematic studies of the bursting threshold for a large set of machine parameters within the same fill. The reproducibility of this method is confirmed by the consistency of the results from two similar measurements performed 11 months apart. With measurements of only three different fills, it was possible to gather sufficient data to demonstrate that the absolute predictions of the bunched-beam theory for the bursting threshold are in excellent agreement with the measurements.
Acknowledgements.
The authors would like to thank the infrared group at ANKA and in particular M. Süpfle and Y.-L. Mathis for their support during the beam times at the IR1 and IR2 beam lines as well as Cheng Chang for the Compton backscattering measurements (CBS) and Heinz-Wilhelm Hübers and Heiko Richter (DLR, Berlin) for providing the necessary CO2 laser for the CBS measurements. Further, the authors would like to thank the ANKA THz group for inspiring discussions. This work has been supported by the German Federal Ministry of Education and Research (Grant No. 05K13VKA), and the Helmholtz Association (Contract No. VH-NG-320). Miriam Brosi acknowledges the financial support of the Helmholtz International Research School for Teratronics (HIRST).*
References
- Müller (2010) A.-S. Müller, Reviews of Accelerator Science and Technology 03, 165 (2010).
- Abo-Bakr et al. (2003) M. Abo-Bakr, J. Feikes, K. Holldack, P. Kuske, and G. Wustefeld, in Particle Accelerator Conference, 2003. PAC 2003. Proceedings of the, Vol. 5 (IEEE, 2003) pp. 3023–3025.
- Shields et al. (2012) W. Shields, R. Bartolini, G. Boorman, P. Karataev, A. Lyapin, J. Puntree, and G. Rehm, Journal of Physics: Conference Series 357, 012037 (2012).
- Wüstefeld et al. (2010) G. Wüstefeld, J. Feikes, M. Hartrott, M. Ries, A. Hoehl, R. Klein, R. Müller, A. Serdyukov, and G. Ulm, in Proceedings of the 1st International Particle Accelerator Conference (2010) p. 2508.
- Carr et al. (1999) G. Carr, S. Kramer, J. Murphy, J. LaVeign, R. Lobo, D. Reitze, and D. Tanner, in Particle Accelerator Conference, 1999. Proceedings of the 1999, Vol. 1 (IEEE, 1999) pp. 134–136.
- Evain et al. (2012) C. Evain, J. Barros, A. Loulergue, M. A. Tordeux, R. Nagaoka, M. Labat, L. Cassinari, G. Creff, L. Manceron, J. B. Brubach, P. Roy, and M. E. Couprie, EPL (Europhysics Letters) 98, 40006 (2012).
- Stupakov and Heifets (2002) G. Stupakov and S. Heifets, Phys. Rev. ST Accel. Beams 5, 054402 (2002).
- Venturini and Warnock (2002) M. Venturini and R. Warnock, Physical Review Letters 89, 224802 (2002).
- Bane et al. (2010) K. L. F. Bane, Y. Cai, and G. Stupakov, Phys. Rev. ST Accel. Beams 13, 104402 (2010).
- Cai (2011) Y. Cai, in Proceedings of the 2nd International Particle Accelerator Conference (2011) p. 3774.
- Ries et al. (2012) M. Ries, J. Feikes, P. Schmid, G. Wüstefeld, and A. Hoehl, in Proceedings of 2012 International Particle Accelerator Conference (2012) p. 3030.
- Müller et al. (2012) A.-S. Müller, N. Hiller, A. Hofmann, E. Huttel, K. Il’in, V. Judin, B. Kehrer, M. Klein, S. Marsching, C. Meuter, S. Naknaimueang, M. Nasse, A. Plech, P. Probst, A. Scheuring, M. Schuh, M. Schwarz, M. Siegel, N. J. Smale, M. Streichert, F. Caspers, A. Semenov, H.-W. Hübers, and E. Bründermann, in Beam Dynamics Newsletter No. 57, Vol. 57, edited by Y. Cai and W. Chou (International Committee for Future Accelerators, 2012).
- Müller et al. (2005) A.-S. Müller, I. Birkel, B. Gasharova, E. Huttel, R. Kubat, Y.-L. Mathis, D. Moss, W. Mexner, R. Rossmanith, M. Wuensch, P. Wesolowski, F. Pèrez, M. Pont, and C. J. Hirschmugl, in Proceedings of 2005 Particle Accelerator Conference (2005).
- Hertle et al. (2014) E. Hertle, E. Huttel, A.-S. Müller, N. Smale, D. Teytelman, and M. Höner, in Proceedings of 2014 International Particle Accelerator Conference (2014) p. 1739.
- Raasch et al. (2015) J. Raasch, A. Kuzmin, P. Thoma, K. Ilin, M. Arndt, S. Wuensch, M. Siegel, J. Steinmann, A. S. Müller, E. Roussel, C. Evain, C. Szwaj, S. Bielawski, T. Konomi, S. i. Kimura, M. Katoh, M. Hosaka, N. Yamamoto, H. Zen, K. Iida, and B. Holzapfel, IEEE Transactions on Applied Superconductivity 25, 1 (2015).
- Advanced Compound Semiconductor Technologies GmbH() (ACST) Advanced Compound Semiconductor Technologies (ACST) GmbH, “UWB Quasi-optical Detectors up to 2 THz,” Flyer.
- Caselle et al. (2014a) C. Caselle, M. Brosi, S. Chilingaryan, T. Dritschler, E. Hertle, V. Judin, A. Kopmann, A.-S. Müller, J. Raasch, M. Schleicher, M. Siegel, N. Smale, J. Steinmann, M. Vogelgesang, M. Weber, and S. Wuensch, in Proceedings of 2014 International Particle Accelerator Conference (2014) p. 3497.
- Caselle et al. (2014b) M. Caselle, M. Balzer, S. Chilingaryan, M. Hofherr, V. Judin, A. Kopmann, N. J. Smale, P. Thoma, S. Wuensch, A.-S. Müller, M. Siegel, and M. Weber, Journal of Instrumentation 9, C01024 (2014b).
- Brosi et al. (2015) M. Brosi, M. Caselle, E. Hertle, N. Hiller, A. Kopmann, A.-S. Müller, P. Schönfeldt, M. Schwarz, J. L. Steinmann, and M. Weber, in Proceedings of 2015 International Particle Accelerator Conference (2015) p. 882.
- Kehrer et al. (2015) B. Kehrer, A. Borysenko, E. Hertle, N. Hiller, M. Holz, A. Müller, P. Schönfeldt, and P. Schütze, in Proceedings of 2015 International Particle Accelerator Conference (2015) p. 866.
- Schwarz et al. (2013) M. Schwarz, V. Judin, A.-S. Müller, and M. Klein, in Proceedings of 2013 International Particle Accelerator Conference (2013) p. 2516.
- Judin et al. (2014) V. Judin, M. Brosi, C. Caselle, E. Hertle, N. Hiller, A. Kopmann, A.-S. Müller, M. Schuh, N. Smale, J. Steinmann, and M. Weber, in Proceedings of 2014 International Particle Accelerator Conference (2014) p. 225.
- Chang et al. (2015) C. Chang, E. Bründermann, E. Hertle, N. Hiller, E. Huttel, A.-S. Müller, M. J. Nasse, M. Schuh, J. L. Steinmann, H.-W. Hübers, and H. Richter, in Proceedings of 2015 International Particle Accelerator Conference (2015) p. 876.
- Chang (2016) C. Chang, Precise determination of the electron beam energy with Compton backscattered laser photons at ANKA, Ph.D. thesis, KIT, Karlsruhe, Germany (2016).