∎
Eötvös Loránd University
H-1117 Budapest, Pázmány Péter sétány 1/A 33institutetext: I. J. Farkas 44institutetext: MTA-ELTE Statistical and Biological Physics Research Group
Hungarian Academy of Sciences
H-1117 Budapest, Pázmány Péter sétány 1/A 55institutetext: P. Pollner 66institutetext: MTA-ELTE Statistical and Biological Physics Research Group
Hungarian Academy of Sciences
H-1117 Budapest, Pázmány Péter sétány 1/A
Tel.: +36-1-372-2795
Fax: +36-1-372-2757
66email: pollner@angel.elte.hu
Quantifying the changing role of past publications
Abstract
Our current societies increasingly rely on electronic repositories of collective knowledge. An archetype of these databases is the Web of Science (WoS) that stores scientific publications. In contrast to several other forms of knowledge – e.g., Wikipedia articles – a scientific paper does not change after its “birth”. Nonetheless, from the moment a paper is published it exists within the evolving web of other papers, thus, its actual meaning to the reader changes. To track how scientific ideas (represented by groups of scientific papers) appear and evolve, we apply a novel combination of algorithms explicitly allowing for papers to change their groups. We (i) identify the overlapping clusters of the undirected yearly co-citation networks of the WoS (1975-2008) and (ii) match these yearly clusters (groups) to form group timelines. After visualizing the longest lived groups of the entire data set we assign topic labels to the groups. We find that in the entire Web of Science multidisciplinarity is clearly over-represented among cutting edge ideas. In addition, we provide detailed examples for papers that (i) change their topic labels and (ii) move between groups.
JEL B000 C810 D700 O340
Keywords:
Article co-citation networkGroup dynamicsTag extraction Multidisciplinaritypacs:
01.65.+g 02.10.Ox 05.45.TpMSC:
82C41 91C20 90B151 Introduction
Many current processes generate knowledge in science, technology, medicine and other fields. Some of these processes are resource-intensive, for example, biochemistry needs reagents and experimental subatomic physics needs particle accelerators. Within each field, and among the ever-increasing number of fields, the available financial resources need to be distributed properly. The first step towards a reasonable distribution of financial resources among the fields of research is the identification of these fields. The most common solution to this task is to apply the keywords of publications provided by their authors or assigned by databases. However, the actual meaning of any fixed keyword appearing on publications changes over time. For example, just over the past decade DNA sequencing became a core aspect of cancer research and cryptography become a core aspect of mobile communications research. This implies that the scientific value and societal impact of research may not be fully accessible by restricting scientometric analyses to fields identified through fixed keywords only.
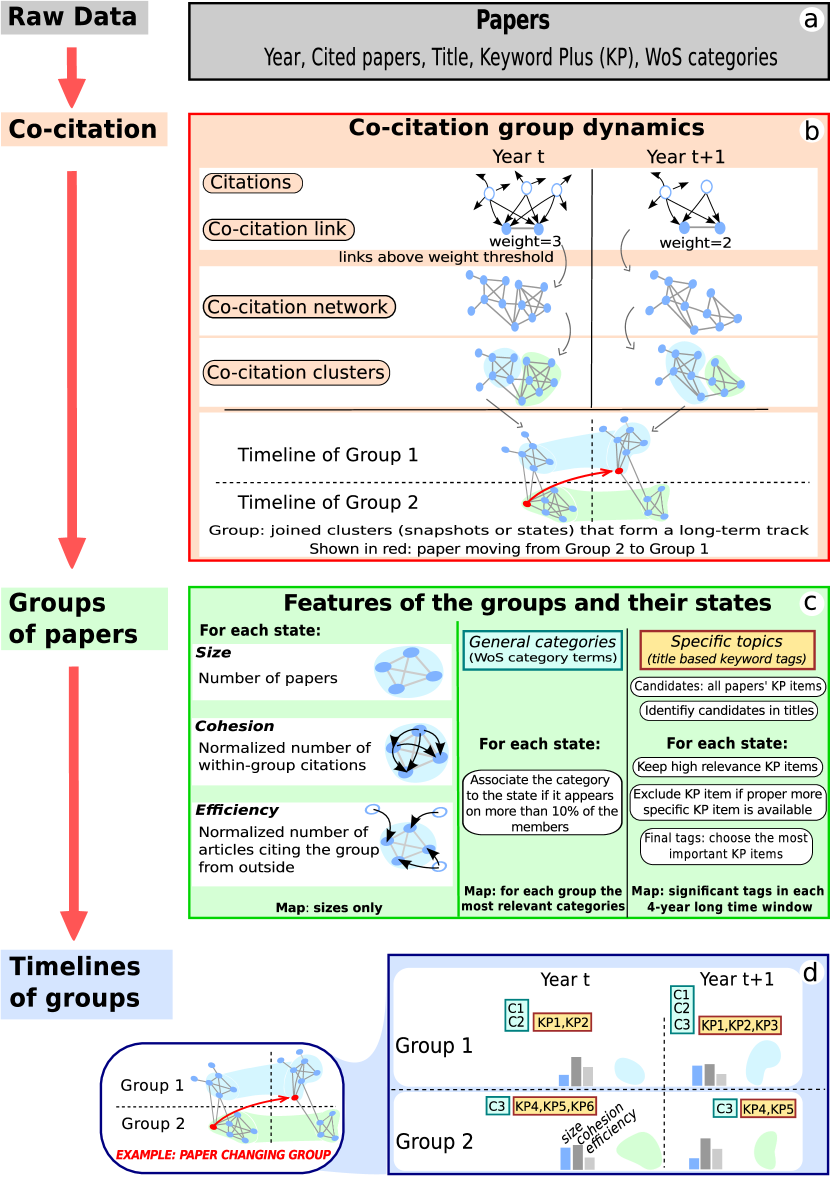
In the present paper we propose to follow the fields of science over time by following which groups of papers are co-cited. Most importantly, for each publication year (Y) we identify groups in the network of papers co-cited in year Y. In this undirected network the weight () of a link between two papers (nodes) indicates that these two papers were co-cited times by papers published in the year Y. As an example, for each publication year between 1975 and 2008, we compile the co-citation network of scientific publications based on the Web of Science. We find that for several fixed sets of previously published papers the groups of co-cited papers within these sets change significantly over time. In other words, the modules of the co-citation network show how the scientific community continuously re-evaluates past knowledge and views it from a continuously changing perspective. As opposed to defining the fields of science based on keywords only, this approach can lead to a more accurate identification of fields and a more precise quantification of impact within each field. We provide several examples in the paper.
2 Taking snapshots of the evolution of science and assembling from these snapshots the evolution of topics (fields)
To create a static map of science (a “snapshot” of its evolution) we
-
(i)
retrieved and pre-processed publication data,
-
(ii)
defined the similarities of publications through co-citation,
-
(iii)
clustered publications using the co-citation networks to reduce available information, and
-
(iv)
visualized the obtained map of scientific areas for human analysis.
2.1 Content analysis, bibliographic coupling and co-citation networks
This section introduces major groups of numerical techniques that have been applied to literature analysis. In the current paper we will be comparing a novel combination of methods to the techniques outlined in this section.
The two major alternatives to author- and keyword-based grouping of scientific content are to define similarities by (i) content analysis (beyond keywords, e.g., title, abstract and main text) and via (ii) citation networks. A frequently applied content analysis technique is co-word analysis, which allows for discovering the main concepts of any previously selected field and maps interactions between the pre-selected scientific fields. In co-word analysis publications (documents) are labelled with the “stemmed” versions of their most characteristic words, and then labels are connected if they co-occur in at least one document. Last, in the obtained network of labels concepts are identified as internally densely linked groups of nodes and the interactions of a field appear as connections and overlaps among these groups.
While content analysis uses characteristic words of a document, citation analysis uses the references listed in an article’s bibliography. Usually, a citation implies not only that the topics of the citing paper and cited paper are related, but also that the citing paper makes use of the results of the cited paper. The first usage of citation analysis dates back to the 1960s. In 1965, de Solla Price analysed data about the (direct) citations between scientific papers and identified active research fronts of recent papers in selected fields (de Solla Price, 1965). Also in the 1960s Kessler introduced a similarity measure called bibliographic coupling (Kessler, 1963). Two documents are bibliographically coupled (linked) if there is at least one other document that they both cite, and the strength of this connection (the weight of the link) is the number of documents that they both cite. Note that according to bibliographic coupling, any two papers determine entirely on their own (through their reference lists) if they are linked and how strongly they are, and this result remains unchanged over time. Co-citation analysis takes a different approach: the scientific papers published in a given time interval decide if and how strongly two earlier papers are linked. In other words, a bibliographic coupling connection does not change, whereas a co-citation connection can change. For example, as scientific activity declines in a given field, its papers are less frequently cited and also less frequently co-cited. Thus, a disappearing field of scientific activity gradually disappears also from the co-citation network, but it remains unchanged in the bibliographic coupling network (with unchanged links and link weights).
Co-citation analysis was suggested in 1973 by Henry Small (Small, 1973) and Irina Marshakova (Marshakova, 1973). Small pointed out that co-citation patterns can quantify the relationships between the key ideas of a field with high precision. Based on this, he suggested applying co-citation analysis to identify scientific fields that emerge quickly, sometimes within a few years. A technique related to co-citation analysis is co-citation proximity analysis where citations appearing in the text closer to each other contribute more to the co-citation weight of the two cited articles (Gipp and Beel, 2009). The co-citation network of authors (or journals) is defined similarly to the co-citation network of publications. For example, two authors are connected in the co-citation network of a publication time window, if at least one paper published in that time window cites both of them. In 1981 White and Griffith studied the co-citations of key authors in Information Science (White and Griffith, 1981). They found, for example, that the extracted modules of authors (based on co-citation profile similarities) were often in accordance with the scientific “schools” of this field.
Finally, please note the use of two terms in the literature. Clusters (communities) of publications and authors co-cited in the past are often referred to as the “intellectual base”, and recent papers joining these clusters are called “research fronts”. Here we focus on clusters of past papers, i.e., the intellectual bases.
2.2 Maps of science
In many fields of science a common way of understanding measured data is to map the data to a network. In scientometrics (a field of science) the bibliographic coupling network and the co-citation network list weighted pairwise connections among publications. Visualizations of this network are often called maps of science(Chen, 2004, 2006; NWB Team, 2006; Sci2 Team, 2009; Van Eck and Waltman, 2010). Among the first few examples for mapping science was a two-piece analysis compiling weighted co-citation networks of scientific papers (Small and Griffith, 1974; Griffith et al, 1974). The number of papers co-citing papers A and B became the weight of the link between the two nodes representing papers A and B. After discarding links weaker than a selected threshold value the authors identified major areas of science as connected components of the remaining network. Then, they analyzed the largest component in more detail by Multidimensional Scaling (MDS) and hierarchical clustering (both numerical techniques use pairwise similarities to visually classify items into subgroups). They applied also higher link weight thresholds (with this change one can locate the “cores” of scientific areas). Later, (Small et al, 1985) identified co-citation clusters (areas of science) by combining data normalization and cluster size dependent clustering with fractional citation counting and the iterative clustering of clusters.
In addition to scientific publications, scientific advances often form the basis of patents as well. Patents focus on applicability, and they reference earlier patents with related content. The co-citation approach has been successfully applied to identify thematic groups among patents (Lai and Wu, 2005) and to predict how technology evolves in the United States of America (Érdi et al, 2012).
2.3 Assembling the evolution of scientific fields from snapshots
This section discusses the major methods known in the literature for constructing evolving groups of publications. The results in the cited papers should be compared to Figure 4.
By the early 1990s, co-citation analysis has become a major quantitative technique for mapping the structure and dynamics of scientific research (Braam et al, 1991a, b). A turning point for these techniques was the introduction of progressive knowledge domain visualization (Chen, 2004). This method (i) derives a sequence of co-citation networks from a series of equal-length time interval slices, (ii) merges these slices and (iii) classifies nodes in this merged network based on their degrees (neighbor numbers) and node betweenness centralities. Following this approach (Chen et al, 2010) introduced a cluster summarization technique to identify clusters of the co-citation network that correspond to scientific communities. In addition to identifying clusters, (Klavans and Boyack, 2011) compared the local and global map of Information Science and set up a model for how science evolves based on data from the 2000-2008 time interval.
3 Interdisciplinarity and multidisciplinarity
Over the past decades many scientific, social and medical problems have become accessible to scientists trained in fields that routinely use detailed quantitative tools. For example, physicists designed physiological experiments showing that noise produced by a computer can measurably improve human tactile sensation (Collins et al, 1997). Another example is that networks and quantitative sociology have helped to analyze pairwise friendship connections and map school-wide segregation from them (González et al, 2007). For a detailed perspective on the role of research involving multiple fields, see, for example (Sinatra et al, 2015).
Generally, interdisciplinarity means that a new discipline arises between previously existing ones, while multidisciplinarity means that multiple separate disciplines provide their viewpoints on the same problem. As for a quantitative definition of interdisciplinarity, (Leydesdorff, 2007) found in the network of journals (defined based on citation patterns) that after normalization locally the betweenness centrality of a journal in this network is a good measure of the level of its interdisciplinarity. Moreover, (Steele and Stier, 2000) analyzed the forestry literature and found that articles drawing information from a diverse set of journals are cited with greater frequency than articles with a more focused bibliography. As for the multidisciplinarity of publications, (Levitt and Thelwall, 2008) measured for several topics the frequency of citations to papers published in mono- and multidisciplinary journals. If a journal had a single subject category, then they called it mono-disciplinary, and if a journal had multiple subject categories, they called it multidisciplinary. They concluded that multidisciplinary research does not necessarily receive more citations.
Here we use the article co-citation network as a map, and investigate the dense cores of this network with the time evolving clique percolation method, tCPM (Palla et al, 2007). This algorithm extracts the most dense parts (clusters) of a network and identifies matching clusters from subsequent (time) steps. Note that some nodes of the matched clusters can be different. We find that the members of the evolving dense co-cited article cores frequently come from multidisciplinary journals. In other words, a multidsciplinary paper is more likely to be co-cited for a long time with a stable group of other papers, and thereby it is more likely to be part of an “intellectual base”.
Note also that in the Web of Science (WoS) the category “multidisciplinary sciences” on a paper does not directly indicate that the given paper is multidisciplinary. In the WoS this category on a paper indicates merely that the journal where the paper was published is a multidisciplinary journal. For example, Nature is a multidisciplinary journal, therefore, in the WoS all publications that appeared in Nature have the category “multidisciplinary sciences”. We refer to a paper as multidisciplinary if it does have the WoS category “multidisciplinary sciences”, regardless of whether its focus is broad or narrow. For more detailed analyses of the shortcomings of journal-level categories and for solutions to the article-level subject classification problem (based on the analysis of cited literature) we recommend (Glänzel et al, 1999a), (Glänzel et al, 1999b), and (Glänzel and Schubert, 2003). In summary, (i) the categories of papers appearing in highly specialised journals usually describe these papers’ subjects more accurately, (ii) reclassification can be necessary for papers published in journals whose publications are covered by the database selectively, or for papers published in journals that are more general or multidisciplinary. However, there are also several studies that make use of the subject categories even at the article level, for example, Moed et al (1995); Porter and Rafols (2009); Albarrán et al (2011).
4 Data and methods
We received the following items and a few others from Thomson Reuters’ Web of Science (WoS) for each downloaded paper: unique ID, publication time stamp, keywords (several types), and the unique IDs of cited publications. First, we compiled the yearly co-citation networks of WoS publications (papers). For example, the nodes of the 1993 co-citation network are those papers that were co-cited in 1993 with at least one other paper. With the same example we note also that the nodes of the 1993 co-citation network are papers that were mostly published before 1993.
For each co-citation network we excluded weak co-citation links. Please see Section 4.2 for details about this step. Next, we identified in each yearly co-citation network the internally densely connected groups of nodes, i.e., clusters of papers. The method we applied for identifying these clusters explicitly allows that the identified clusters overlap. Last, we joined the yearly co-citation networks into a single temporal sequence of co-citation networks containing the life histories of many clusters.
4.1 Identification of topics and network properties
We estimated the specificity of the identified clusters through the WoS categories of cluster members (papers). Next, we extracted the characteristic topics of each identified cluster based on (i) the titles of their papers and (ii) a keyword candidate list compiled from the available papers’ WoS Keyword Plus tags. The second method (which is based on WoS Keyword Plus tags) provides a more specific thematic characterization. After these, we calculated several network properties of the directed articlearticle citation network. We computed group sizes, group cohesion and the group’s effect on the rest of the scientific community in time. Finally, we compiled a map visualizing the dynamics of the groups. This includes the transitions of papers between groups, changes in the topic composition of groups and group sizes. Our methods are illustrated in Figure 1.
Our co-citation analysis covers the citing years between 1975 and 2008. As for the directed network of citations, million articles cite at least one article, and million articles are cited at least once. As for co-citations, there are million articles that cite at least two different articles. In other words, each of these million articles co-cites at least one pair of articles and contributes to at least one yearly co-citation network. As for being co-cited, million articles are co-cited with at least one other article. These million articles are the nodes of the yearly (undirected) co-citation networks. As a side note, the data set contains nodes with a self-link, which is a citation link of a publication to itself. Another special case is when the reference list of article A contains article B more than once. Between 1975 and 2008 the data set lists citing articles with this property. We calculated co-citation weights by including self-citations and repeated out-links. After obtaining all co-citation weights, we excluded the co-citation of any article with itself.
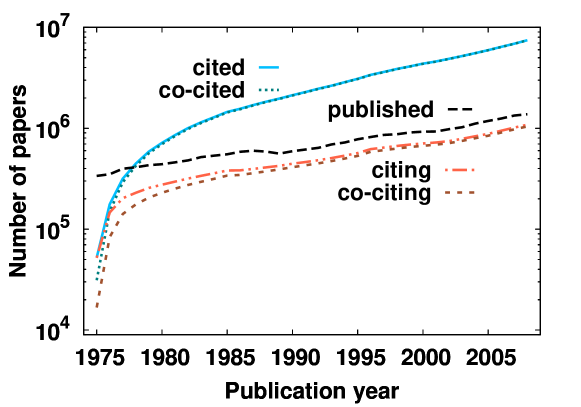
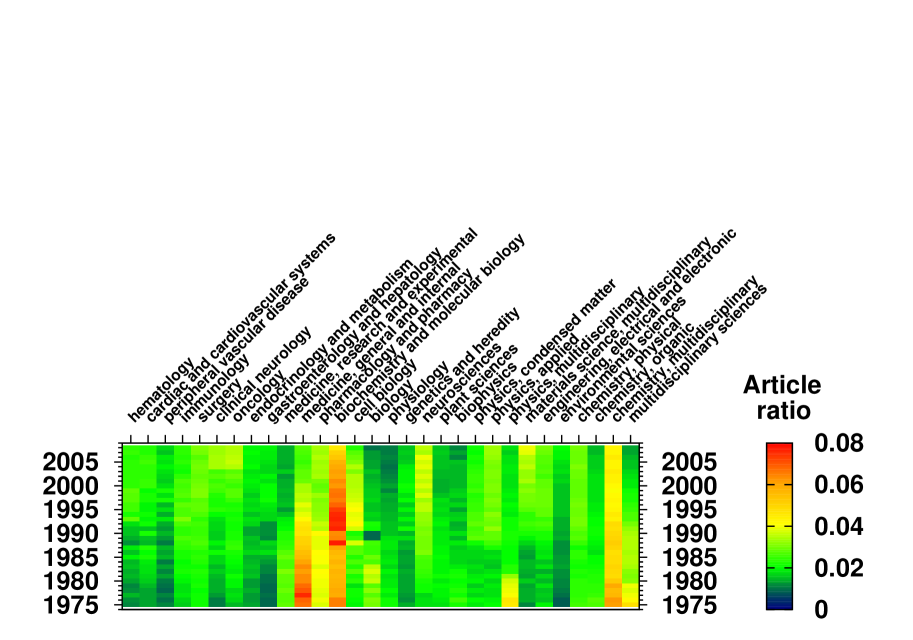
Regarding the number of publications per year, (Szántó-Várnagy et al, 2014) found that between 1970 and 2010 in the Web of Science and several other databases the number of papers doubled approximately every 20 years. Figure 2 shows that the number of published papers, the number of cited, co-cited, citing and co-citing papers also grow approximately exponentially. As for categories, papers published between 1975 and 2008 are categorized by the Web of Science into different journal-based categories. Figure 3 shows how the number of publications using the most frequently appearing categories changes over time. For example, the categories ”biochemistry and molecular biology”, ”medicine, general and internal”, ”chemistry, multidisciplinary” are the most frequently used ones in several years.
4.2 Clusters of the yearly co-citation networks as states (“snapshots”) of scientific fields
To identify the fields of science as clusters of the co-citation network, we first compiled for each year the network of papers co-cited in that year. In the co-citation network of year two papers, A and B, are connected by a weighted undirected co-citation link, if at least one paper published in year has both A and B in the list of its references. For example, in the 1990 co-citation network the weight of the link connecting the papers A and B is the number of those 1990 publications that cite both A and B. To exclude weak co-citation connections, we applied edge weight thresholds: links weaker than the threshold were discarded before the analysis, while weights above the threshold were set to 1. For each yearly co-citation network we defined the threshold such that the group detection method, CPM, could identify the broadest possible distribution of group sizes. According to (Palla et al, 2005), this choice of the link weight threshold can provide the most informative clusters (also called: groups or modules). On a more technical note, setting the link weight threshold parameter to its optimal value allows clusters of all sizes to appear, because the link density of the network is close to the value at which all nodes are densely linked to same large cluster. At a higher than optimal link weight threshold most nodes have no connections and remain isolated, while at a lower than optimal link weight threshold most nodes are members of a single large cluster. Neither of these two extremes is as informative as the optimal link weight threshold value that provides a broad distribution of cluster sizes (clusters of all sizes are present).
As explained above, in each of the yearly co-citation networks we identified the dense overlapping groups of co-cited papers with the Clique Percolation Method (CPM), which uses undirected links without weights as input. The CPM identifies overlapping, internally densely linked clusters of nodes in networks (Palla et al, 2005), while CFinder is a software that runs the CPM. As a technical comment, we mention that the CPM identifies maximal chain(s) of overlapping complete subgraphs (-cliques), which are called -clique percolation clusters. Here we set the clique size parameter to . According to (Palla et al, 2005), the optimal value of the clique size parameter, , can be selected with a method similar to the selection of the optimal link weight threshold (see above). We note also that several of the co-citation networks contain dense parts (subgraphs) in which exact clique finding for the Clique Percolation Method is not possible within reasonable computational time. In these cases we applied the built-in approximate clique finding option of CFinder.
4.3 Joining yearly co-citation clusters (snapshots of scientific fields) into long-term tracks of evolving fields
The previous section explained how we identified overlapping clusters in the yearly co-citation networks. In this section the identified clusters are treated as snapshots of the evolving fields of science, and these snapshots are joined into histories (timelines) of scientific fields with the network module joining method of (Palla et al, 2007). First, for any two subsequent years we constructed a network that is the union of the co-citation networks of these two years. Next, we identified with CFinder the modules of this merged network. Note that the merged network fully contains both of the two initial networks, therefore, each module of the two yearly networks is fully contained by a module of the merged network. Consequently, one can identify how modules evolve between two (adjacent) yearly networks by analyzing – for each module of the merged network – which modules of the two yearly networks it contains. To achieve this we used the notion of relative overlap (also called: Jaccard correlation) between any two modules. If module A from the first yearly network and module B from the second yearly network share nodes (intersection of A and B), and they have a total of nodes (union of A and B), then their relative overlap is .
In the merged network we calculated the relative node overlap of all possible A-B module pairs, where module A is from the earlier yearly network and module B is from the later yearly network. Finally, for any given A-B pair of modules we used the following method to decide whether module B is a continuation in time (i.e., a later state) of module A. In each module of the merged network we took the module pair with the highest relative overlap and matched these two. Next, from the remaining (so far unassigned) modules of the initial two networks we took the module pair with the highest relative overlap and matched these two. We continued with this process as long as both initial networks had at least one unassigned module. We joined only module pairs with at least one overlapping node, in other words, the relative overlap had to be positive.
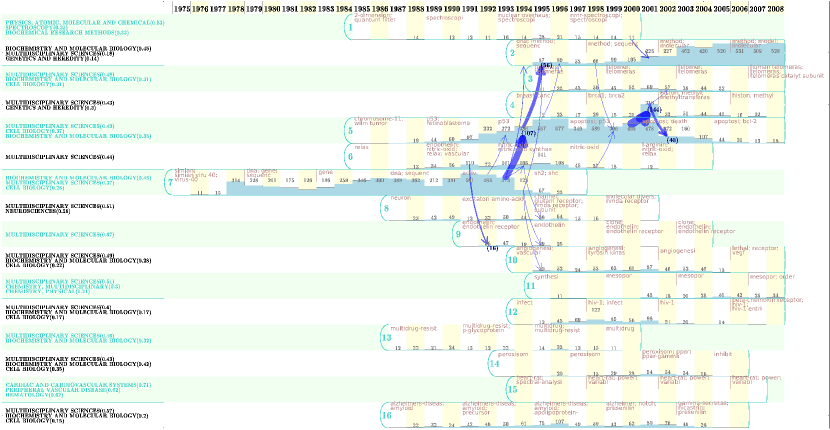
The module pairing process above may be also viewed as the identification of “paths” showing how scientific fields evolve. Note also that the technique described above includes the possibility that a module appears (it is “born”), disappears (it “dies”), splits or merges with another module. These and further details are shown in Figures 1e and 1f of (Palla et al, 2007). The map in Figure 4 shows the histories of the groups identified with the above method and the transitions among these groups. For example, an arrow pointing from group at time to group at time means that some papers moved from to in this time step.
4.4 Structure of the groups of co-cited publications
This section explains how we investigated whether two papers that are cited together cite each other. We listed all citations pointing from a paper (citing) to another paper (cited) that is in the same yearly co-citation cluster. Note that self-citations were excluded here. Next, we computed the cohesion, , of each group for each year, . We denote by the number of papers in group at time and by a direct citation (directed link) pointing from paper (node) to paper (node) :
| (1) |
The cohesion of a subgraph in a directed network can vary between 0 and 1. Note that , if and only if the investigated subgraph is empty. In the case of the network of citations means that there is no citation that connects two nodes of the analyzed set of publications. On the other hand, means that each node of the subgraph has a directed link pointing to every other node of the subgraph. For subgraphs in the network of citations this translates to each of the papers citing all other papers. In other words, if , then any two papers have a citation link in both directions between them. Note that mutual citation between two articles is rare, because a citing article usually appears significantly later than the article it cites. However, the data set does contain pairs of mutually citing papers. The total number of citations (directed links) between the articles in our dataset is over million. Note also that there are around thousand (A,B) pairs of papers for which A cites B and B cites A as well. Despite their low overall ratio (), bidirectional links are often enriched in specific publication types (e.g., articles in the same conference proceedings booklet often cite each other). This is why we take into account the possibility of mutual links in the normalization factor of .
4.5 The influence of the identified groups of co-cited papers on science
We computed the efficiency, , of each group, , for each year, , to measure how many papers from outside cite the papers of (the group of articles co-cited in year ), see Eq. (2). In the definition below, is the publication year of paper and is a constant. We selected this particular value of to set the relative contribution of a paper published 10 years before the co-citation year to . In Eq. (2) the summation runs for all papers, , that fulfil all of the following conditions: they (a) are not in , (b) cite at least one paper of , and (c) were published in year , for which :
| (2) |
Recall that is a group of papers with dense pairwise co-citations received in year , thus, the papers in were all published not later than the year . Note also that the contribution of citations to is exponentially decreasing with the time difference , thus, the strongest contribution to is provided by citing papers published in year or short before year . Consequently, the efficiency, , quantifies the effect of the group of publications, , on science in year and short before year .
4.6 Thematic analysis of groups
The previous sections introduced yearly co-citation networks and the groups of co-cited publications. The current section explains how we defined topics for each group of publications. In Sections 4.6.1 and 4.6.2 we explain two other methods for listing the categories of the groups of papers.
4.6.1 Journal-based paper categories
First, we assigned to each paper the Web of Science categories of its journal. (Regarding papers with the category “multidisciplinary sciences”, please see also the second part of Section 3 above.) Next, for each group we determined its top three (most relevant) categories. We considered the entire path of the group over the analyzed year range and we ranked those categories that are present on more than of the group’s articles in more than of all years of the group. To rank the categories of a group we performed the following steps. First, for each year () we computed the total number of papers in the group in that year () and for each category () the number of the group’s papers using that category in year (). Second, we averaged the ratio over all years in which the group exists. Third, we assigned a lower rank (higher significance) to a category if its averaged ratio was higher.
Interestingly, the presence of the category “multidisciplinary sciences” among the top categories indicates the abundance of articles published in “multidisciplinary” journals, and cannot be reliably applied to quantify article-level multidisciplinarity. Moreover, since categories are assigned to journals (and not individual articles) in the Web of Science, tracking subjects with a resolution significantly higher than the journal level would require further information at the level of articles.
4.6.2 Paper categories based on Keyword Plus and titles
This section explains a combination of previously published methods for identifying the most relevant topics of paper groups. We (i) extract possible topics from paper titles using the Tf-Idf technique (Term frequency - Inverse document frequency) (Salton and Buckley, 1988) and then (ii) select the most relevant of these possible topics with the rCUR dimension reduction method (Bodor et al, 2012).
Among the Web of Science (WoS) data fields available to us, Keyword Plus111KeyWords Plus® are “index terms created by Thomson Reuters from significant, frequently occurring words in the titles of an article’s cited references.” tags are the most appropriate for describing topics with a resolution at the article level. Note, however, that of all million papers in the subset of the Web of Science available to us, million papers () have no KeyWord Plus. Therefore, we collected all available Keyword Plus tags (KWP), treated these KWP as keyword candidates and searched for these candidates in the titles of all group member papers. Note also that keywords can be expressions, thus, both keyword candidates and title words had to be stemmed (normalized). We normalized each word with the Porter stemmer (Porter, 1980) (implemented by the NLTK module in Python).
After listing the set of keywords of a selected yearly co-citation group, we kept only the most relevant of these keywords. The relevance score we applied is the Tf-Idf score (Salton and Buckley, 1988). The Tf-Idf score is high if the given keyword occurs in many paper titles in the given yearly co-citation group, and it is low if the keyword occurs in many of the groups of the selected year:
| (3) |
where is the number of articles in that have the keyword in their titles, is the number of groups in year , and is the number of those groups in year in which appears. After computing the Tf-Idf score for the keywords of each group we applied two absolute thresholds to keep only the most relevant keywords. First, we excluded keywords present in only one article title in the group (in the particular year). Second, we selected the 10 keywords with the highest Tf-Idf scores. Moreover, to focus on keywords that are specific enough, we excluded a keyword also if it is part of another keyword that has a higher or equal Tf-Idf. For example, one of the article modules in the 1976 co-citation network consists of four articles with the following titles:
-
1.
”Interspersion of repetitive and nonrepetitive dna sequences in drosophila-melanogaster genome”
-
2.
”Dna sequence organization in genomes of 5 marine invertebrates”
-
3.
”Structural genes adjacent to interspersed repetitive dna sequences”
-
4.
”Comparative aspects of dna organization in metazoa”
For this module the following three topic tags have the highest Tf-Idf scores (Tf-Idf scores are in parentheses): dna sequenc (11.39); dna (8.74); sequenc (7.23). From these three we kept only dna sequenc. We excluded dna, because dna sequenc contains it and dna has a lower Tf-Idf score than dna sequenc. Similarly, the topic tag sequenc was excluded as well.
Next, we selected for each group of papers the three most relevant keywords with the rCUR algorithm. For a concise description of the rCUR method let us first select a year and consider a group of papers that are strongly co-cited in that year. For this group of papers the rCUR method provides a matrix, , in which a row corresponds to a keyword of the group and a column corresponds to an article of the group. Moreover, the matrix element is , if and only if the -th keyword is present on the -th paper, otherwise it is . (Only articles that have at least one of the keywords are included.)
The rCUR method approximates the input data matrix with a small number of its rows. This means that a few of the keywords are selected as representative keywords. To achieve this, first, the sufficient number of top singular values (and their vectors) is selected: the sum of selected singular values should exceed of the sum of all singular values. Second, the leverage score (explained below) for a row of the input data matrix is computed. (Recall that a row of the input data matrix corresponds to a keyword of the group of papers.) The leverage score for a selected row of the input data matrix is, up to scaling, equal to the diagonal element in the same row of another matrix that projects all vectors onto the subspace of the selected singular vectors. Last, the rows with the highest leverage scores are selected.
Compared to other data reduction techniques the key advantage of the rCUR method is the following. Instead of selecting a linear combination of keywords as the most relevant one, rCUR selects directly some of the actual keywords. From the rCUR package we applied the top.scores method, and accepted the three rows (keywords) with the highest leverage scores. We note also that if the number of keyword candidates is low or the articles of the selected group have very similar keywords, then the rCUR method is not applicable. In the first case (few keyword candidates) we selected all keyword candidates as keywords, while in the second case (similar keyword occurrence profiles) we selected the top three keywords as ranked by the Tf-Idf scores. Finally, for groups existing over at least 14 years, we compressed the extracted tag information in 4-year time windows and visualized the extracted tags of the groups in these time intervals (see Figure 4). In this compression step we consider a tag (characteristic topic) of a group significant if it appears in more than of the time steps of the range. If, however, we find no tag above , then is accepted.
The consistency of the extracted categories (explained in Section 4.6.1) and the topic tags (Section 4.6.2) is illustrated by the groups G5 and G8 in Figure 4. For group G5 the top three categories are “multidisciplinary sciences”, “cell biology”, and “biochemistry and molecular biology”. Group G5 existed between 1985 and 2008, that is, in 24 consecutive years. During this time articles were group members in at least one year. The following topic tags are associated with the group in at least 3 time steps (years): apoptosi, p53, death, chromosome-11, wilm tumor, retinoblastoma, kinas, gene, cell-cycl, bcl-2. Note that topic tags are stemmed expressions (made up of one or more words), for example, a stemmed expression is “kinas”, which replaces a long list of terms containing “kinase”, “kinases” and others. For Group G8 the top categories are “multidisciplinary sciences” and “neurosciences” (Figure 4). The group existed for 15 years (between 1987 and 2001) and contained articles during this period. Its topic tags occurring in at least 4 years (i.e., 4 time steps) are: nmda receptor, glutam receptor, nmda, neuron, excitatori amino-acid, channel. As illustrated by these two examples, the categories of article groups are indeed informative about a group’s thematic location in science.
5 Results
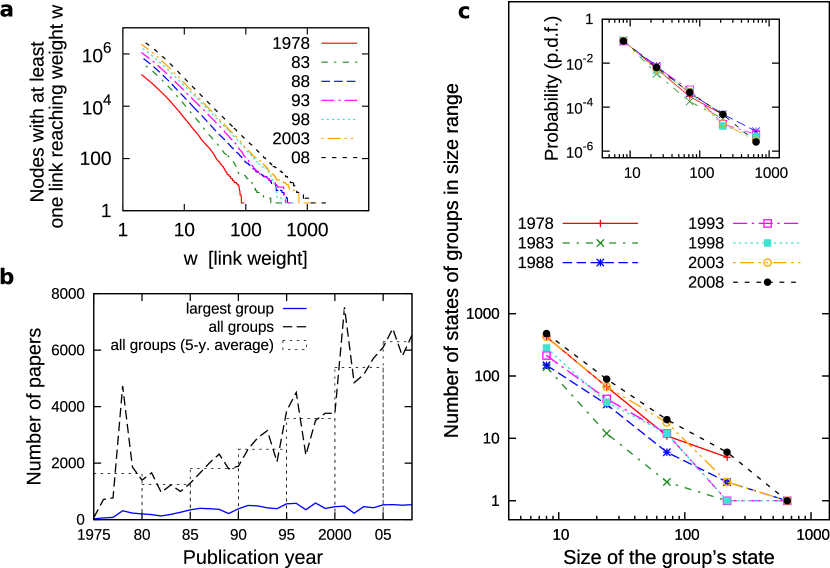
Scientific knowledge is evolving mainly through novel results. The history of this evolution is tracked by scientific publications. Each paper records the addition of a new item to our shared knowledge. Until now scientific publications have been considered to be static, because after they appear they do not change. Here we show that even though the content of a published paper is “frozen”, its role (its meaning) often changes over time. In our results we build our observations mainly on the statistical analysis of the constructed co-citation networks and co-citation article group properties with special attention to changes over time. We observe that over time the yearly co-citation network grows approximately exponentially. We observe also that if we remove co-citation links that are weaker than a selected link weight (co-citation number) threshold, then the number of nodes remaining in the network decreases as a power law function of the applied link weight threshold. This latter result holds for all analyzed years (see Figure 5a), thus, in all publication years the strongest co-citation activity is focused on a small group of highly cited past papers. These form the (previously mentioned) intellectual base of science.
Figure 5b shows the annual number of papers clustered into groups and the size of the largest group obtained from the co-citation networks (with link weight thresholds adjusted as explained in Section 4.2). Interestingly, in contrast to the exponential growth of the number of publications, the number of articles in the dense core (members of at least one co-citation group) grows only slowly. Note also that the sizes of the identified groups differ largely. This is shown in Figure 5c with the corresponding probability density function (p.d.f.) in the inset. The power law shape of the p.d.f. of group sizes indicates that the typical group is small (about a dozen of articles), however, a few groups are very large, of the order of the amount of nodes in the small groups combined.
In summary, Figure 5 quantifies clearly a qualitative concept that has not yet been quantified at this scale with such precision. This concept is that in scientific research most innovations last only for a few years, while a few may survive for over a decade before being integrated into other fields. By comparing this figure to Figure 4 one may note that in Figure 4 small transitions of papers indicate rearrangements among fields of research, while large transitions usually indicate the assimilation of a field into others.
Most importantly, Figure 5 demonstrates the knowledge filtering and compressing role of the global publication system in science: the “production” of science increases exponentially, however, the core knowledge accumulates at a much slower rate.
5.1 Groups of co-cited papers frequently overlap
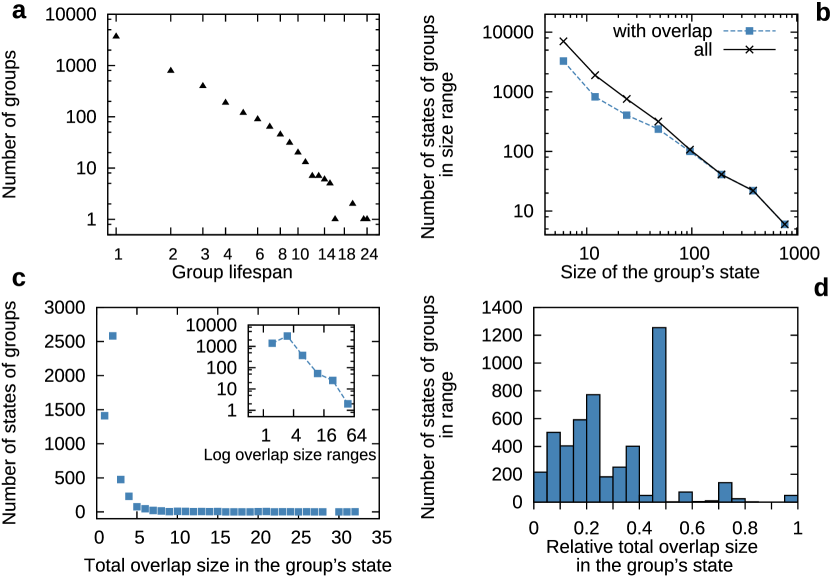
There are altogether groups made up by a total of yearly group states (“snapshots” of timelines). Figure 6a shows the histogram of the groups’ lifespans. The majority of the groups exist only for 1 or 2 years that may be called “rapid transient” groups. We found 43 groups with a lifespan of more than 10 years and a maximum lifespan of 24 years (for one group).
The rapid transient groups show that in scientific research there is a constant push for finding new solutions, i.e., launching new fields. The main reasons for a group to be transient are the following:
-
(A)
The articles of a transient group discuss a current (usually technical) question, or support and validate a result. After resolving the issue, these articles are not co-cited any more.
-
(B)
Groups can merge: small transient groups form a single group. A typical case for this evolution pattern is the emergence of a new topic.
-
(C)
Small transient groups provide a pool to absorb papers from for the more stable groups of “canonical” papers. In larger groups with a longer life span members do change, but within the group there is always a dominant subset that changes only slowly. As an example consider a group defined as the set of employees at a large company. Here usually middle managers and administrators provide the backbone of the company and represent most solidly its character (its company culture and core values).
Two identified groups of publications (articles) overlap, if they share at least one article. Articles in the overlap play a bridging role between the two groups. They connect two separate topics or relate two scientific schools. Note also that an overlap between two groups indicates a loose connection between the entire groups including their further (not shared) members. Groups without overlaps represent very special topics, whereas groups dominated by shared nodes have little specificity. Section 4.2 explained how we applied the Clique Percolation Method (CPM, implemented by CFinder) for identifying modules. The CPM explicitly allows for overlaps among the modules. The following paragraphs explain our analyses of the overlaps among the groups of co-cited publications.
Figure 6b compares (i) the sizes of those yearly co-cited article groups that have overlaps and (ii) the sizes of all yearly states of groups. The figure shows that the groups without overlap are usually smaller. In the next two statistics we focus on the states with at least one group member in an overlap. For a selected group the total overlap size is the number of the group’s members that are at the same time members of at least one other group in the same year. Figure 6c shows the number of yearly co-cited article groups with a given total overlap size. Similarly to the previous definition, for a selected group the relative total overlap size is the total overlap size divided by the number of items in group. Figure 6d shows the histogram of the relative total overlap sizes.
In of the group states that have at least one shared (overlapping) member the total overlap size is at most articles. Moreover, based on the relative total overlap size in most cases () the relative total overlap is at most . States with size larger than articles have the relative total overlap below . In summary, for the large yearly co-cited article groups the relative amount of overlap is low, however, for small groups overlaps can be important.

Recall from Section 4.5 that for the year the group efficiency, , of group quantifies the effect that this group of publications has on science in the year and short before that year. According to Figure 7a, out of the major simple statistical distributions this distribution of group efficiencies resembles a log-normal (or a power-law) distribution, i.e., an upside down parabolic function (or a linear decay) on the log-log scale. Both distributions (log-normal and power-law) indicate that the total effect of a group of publications arises not as a sum of independent effects, but through reinforcing (e.g., multiplicative) effects.
Note that for almost of the yearly group states the group efficiency is . On the other hand, there are three small group states with . They are due to three heavily cited articles (Bradford, 1976; Sanger et al, 1977; Chomczynski and Sacchi, 1987). In fact, in each of these three yearly group states at least two of the three highly cited articles are present. One of the three papers describes a method for protein identification, the second describes a new method of total RNA isolation, and the third presents method for determining nucleotide sequences in DNA.
As for group cohesion, recall from Section 4.4 that is the number of citations within the article co-citation group divided by the maximum possible number of citations among the articles of . According to Figure 7b, for of the yearly group states group cohesion is between and . To put this result in context, recall from Section 4 that citations normally point from a later study to an earlier one. In other words, group cohesion values above can appear only if there are mutual (bidirectional) citations between the group members. Since mutual citations are rare, only around of the yearly states of co-citation groups exceed the group cohesion value. Finally, note in Figure 7c that a higher number of papers in a co-citation group of papers usually implies that the given group has a longer lifespan.
5.2 Lifespans of the modules of co-cited papers and transitions between the modules
Figure 4 summarizes the groups with at least years of lifespan and the articles transitioning between these groups. Recall that in Figure 4 a large group of papers transitioning from one field to another field shows that the first field is likely to be in the process of dissolving and the latter field is absorbing much of it. For our quantitative purposes, we define an article to be transitioning if the article is a member of group at time , and it becomes a member of another group in the next time step. On this map note that groups usually start small, then they grow, and finally, they shrink before disappearing. According to the most relevant WoS categories, indicated in front of the groups, these longest lived groups are mostly related to biology. Also, articles with the journal category ”multidisciplinary sciences” seem to be frequent in the majority of the groups. Note also that (i) topic tags may change if the article set included in the group changes and (ii) the extracted topic set is also influenced by the paper titles of the other groups in the same year via the Tf-Idf scoring. The reason for (ii) is that the keywords present in many groups in a particular year are considered to have less specificity for characterizing the unique aspects of a group’s state.
Next, we provide examples for published papers transitioning between co-citation groups. Two groups with many transitions are No.5 (group G5) and No.7 (group G7). Group G5 accumulates articles mostly related to the terms cell-death, apoptosis, tumours, cancer, cell-cycle, and genes, factors, proteins related to these topics. The publications in Group G7 can be most closely characterized by gene, protein, dna and sequences. The lifespan of this group (G7) can be partitioned into three time ranges. For each of these three time ranges we mention characteristic topics here. The beginning of the first time range is dominated by papers focusing on the investigation of simian-virus-40. Then, this time range can be characterized by the topics: gene, dna, sequence and it is also related to viruses. In the second time range gene is still important and there is orientation towards oncogene, proto-oncogene, tumour, cancer. In the last range, many publications are related to protein, receptor, kinase, activation or activity.
From 1993 to 1994, a set of 107 articles left the timeline (group) G7 and became members of timeline (group) G5. These articles were mostly related to the following topics: receptor, sequence, gene, dna. In 1994 another large group of papers left G5. From 1994 to 1995 the timeline of G5 lost 56 articles to G2, the main topics of these articles were sequence, dna, rna and protein. These transitioning articles are all related to either the gene JUN or the transcription factor AP-1. The gene JUN participates in cell cycle progression control and regulates apoptosis (Wisdom et al, 1999). Observe that timeline G2 started with 5 articles in 1994, of which 4 had been the members of G7 in the previous year (1993). To summarize the early years of group G2, the G7,1993 G2,1994 transition contributes to the birth of group G2, while the transition G5,1994 G2,1995 shifts the group’s topic profile towards molecular biological methods. Observe in Figure 4 that between 1991 and 1992 another 16 articles moved from G6 to G9. This shift includes articles with the topic endothelin, and largely contributes to the topic of group G9, which is related to endothelin.
Finally, we discuss a case when the topic set of past papers changes as these papers move from one group to another. In Figure 4 consider the transition (G7, 1993, [receptor;activ;kinas]) (G5, 1994, [transcript;mutat;p53]). The starting point of this transition is the 1993 snapshot of group G7 with the main topics “receptor”, “activ” and “kinas”. By the next year (1994) many of the papers from this densely co-cited group move over to G5. To analyze this transition at a higher resolution, we now consider now one of the highly cited papers participating in this transition (Altschul et al, 1990). The article by Altschul et. al. introduced BLAST, a new approach to rapid sequence comparison based on local sequence similarity. Since its publication, BLAST has become widely used for DNA and protein sequence database searches. Table 1 shows the groups which this paper participated in. First, it appeared in group G7 in 1992, and remained in the same group in 1993. After its transition to G5 in 1994, the BLAST paper moved to G2 in 1995 and remained in this group until 2008.
| Year | Timeline: tag set |
|---|---|
| 1992 | G7: retino acid;cystic-fibrosi;element |
| 1993 | G7: receptor;activ;kinas |
| 1994 | G5: transcript;mutat;p53 |
| 1995 | G2: sequenc;dna;method & g1: human brain;cdna sequenc;express sequenc tag |
| 1996 | G2: sequenc;align;dna |
| 1997 | G2: rapid;rna-polymeras;method |
| 1998 | G2: sequenc;tree;method |
| 1999 | G2: sequenc;tree;method & g2: search;protein |
| 2000 | G2: sequenc;phylogenet;method & g3: search;autom sequenc;trace |
| 2001 | G2: protein;program;structur |
| 2002 | G2: protein;program;method |
| 2003 | G2: molecular;method;genom |
| 2004 | G2: protein;molecular;network |
| 2005 | G2: model;molecular;method |
| 2006 | G2: model;molecular;method |
| 2007 | G2: model;molecular;method |
| 2008 | G2: model;calcul;method |
5.3 Multidisciplinary papers frequently form strongly co-cited groups
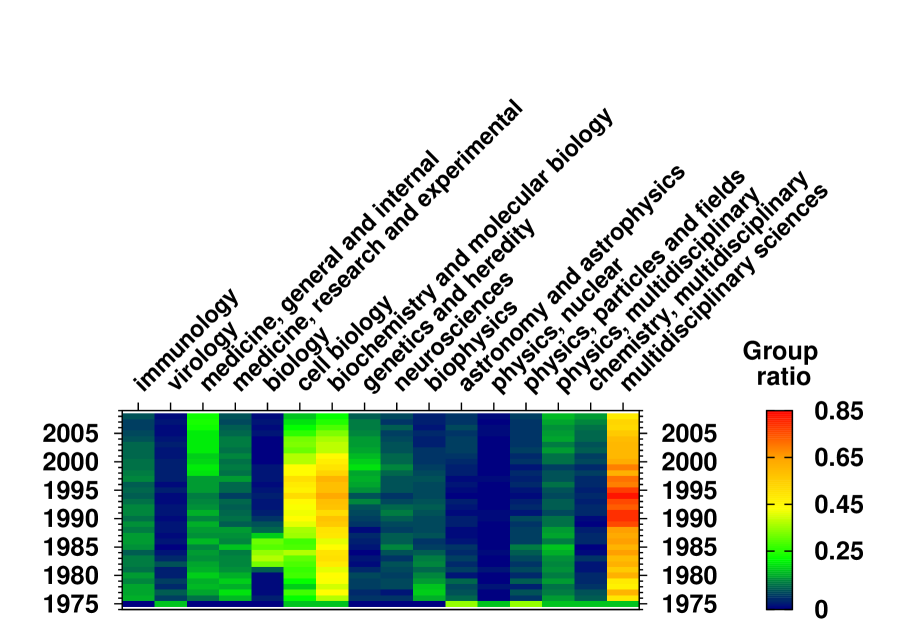
According to Figure 8, in almost every year ”multidisciplinary sciences”, ”biochemistry and molecular biology” and ”cell biology” are over-represented in the groups of co-cited publications. Of these three, ”multidisciplinary sciences” is even more outstanding: between 1989 and 1995 it is associated with more than of the groups in each year. As a contrast, Figure 3 shows that every year the category ”multidisciplinary sciences” appears on not more than approximately of all published articles.
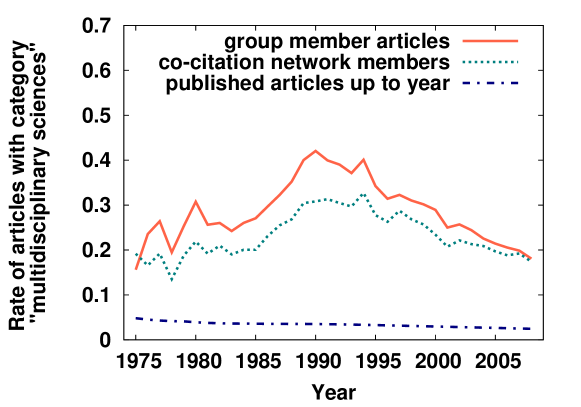
Triggered by this observation we analyzed in more detail the usage of the category “multidisciplinary sciences”. This category contains articles that were published in journals of a very general character. We calculated the ratio of “multidisciplinary sciences” articles for each year in the following article sets: (i) published articles up to the given year, (ii) papers co-cited in the given year (with the optimized link weight threshold, see Section 4.2), and the (iii) papers belonging to the co-citation groups of the given year. Here we excluded articles without category information. From this point on, for the sake of simplicity the fraction of all papers labelled with the category “multidisciplinary sciences” will be called the multidisciplinarity ratio. According to Figure 9, the multidisciplinarity ratio is significantly higher in the co-citation networks than among all published articles. Moreover, further enrichment is observed in the co-citation network groups.
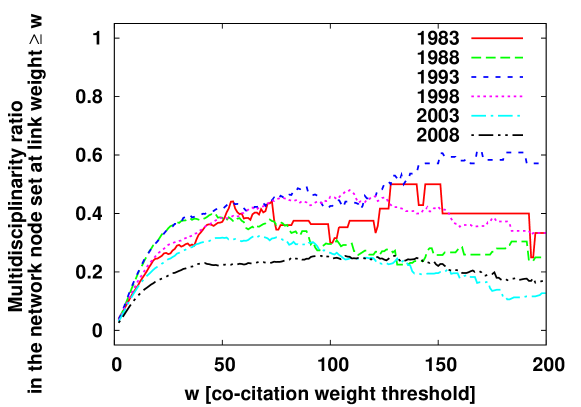
We find that – compared to all published articles – the co-citation networks (at the optimized link weight threshold) and the groups of co-cited articles are enriched for articles that are multidisciplinary. Following this observation, our next goal was to measure how the co-citation link weight threshold influences this enrichment. Therefore, for each publication year we scanned through all possible co-citation network weight thresholds and calculated the multidisciplinarity ratio for those network nodes that have at least one link not weaker than the given threshold. We found that for low link weight thresholds the multidisciplinarity ratio tends to grow as the threshold grows. The range where this relationship holds may differ for the individual years. We show examples for this initial range in Figure 10. For instance, in 1983 the multidisciplinarity ratio grows as a function of the link weight threshold () up to approximately . We note that for each year the optimized weight threshold used for identifying groups in Section 4.2 falls into this special initial range of that year.
6 Conclusions
We identified and analyzed the dense cores of yearly article co-citation networks based on Web of Science citations (1975-2008). We joined the identified yearly co-citation paper clusters (also called: groups, modules or intellectual bases) to obtain the timelines of scientific fields. Next, we quantified the structure of co-citation groups (through group lifespan, size, efficiency, cohesion, and overlap) and listed the topics of the groups (through title-based tags and WoS category terms). We applied a task-specific combination of methods: (i) the Clique Percolation Method and the module joining method for identifying the groups of articles and the timelines, and (ii) term frequencies, Tf-Idf scores, and the rCUR dimension reduction technique to find appropriate tags for the groups.
We found that most groups have short lifespans (1 or 2 years) and that larger groups tend to live longer. Among the few long-lived groups the longest lifespan is 24 years. This group (G5 on Figure 4) focuses on the topics cell-death, apoptosis, tumours, cancer and cell-cycle. We found that for large groups the total relative overlap (the ratio of a group’s nodes that it shares with other groups) is low, but for small groups it can be high. We quantified the influence of each group on science over time by calculating its yearly efficiency (the efficiency measures the number of articles citing the group from outside). A few of the groups have high efficiencies, which is usually caused by a few of their highly cited articles. However, the efficiency of most groups in most years is much lower than these top values.
We constructed a map of the co-cited groups with the longest lifespans (Figure 4). This map includes the groups’ most relevant Web of Science (WoS) categories, group sizes, characteristic topics and article transitions between the groups. This map helped us to track in time the groups with high group transition activity, and to survey the topic shifts of the groups. Moreover, we analyzed in detail one selected article on which topic labels changed over time. Also, we noticed that the WoS category “multidisciplinary sciences” is over-represented in the co-cited article groups in almost every year as compared to all published papers. We found that the cores of the co-cited articles are mainly multidisciplinary.
To the best of our knowledge the paper (Sinatra et al, 2015) is one of the very few that are similar both in their topic and their scale to the current paper. Sinatra et. al. have quantified the “rapid growth and increasing multidisciplinarity of physics” in groups of publications defined by scientific literature classification schemes. As a contrast,
-
(1)
the current paper works with the entire Web of Science,
-
(2)
when it discusses multidisciplinarity, it emphasizes not growth, but relative amount, and
-
(3)
it quantifies multidisciplinarity in groups of papers identified with a special novel combination of numerical techniques.
Regarding further challenges and the limitations of the approach explained in the current paper, first note that we used the time dependent version of the Clique Percolation Method, which focuses on the most connected parts of the co-citation network. Hence, several papers that are cited regularly, but not always co-cited with the same papers, are out of the scope of this work. Second, co-citation does not always indicate close relatedness. For example, most scientific publications start with an introductory part in which the authors put their work into a wide context, thus, the papers cited in an introduction can have very different topics. Third, in any field of science citations are not equal: a handful of citations may be crucial while others remain less important. The most straightforward way to account for this effect is to construct the yearly co-citation networks by applying citations that are weighted by relevance, e.g., their directed edge betweenness centralities.
Finally, we note that from the point of view of earlier research (Levitt and Thelwall, 2008) it is unexpected that multidisciplinary papers are co-cited for a long time. Such stability was earlier thought to be characteristic of monodisciplinary papers only due to their clearly defined topic. Note also that the current paper’s results go beyond co-citation networks. Compared to the co-citation network we find an even higher concentration of multidisciplinarity in the evolving dense groups (modules) of co-cited papers.
Acknowledgements.
We thank Tamás Vicsek, Gergely Palla and Bálint Tóth for discussions and advice. This project was supported by the European Union and the European Social Fund through the FuturICT.hu project (Grant ID: TAMOP-4.2.2.C-11/1/KONV-2012-0013) and the Hungarian National Science Fund (Grant ID: OTKA K105447).References
- Albarrán et al (2011) Albarrán P, Crespo JA, Ortuño I, Ruiz-Castillo J (2011) The skewness of science in 219 sub-fields and a number of aggregates. Scientometrics 88(2):385–397
- Altschul et al (1990) Altschul SF, Gish W, Miller W, Myers EW, Lipman DJ (1990) Basic local alignment search tool. Journal of Molecular Biology 215(3):403–410
- Bodor et al (2012) Bodor A, Csabai I, Mahoney MW, Solymosi N (2012) rCUR: an R package for CUR matrix decomposition. BMC Bioinformatics 13(1):103
- Braam et al (1991a) Braam RR, Moed HF, van Raan AFJ (1991a) Mapping of science by combined co-citation and word analysis. I. Structural aspects. Journal of the American Society for Information Science 42(4):233–251
- Braam et al (1991b) Braam RR, Moed HF, van Raan AFJ (1991b) Mapping of science by combined co-citation and word analysis. II: Dynamical aspects. Journal of the American Society for Information Science 42(4):252–266
- Bradford (1976) Bradford MM (1976) A rapid and sensitive method for the quantitation of microgram quantities of protein utilizing the principle of protein-dye binding. Analytical Biochemistry 72(1):248–254
- Chen (2004) Chen C (2004) Searching for intellectual turning points: Progressive knowledge domain visualization. Proceedings of the National Academy of Sciences of the United States of America 101(suppl.1):5303–5310
- Chen (2006) Chen C (2006) CiteSpace II: Detecting and visualizing emerging trends and transient patterns in scientific literature. Journal of the American Society for Information Science and Technology 57(3):359–377
- Chen et al (2010) Chen C, Ibekwe-SanJuan F, Hou J (2010) The structure and dynamics of cocitation clusters: A multiple-perspective cocitation analysis. Journal of the American Society for Information Science and Technology 61(7):1386–1409
- Chomczynski and Sacchi (1987) Chomczynski P, Sacchi N (1987) Single-step method of RNA isolation by acid guanidinium thiocyanate-phenol-chloroform extraction. Analytical Biochemistry 162(1):156–159
- Collins et al (1997) Collins JJ, Imhoff TT, Grigg P (1997) Noise-mediated enhancements and decrements in human tactile sensation. Physical Review E 56(1):923–926
- Érdi et al (2012) Érdi P, Makovi K, Somogyvári Z, Strandburg K, Tobochnik J, Volf P, Zalányi L (2012) Prediction of emerging technologies based on analysis of the US patent citation network. Scientometrics 95(1):225–242
- Gipp and Beel (2009) Gipp B, Beel J (2009) Citation Proximity Analysis (CPA) - A new approach for identifying related work based on Co-Citation Analysis. In: Proceedings of the 12th International Conference on Scientometrics and Informetrics (ISSI’09), Rio de Janeiro (Brazil): International Society for Scientometrics and Informetrics, vol 2, pp 571–575
- Glänzel and Schubert (2003) Glänzel W, Schubert A (2003) A new classification scheme of science fields and subfields designed for scientometric evaluation purposes. Scientometrics 56(3):357–367
- Glänzel et al (1999a) Glänzel W, Schubert A, Czerwon HJ (1999a) An item-by-item subject classification of papers published in multidisciplinary and general journals using reference analysis. Scientometrics 44(3):427–439
- Glänzel et al (1999b) Glänzel W, Schubert A, Schoepflin U, Czerwon HJ (1999b) An item-by-item subject classification of papers published in journals covered by the SSCI database using reference analysis. Scientometrics 46(3):431–441
- González et al (2007) González MC, Herrmann HJ, Kertész J, Vicsek T (2007) Community structure and ethnic preferences in school friendship networks. Physica A 379(1):307–316
- Griffith et al (1974) Griffith BC, Small HG, Stonehill JA, Dey S (1974) The structure of scientific literatures II: Toward a macro- and microstructure for science. Science Studies 4(4):339–365
- Kessler (1963) Kessler MM (1963) Bibliographic coupling between scientific papers. American Documentation 14(1):10–25
- Klavans and Boyack (2011) Klavans R, Boyack KW (2011) Using global mapping to create more accurate document-level maps of research fields. Journal of the American Society for Information Science and Technology 62(1):1–18
- Lai and Wu (2005) Lai KK, Wu SJ (2005) Using the patent co-citation approach to establish a new patent classification system. Information Processing and Management 41(2):313–330
- Levitt and Thelwall (2008) Levitt JM, Thelwall M (2008) Is multidisciplinary research more highly cited? A macrolevel study. Journal of the American Society for Information Science and Technology 59(12):1973–1984
- Leydesdorff (2007) Leydesdorff L (2007) Betweenness centrality as an indicator of the interdisciplinarity of scientific journals. Journal of the American Society for Information Science and Technology 58(9):1303–1319
- Marshakova (1973) Marshakova IV (1973) System of document connections based on references. Nauchno-Tekhnicheskaya Informatsiya Seriya 2-Informatsionnye Protsessy I Sistemy (6):3–8
- Moed et al (1995) Moed H, De Bruin R, Van Leeuwen, Th (1995) New bibliometric tools for the assessment of national research performance: Database description, overview of indicators and first applications. Scientometrics 33(3):381–422
- NWB Team (2006) NWB Team (2006) Network Workbench Tool. Indiana University, Northeastern University and University of Michigan, http://nwb.slis.indiana.edu
- Palla et al (2005) Palla G, Derényi I, Farkas I, Vicsek T (2005) Uncovering the overlapping community structure of complex networks in nature and society. Nature 435(7043):814–818
- Palla et al (2007) Palla G, Barabási AL, Vicsek T (2007) Quantifying social group evolution. Nature 446(7136):664–667
- Porter and Rafols (2009) Porter A, Rafols I (2009) Is science becoming more interdisciplinary? Measuring and mapping six research fields over time. Scientometrics 81(3):719–745
- Porter (1980) Porter MF (1980) An algorithm for suffix stripping. Program 14(3):130–137
- Salton and Buckley (1988) Salton G, Buckley C (1988) Term-weighting approaches in automatic text retrieval. Information Processing & Management 24(5):513–523
- Sanger et al (1977) Sanger F, Nicklen S, Coulson AR (1977) DNA sequencing with chain-terminating inhibitors. Proceedings of the National Academy of Sciences 74(12):5463–5467
- Sci2 Team (2009) Sci2 Team (2009) Science of Science (Sci2) Tool. Indiana University and SciTech Strategies, https://sci2.cns.iu.edu
- Sinatra et al (2015) Sinatra R, Deville P, Szell M, Wang D, Barabási AL (2015) A century of physics. Nature Physics 11(10):791–796
- Small (1973) Small H (1973) Co-citation in the scientific literature: A new measure of the relationship between two documents. Journal of the American Society for Information Science 24(4):265–269
- Small and Griffith (1974) Small H, Griffith BC (1974) The structure of scientific literatures I: Identifying and graphing specialties. Science Studies 4(1):17–40
- Small et al (1985) Small H, Sweeney E, Greenlee E (1985) Clustering the Science Citation Index using co-citations. II. Mapping science. Scientometrics 8(5):321–340
- de Solla Price (1965) de Solla Price DJ (1965) Networks of scientific papers. Science 149:510–515
- Steele and Stier (2000) Steele TW, Stier JC (2000) The impact of interdisciplinary research in the environmental sciences: a forestry case study. Journal of the American Society for Information Science 51(5):476–484
- Szántó-Várnagy et al (2014) Szántó-Várnagy Á, Pollner P, Vicsek T, Farkas IJ (2014) Scientometrics: Untangling the topics. National Science Review 1(3):343–345
- Van Eck and Waltman (2010) Van Eck NJ, Waltman L (2010) Software survey: VOSviewer, a computer program for bibliometric mapping. Scientometrics 84(2):523–538
- White and Griffith (1981) White HD, Griffith BC (1981) Author cocitation: A literature measure of intellectual structure. Journal of the American Society for Information Science 32(3):163–171
- Wisdom et al (1999) Wisdom R, Johnson RS, Moore C (1999) c-Jun regulates cell cycle progression and apoptosis by distinct mechanisms. The EMBO Journal 18(1):188–197