Molecular line study of massive star forming regions from the RMS survey
Abstract
In this paper we selected a sample of massive star forming regions from the Red MSX Source (RMS) survey, to study star formation activities (mainly outflow and inflow signatures). We focused on three molecular lines from the Millimeter Astronomy Legacy Team Survey at 90 GHz (MALT90): HCO+(1-0), H13CO+(1-0) and SiO(2-1). According to previous observations, our sources could be divided into two groups: nine massive young stellar object (MYSO) candidates (radio-quiet) and ten HII regions (having spherical or unresolved radio emissions). Outflow activities were found in eleven sources while only three show inflow signatures in all. The high outflow detection rate means outflows are common in massive star forming regions. The inflow detection rate was relatively low. We suggest this was due to beam dilution of the telescope. All the three inflow candidates have outflow(s). The outward radiation and thermal pressure from the central massive star(s) do not seem to strong enough to halt accretion in G345.0034-00.2240. Our simple model of G318.9480-00.1969 shows it has an infall velocity of about 1.8 km s-1. The spectral energy distribution (SED) analysis agrees our sources are massive and intermediate-massive star formation regions.
keywords:
ISM: molecules - ISM: outflows and inflow - ISM: structure - stars: formation - stars: protostars1 Introduction
Massive stars have a deep impact on the evolution of galaxies. Despite of their short lives, they determine the main chemical and physical properties of the nearby interstellar medium (ISM). Both theories and observations demonstrate they could hamper or trigger the next generation of star formation, by the expansion of HII regions and supernova explosions at the end of their lives (e.g. Elmegreen & Lada 1977; Lefloch & Lazareff 1994). However, their formation mechanism is still poorly understood as they used to form in clusters, and detail study of massive star formation is further hampered by their short lives, far distances, rare sources and extensive dust extinctions. Several mechanisms have been proposed that high-mass stars could form by accretion through massive disks (e.g. Keto et al. 2002), competitive accretions in dense clusters (Bonnell et al. 2004), ionized accretion (Keto Wood, 2006), and mergers of several low-mass stars (Bonnell et al. 1998). The former three models are similar to that of low-mass star formation, accompanied by outflow during the process of gravitational collapse. Recent observations appear to favor the former three mechanism as stellar mergers require a high stellar density of 108 stars pc-3, which is more than 4 orders of magnitude larger than those found in young embedded dense clusters (Bonnell 2002). Given the accretion timescales in massive star-forming regions are much shorter than those in low mass star-forming regions, the inside nuclear burning of hydrogen takes place while massive stars are still accreting, which means there is no pre-main-sequence stage for massive stars. Then substantial UV photons and ionized stellar winds rapidly ionize the surrounding hydrogen, forming a hyper-compact HII region (HCHII) or ultracompact HII region (UCHII). Many questions are still unclear: whether accretion could be halted by the strong outward radiation and thermal pressure. Does it continue in an ionized form? Does it continue through a molecular or ionized disk?
| MSX | RA | Dec. | Type | Vlsra | Da | H2O | |
|---|---|---|---|---|---|---|---|
| name | (J2000) | (J2000) | (candidate) | (km s-1) | (kpc) | maser | |
| G316.5871-00.8086 | 14:46:23.24 | -60:35:47.0 | MYSO | -45.8 | 3.2 | Y | |
| G318.9480-00.1969 | 15:00:55.31 | -58:58:52.6 | MYSO | -34.5 | 2.6 | Y | |
| G326.4755+00.6947 | 15:43:18.94 | -54:07:35.4 | MYSO | -41.6 | 1.8 | Y | |
| G326.5437+00.1684 | 15:45:53.26 | -54:30:01.3 | MYSO | -74.1 | 3.6 | N | |
| G326.6618+00.5207 | 15:45:02.84 | -54:09:03.0 | MYSO | -39.1 | 1.8 | Y | |
| G326.7796-00.2405 | 15:48:55.20 | -54:40:37.7 | MYSO | -64.7 | 3.6 | Y | |
| G329.0663-00.3081 | 16:01:09.93 | -53:16:02.3 | MYSO | -42.6 | 2.9 | Y | |
| G333.3151+00.1053 | 16:19:29.00 | -50:04:40.9 | MYSO | -47.4 | 4.0 | Y | |
| G345.5043+00.3480 | 17:04:22.87 | -40:44:23.5 | MYSO | -17.8 | 2.1 | Y | |
| G327.9018+00.1538 | 15:53:10.87 | -53:39:58.1 | HII | -93.1 | 5.8 | N | |
| G329.3371+00.1469 | 16:00:33.13 | -52:44:47.1 | HII | -107.1 | 7.3 | Y | |
| G332.8256-00.5498 | 16:20:10.46 | -50:53:28.6 | HII | -4.0 | 0.19 | N | |
| G336.9842-00.1835 | 16:36:12.42 | -47:37:57.5 | HII | -75.1 | 10.8 | Y | |
| G337.0047+00.3226 | 16:34:04.73 | -47:16:29.2 | HII | -62.8 | 10.8 | N | |
| G339.1052+00.1490 | 16:42:59.58 | -45:49:43.6 | HII | -78.2 | 4.9 | N | |
| G340.2480-00.3725 | 16:49:29.97 | -45:17:44.4 | HII | -50.3 | 3.9 | N | |
| G345.0034-00.2240 | 17:05:11.19 | -41:29:06.3 | HII | -28.7 | 2.9 | N | |
| G345.4881+00.3148 | 17:04:28.04 | -40:46:23.3 | HII | -17.6 | 2.1 | N | |
| G348.8922-00.1787 | 17:17:00.10 | -38:19:26.4 | HII | 1.0 | 18.2 | Y |
a: Urquhart et al. (2007b; 2008)
In recent years, using color selection criteria and the IRAS point source catalogue, several attempts have been taken to search for MYSOs (e.g. Molinari et al. 1996; Sridharan et al. 2002). However, because of the large IRAS beam (3-5′ at 100 m ), these selected samples tend to be biased towards bright, isolated sources and avoid dense clustered environments at the Galactic mid-plane. By comparing the the colors of sources from the MSX and 2MASS point sources to those known MYSOs, Lumsden et al. (2002) identified approximately 2000 MYSO candidates. The Red MSX Source (RMS) survey is an ongoing multi-wavelength observational programme and will provide us the largest MYSO sample for statistical studies. Using the Australia Telescope Compact Array (ATCA), Urquhart et al. (2007a) completed the 5 GHz observations of 892 RMS sources in the southern sky. This programme divided these sources into three groups: real MYSO candidates, HII regions (UCHII and HCHII) and others such as evolved stars and planetary nebulae (PNe). To obtain kinematic distances, Urquhart et al. (2007b; 2008) made 13CO (1-0) and (2-1) observations at Mopra, Onsala and Purple Mountain Observatory (PMO) 13.7 m telescope, and the 15 m James Clerk Maxwell Telescope (JCMT), as well as archival data extracted from the Galactic Ring Survey (GRS). They found that the majority of these sources have multiple velocity components along each line of sight. The multiple emission features make it difficult to assign a unique kinematic velocity to each source. In order to identify a more reliable molecular component, they further searched archival water and methanol masers catalogues of Valdettaro et al. (2001) and Pestalozzi et al. (2005), less abundant but denser gas molecular traces like CS (2-1) observations by Bronfman et al. (1996). And then by using the rotation curve of Brand and Blitz (1993) and their radial velocities, kinematic distances for all detected components can be derived. Based on the above observations and research, we selected about twenty RMS sources to study star formation activities (mainly outflow and inflow signatures) using data from Millimeter Astronomy Legacy Team 90 GHz survey (MALT90). We present the introductions of our data and source selections in section 2, results and analysis in section 3, and summary in section 4.
2 Data and source selections
The MALT90 is a large international project aimed at characterizing the sites within our Galaxy where high-mass stars will form. Exploiting the unique broad frequency range and fast-mapping capabilities of the Mopra 22-m telescope, MALT90 maps 16 emission lines simultaneously at frequencies near 90 GHz. These molecular lines will probe the physical, chemical, and evolutionary states of dense high-mass star-forming cores.We focused on three molecular lines from the MALT90 Survey: HCO+(1-0), H13CO+(1-0) and SiO(2-1). HCO+ often shows infall signatures and outflow wings(e.g., Rawlings et al. 2004; Fuller et al. 2005). H13CO+(1-0) provides optical depth and line profile information. SiO (2-1) is seen when SiO is formed from shocked dust grains, typically in outflows (Schilke et al. 1997). The survey covers a Galactic longitude range of -60 to 15∘ and Galactic latitude range of -1 to +1 ∘. The observations were carried out with the newly upgraded Mopra Spectrometer (MOPS). The full 8 GHz bandwidth of MOPS was split into 16 zoom bands of 138 MHz each providing a velocity resolution of 0.11 km s-1. The angular resolution of Mopra is about 38 arcsec, with beam efficiency between 0.49 at 86 GHz and 0.42 at 115 GHz (Ladd et al. 2005). The maps were made with 9′′ spacing between adjacent rows. More information about this survey can be found in Foster et al. (2011) and Hoq et al. (2013). The MALT90 data includes (l, b, v) data cubes and (l, b) moment and error maps, and is publicly available from the MALT90 Home Page111See http://atoa.atnf.csiro.au/MALT90. The data processing was conducted using CLASS (Continuum and Line Analysis Single-Disk Software) and GreG (Grenoble Graphic) software packages.
In order to study massive star formation activities (mainly outflow and inflow signatures), we selected nineteen sources from the RMS survey by applying the following criteria: (1) Sources should not be on the edge of known HII or supernova regions, considering the large beam of the 22 m Mopra telescope; (2) According to the observations of ATCA (Urquhart et al. 2007a), sources should be radio quiet or have a simple spherical/unresolved radio emissions; (3) All sources should be detected by MALT90; (4)The LSR velocities of HCO+ and H13CO+ should be the same as Urquhart et al. (2007b; 2008). We need to mention here that our sample is not complete according to the above four criteria. We wish a much more complete research of the RMS sources by the MALT90 data in the near future. The information of our selected sources are listed in table 1. Nearly all of the MYSO candidates are associated with water masers according to former observations, however in the HII regions only three sources are associated with water maser emissions. This suggests in massive star formation regions, water masers are more likely to be associated with MYSOs than HII regions.
| Source | Shift | (Km s-1) | N (HCO+) ( 1012 cm-2) | M (M⊙) | Pout ( km s-1) | Eout (M⊙ [km s-1]2) |
|---|---|---|---|---|---|---|
| G326.4755+00.6947 | red | (-40, -33) | 22.4 | 16.8 | 118 | 412 |
| blue | (-47, -42) | 17.7 | 19.0 | 95 | 238 | |
| G326.7796-00.2405 | red | (-64, -62) | 10.0 | 21.4 | 43 | 43 |
| blue | (-69, -66) | 8.91 | 23.9 | 72 | 108 | |
| G333.3151+00.1053 | red | (-45.3, -44) | 4.8 | 15.2 | 20 | 13 |
| blue | (-50, -47) | 11.8 | 46.8 | 140 | 211 | |
| G345.5043+00.3480 | red | (-12, -15) | 12.2 | 6.7 | 20 | 30 |
| blue | (-20, -24) | 9.1 | 10.0 | 40 | 80 | |
| G329.3371+00.1469 | red | (-106, -104) | 8.9 | 78.4 | 157 | 157 |
| blue | (-112, -110 ) | 5.6 | 49.3 | 99 | 99 | |
| G332.8256-00.5498 | red | (-49 -53) | 14.0 | 1.0 | 4 | 8 |
| blue | (-65, -61) | 11.3 | 1.7 | 7 | 14 | |
| G340.2480-00.3725 | red | (-49, -46) | 9.5 | 50.2 | 151 | 226 |
| blue | (-56, -53) | 10.7 | 65.9 | 198 | 297 | |
| G345.0034-00.2240a | red | (-22, -19) | 6.1 | 14.8 | 89 | 266 |
| blue | (-35, -31 ) | 9.8 | 28.6 | 172 | 515 | |
| G345.4881+00.3148 | red | (-15, -12) | 14.0 | 21.6 | 65 | 97 |
| blue | (-22, -19) | 21.8 | 28.6 | 86 | 129 |
a: The outflow parameters of this source are calculated by HNC(1-0).
| RMS | Stellar mass | Disk mass | Envelope mass | Total luminosity | Best-fit |
|---|---|---|---|---|---|
| sources | [M⊙] | [M⊙] | [M⊙] | [L⊙] | model |
| G318.9480-00.1969 | 9.56 | 4.68 10-3 | 9.65 100 | 5.72 103 | 3014991 |
| G326.4755+00.6947 | 10.10 | 9.77 10-3 | 1.14 103 | 9.06 103 | 3000136 |
| G326.7796-00.2405 | 8.08 | 4.58 10-2 | 2.68 101 | 7.33 102 | 3004818 |
| G329.0663-00.3081 | 9.49 | 5.52 10-2 | 3.08 101 | 1.45 103 | 3010080 |
| G333.3151+00.1053 | 13.91 | 5.88 10-4 | 6.46 102 | 1.70 104 | 3000244 |
| G345.0034-00.2240 | 9.67 | 7.58 10-2 | 4.42 101 | 7.81 103 | 3003254 |
3 Results and Discussions
Infall and outflow are two of the most important elements to understand the theories of massive star formation. Infall can act to replenish disk material as mass falls onto a protostar, while outflows serve as a release mechanism for the angular momentum that builds up during the accretion process. These motions can be studied by investigating the profiles of optically thick and optically thin molecular lines. Blue profile, a combination of a double peak with a brighter blue peak or a skewed single blue peak in optically thick lines, can be used to study infall motions (Sun et al. 2008). Surely blue profile may also be caused by rotation and outflow. However, infall motion is the only process that would produce consistently the blue profile. Outflow and rotation only produce a blue asymmetric line profile along a particular line of sight to a source (Sun et al. 2008).
SiO is also a well-known tracer of recent outflow. In the cold diffuse ISM, the element of Si is regarded to be frozen into dust grains. When the gas is shocked (i.e., the gas through which a protostellar outflow is passing) the dust grains can sublimate and Si is released into gas phase. Thus, the detections of SiO emissions from MYSOs could always be equal to the detections of recent outflow activities. In the following sections, we use position-velocity (PV) diagram of HCO+ (1-0) and/or SiO (2-1) (if detected) to study outflows in our sample. For G318.9480-00.1969, we also employed the three dimensional radiative-transfer code RADMC3D, developed by C. Dullemond222See http://www.ita.uni-heidelberg.de/dullemond/software/radmc-3d/, to compute the HCO+ (1-0) line emission from an infalling model.
3.1 Outflow signatures detected by HCO+ (1-0) and SiO (2-1)
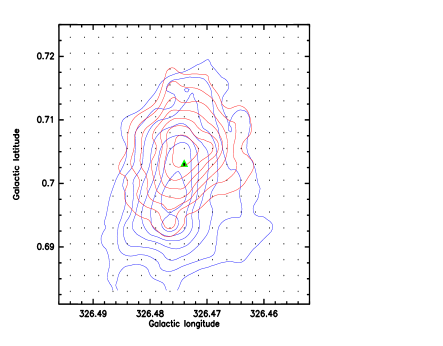
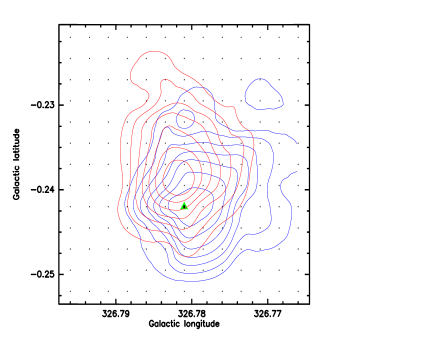
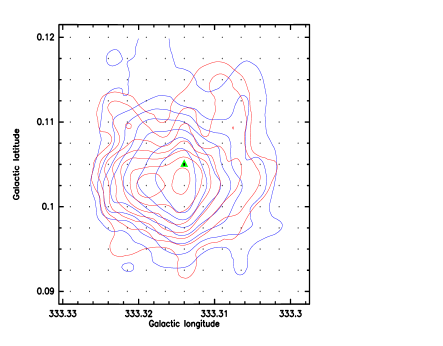
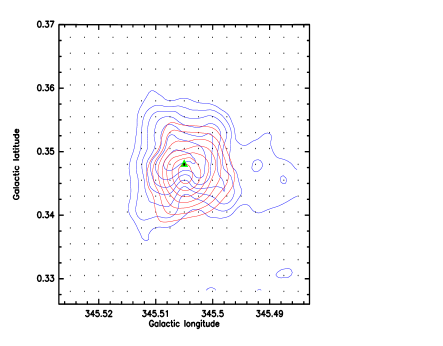
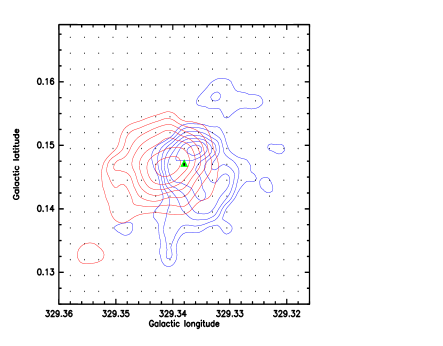
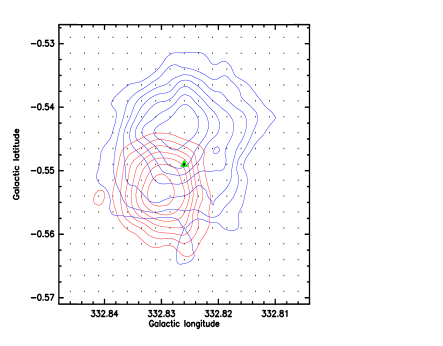
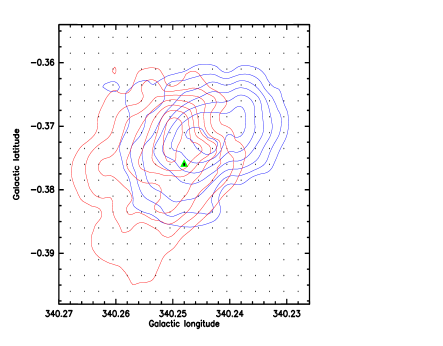
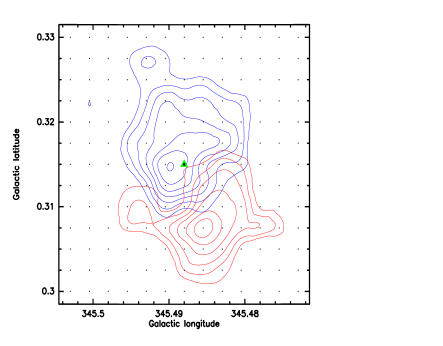
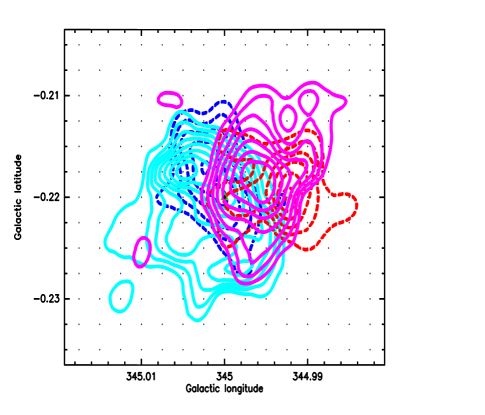
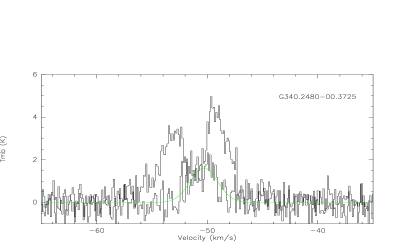
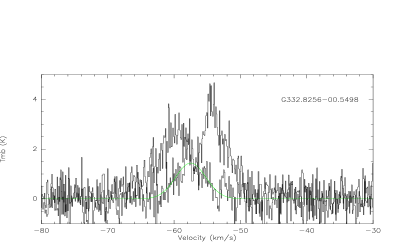
Outflow makes an important contribution to the line wing emissions of HCO+ (1-0), as it becomes optically thick quickly and readily self-absorbs in dense gas regions. We drew PV diagrams for our sources. According to the PV diagrams, we selected the integrated range of wings and determined the outflow intensities of red and blue lobes. Four HCO+ (1-0) PV diagrams of our nine MYSO candidates and four in ten HII regions show distinct wing emissions (figure 1 and figure 2, respectively), which may be probably caused by bipolar outflows. Figure 3 and figure 4 show the integrated maps by integrating wing emissions of our MYSOs and HII regions, respectively. The Mopra beam size is 38′′ and the spacing of the spectra is 9′′, so there are about 4 4 = 16 spectra within a single beam. In the sample of MYSOs, the peak emissions of red and blue lobes are within one beam and we could not determine the outflow directions. It also seems impossible that all the axis of these outflows are nearly parallel with the line of sight. By comparing figure 3 and figure 4, it can be noted that the MYSO outflows are more compact than those found in HII regions. Considering the mean distance of our RMS sources with radio emission ( 5.7 kpc) is larger than those radio quiet ( 2.6 kpc), our result agrees MYSO candidates should be in much earlier stage than HCHII/UCHII regions.
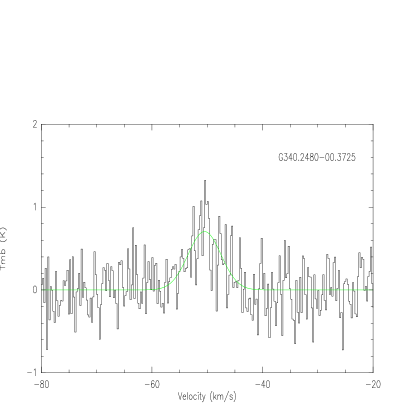
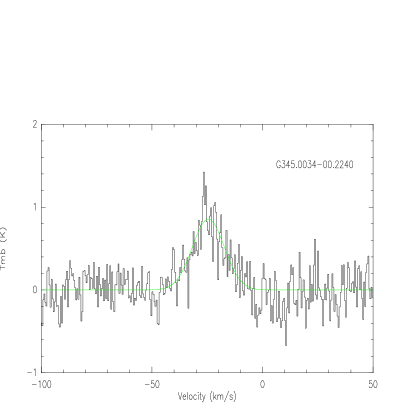
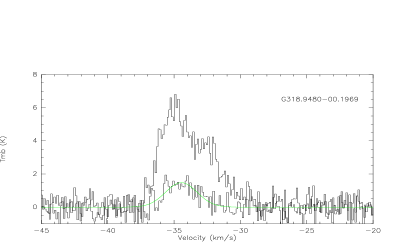
Figure 5 shows the five detected SiO spectra toward our sources. Among these five sources, three (G318.9480-00.1969, G326.4755+00.6947, G329.0663-00.3081) are MYSO candidates and the other two (G340.2480-00.3725 and G345.0034-00.2240) are HII regions. Models and observations also suggest SiO emissions could be caused by photodissociated region (PDR) and not an outflow (e.g. Schilke et al. 2001; Shepherd et al. 2004). For the MYSO candidates, as they are radio quiet, SiO emissions triggered by PDR around HII regions are impossible. However, a PDR could also exist without the presence of ionized gas. Through the method described by Klaassen et al. (2007), we estimated the SiO column densities 1014 cm-2 of the five sources, much larger than those found in PDRs ( 1012 cm-2) (Schilke et al. 2001). We thus regard these SiO emissions are due to recent outflow activities.
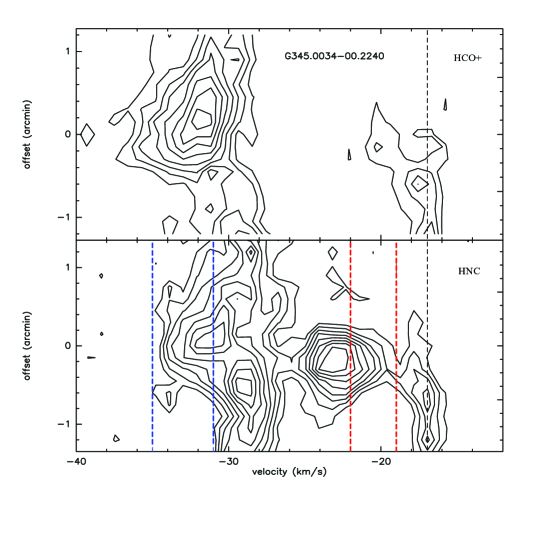
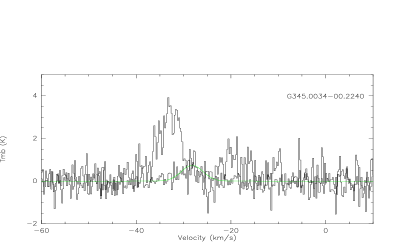
We should mention that the outflow detection rate is just a low limit. One reason is due to the beam dilution, especially for the MYSO candidates. For example outflow activity was not found in MYSO G318.9480-00.1969 through PV diagram analysis, however the SiO emission discussed above shows recent outflow(s) in this region. Outflow(s) in this source may be very young and is thus heavily diluted. The other reason is due to the molecular line we used to trace outflow. Considering the wide range of physical conditions in star formation regions (i.e. gas densities from 10-20 g cm-3 to 10-16 g cm-3, and gas temperatures from 10 K to 100 K), there is non-trivial molecular tracer to detect outflows in all conditions. For example, the PV diagram of HCO+ in G345.0034-00.2240 does not show red-shifted emission wings(figure 6). The gas near -17 km/s is possibly unrelated to this source. However, when we chose HNC instead of HCO+, wing emissions caused by bipolar outflow was evident. Besides, the SiO spectra of G345.0034-00.2240 extends from -8 km s-1 to -48 km s-1. The wide line emissions further suggest young outflow activities. PV diagram of SiO in G345.0034-00.2240 cut along east-west direction is shown in figure 7. Figure 7 also shows the maps of the integrated blue and red shifted SiO (2-1) emission (the dash contours). It can be noted SiO traces the inner region of the outflow, compared to HNC. The outflow detection rate by SiO in MYSOs ( 33 ) is much higher than that in HII regions ( 20 ). That is because SiO is particularly well suited to tracing recent outflows, as it persists in the gas phase for only 104 years after being released by shocks(e.g., Pineau des Forets et al. 1997).
Assuming that HCO+ (1-0) emission in the line wings to be optically thin and Local Thermodynamic Equilibrium (LTE), X(HCO+) = [HCO+]/[H2] = 10-8 (Turner et al. 1997) and Tex = 15 K, we derive the column density using:
| (1) |
where 0, gu, gland Aul are the rest frequency, the upper and lower level degeneracies and the Einstein’s coefficient of HCO+, Q(Tex) is the partition function, and c is the speed of light. In addition, by assuming that the HCO+ emission is optically thin in the line wings, we use the approximation:
| (2) |
where Tbg is the temperature of the background radiation (2.73 K). Using = mH d2 X(HCO+)-1 (HCO+), we obtain the masses for the red and blue molecular outflows, where (HCO+) is the HCO+ column density calculated through the above equations, d is the distance, is the area of the lobes (within 50 of each peak emission), and mH is the hydrogen atom mass. We adopt a mean molecular weight per H2 molecule of = 2.72 to include helium. We estimate the momentum and energy of the red and blue lobes using
| (3) |
and
| (4) |
where is a characteristic velocity estimated as the difference between the maximum velocity of HCO+ emission in the red and blue wings respectively, and the molecular ambient velocity (). The derived parameters are shown in table 2.
3.2 Infall
3.2.1 The blue profile
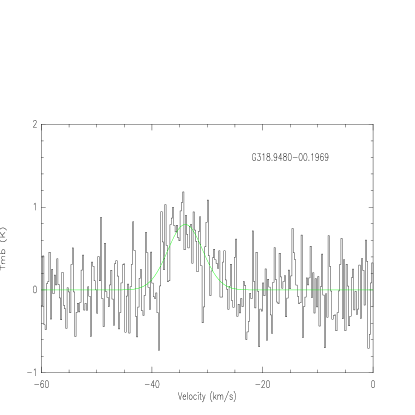
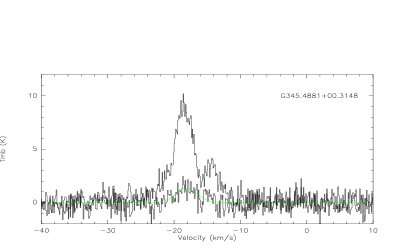
Previous studies show HCO+ (1-0) is a good inward motion tracer in star formation regions (e.g. Sun et al. 2008). The five HCO+ (1-0) emission lines of our sources (figure 8, right panels) are far of having a simple Gaussian shape, presenting asymmetries, and spectral wings or shoulders, which suggest that the molecular gas is affected by the dynamics of these star-forming regions. However, we know double peak could also be caused by two velocity components in the line of sight. The detections of optically thin molecular lines such as H13CO+ (1-0) could help us to rule out this possibility. Mapping observations could help us to identify whether this was caused by inward motions or other dynamics such as outflow, rotation and expansions of HII regions. Figure 8 (the left panels) shows the mapping observations towards our sources with double peaked HCO+ (1-0) emissions. All the spectra of H13CO+ in figure 8 peaks near the dip of HCO+. Besides, three of them (G318.9480-00.1969, G345.0034-00.2240 and G345.4881+00.3148) show consistent blue profiles, indicating infall motions. To quantify the blue profile, we further used the asymmetry parameter V defined as the difference between the peak velocities of an optically thick line V(thick) and an optically thin line V(thin) in units of the optically thin line FWHM (Full Width at Half Maximum) dV(thin): V = . Mardones et al. (1997) adopted a criterion V -0.25 to indicate blue asymmetry. Our calculations further demonstrate blue profiles caused by inflow in G318.9480-00.1969(V = -0.27), G345.0034-00.2240 (V = -0.63) and G345.4881+00.3148 (V = -0.37). Outflow activities are also detected in these regions (see section 3.1). This suggests that like low star formation theories, massive stars in these regions are probably forming through accretion-outflow process. For G345.0034-00.2240, if the detection of recent outflow activity traced by SiO and the appearance to be undergoing infall are indeed caused by the central massive young star(s), this suggests the outward radiation and thermal pressure from the central massive star(s) do not strong enough to halt accretion. Like the case of G10.6-0.4 (Keto Wood 2006), accretion flow in this region may be ionized. Given the low angular resolution of the data (at 2.9 kpc, 38′′ is over half a parsec), it is also possible that a lower mass star is forming in the vicinity. Deeper observations should be carried out to study our speculation.
Sun et al. (2008) made single-pointing and mapping observations of HCO+ (1-0) from the 13.7m telescope of PMO. Among their 29 massive star-forming cores (mainly UCHII regions), six sources were identified to be strong infall candidates. The detection rate is consistent with our study, even though the resolution of Mopra is much higher than that of the 13.7m telescope (38′′ vs. 58′′). This may be because all of their source distances are less than 4 kpc while half of our sources locate more than 5 kpc away. Klaassen et al. (2007,2012) also obtained JCMT observations of HCO+/H13CO+ (4-3) to trace large scale inward motions in a sample of massive star-forming regions (mainly MYSOs, HCHII and UCHII regions). The infall rate in our sample is relatively low compared with their work. This partly may be due to their higher resolution (15′′ vs. 38′′). Besides, the J = 4-3 transition is likely a better asymmetry tracer than J = 1-0 (see figure 8 of Tsamis et al. 2008). Only one source in our MYSO candidates shows infall signature. This may be because the infall area within MYSO is relatively smaller than that in UCHII regions, and then more likely to be beam diluted.
3.2.2 A simple infall model of G318.9480-00.1969
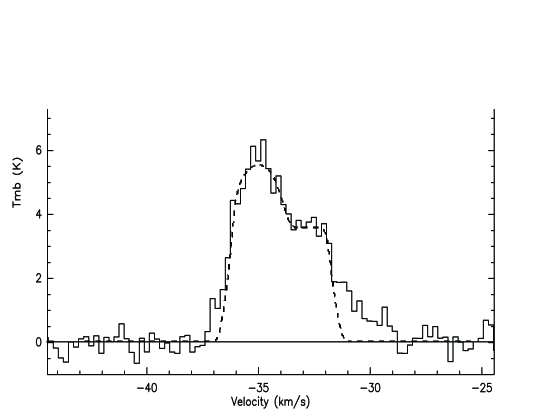
G318.9480-00.1969 is the only MYSO candidate showing infall signature. In this section, in order to constrain the spatial and dynamic structures of G318.9480-00.1969, we constructed a radiative-transfer model that reproduces the observations. The three-dimensional radiative-transfer code RADMC-3D, developed by C. Dullemond, was employed to compute the dust temperature from stellar heating and the continuum and line emission of an infall model. The dust opacity is from Ossenkopf Henning (1994) without grain mantles or coagulation. The molecular data of HCO+ comes from the Leiden LAMDA database333 http://www.strw.leidennuniv.nl/moldata. The line transfer assumes the gas temperature to be equal to the dust temperature and LTE (full non-LTE radiation transfer is also planned for RADMC-3D).
In our model, the volume density follows a radial power law, , with a total mass of 31 M⊙ (estimated from our observations) within a box of (4000 AU)3. Inside there is a star of 10 M⊙ (see section 3.3). The gas has a turbulence velocity of 0.5 km s-1 and is radially infalling with 1.8 km s-1 to the central star. The model is inevitably simplified. A comparison of the observed and model spectra is shown in figure 9. At the center, the model spectra matches well with the observation. However, the observed line seems to have line wing emissions, probably caused by outflow activities. The detected SiO spectra in this region indeed implies beam diluted outflow(s). Even though our model is consistent with the data, we should realize it does not provide errors of the parameters, and different models may also fit as well. However, it provides us a way to study the structure of star forming regions.
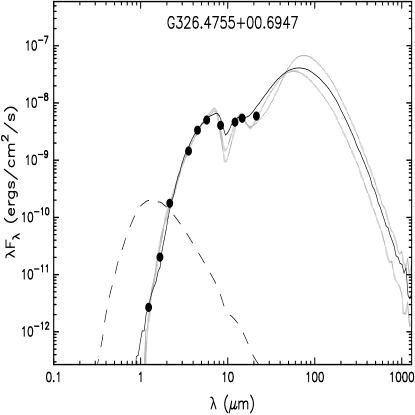
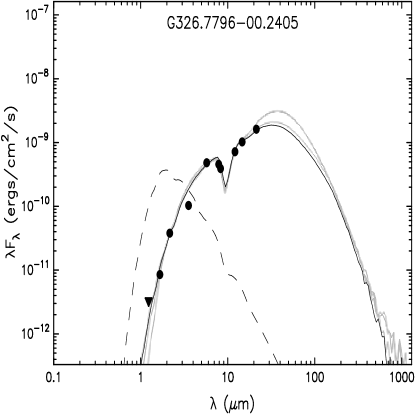
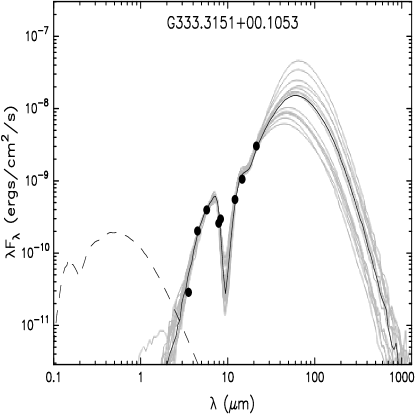
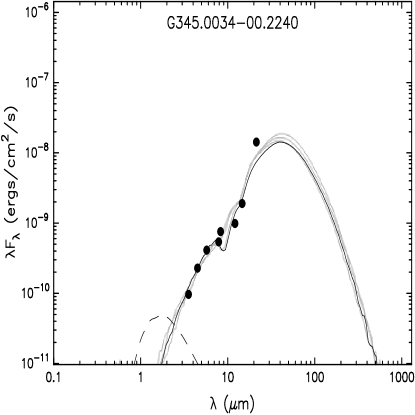
3.3 Spectral energy distribution
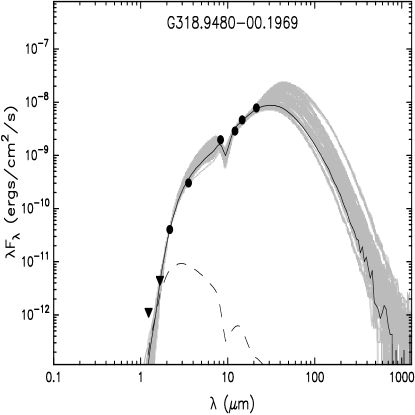
In this section, we try to fit the spectral energy distribution (SED) of our sources using the tool developed by Robitaille et al. (2007). Briefly, the SED-fitting tool works as a regression method to find the SEDs within a specified 2 from a large grid of models after fitting the input data points. The grid of models contains stellar masses, disk masses, mass accretion rates, and line-of-sight (LOS) inclinations. The grid of YSO models was computed by Robitaille et al. (2006) using the 20,000 two-dimensional radiation transfer models from Whitney et al. (2003a, 2003b, 2004). Each YSO model has SEDs for 10 viewing angles (inclinations), so the total YSO grid consists of 200,000 SEDs. We use archival data from 2MASS, IRAC of Spitzer, MSX to fit the SED of our sources. In addition to the best-fit model (the black line in figure 10), we also show the range of possible parameters that can be derived from models within the range of 2/ -2best/ 4 ( represents the number of data points). The best derived model parameters are listed in table 3 and the resulting SEDs are shown in figue 10. Of these six sources, five are HII regions. This may be because the protostar(s) of MYSOs are still deeply imbedded, even infrared emissions are hard to be detected. The SED agrees our sources are massive and intermediate-massive star formation regions, with masses ranging from 8 to 14 M⊙.
4 Summary
By analyzing HCO+(1-0), H13CO+(1-0) and SiO(2-1) molecular data from MALT90, we studied the outflow and infall activities in nineteen RMS sources. The high outflow detection rate ( 58 ) suggests that outflows are common in massive star forming regions as in low mass star forming regions. All of the detected outflows in our radio-quiet RMS sources are much more compact than those found in radio-loud RMS sources, indicating they are at earlier stages. The outward radiation and thermal pressure from the central massive star(s) of G345.0034-00.2240 do not seem to strong enough to halt accretion in this region. The detection of recent outflow activity traced by SiO and the appearance to be undergoing infall in this region suggest ionized accretion flow can continue through an HII region and massive star(s) in this region could be formed through ionized accretions. Only one source of our MYSO candidates shows infall signature. This may be because the infall area with MYSO is relatively small, and thus more likely to be beam diluted. A simple model of G318.9480-00.1969 shows it has an infall velocity of about 1.8 km s-1. The spectral energy distribution (SED) further agrees our RMS sources are massive and intermediate-massive star formation regions.
5 Acknowledgements
We thank the anonymous referee for constructive suggestions. This paper made use of information from the Red MSX Source (RMS) survey database http://rms.leeds.ac.uk/cgi-bin/public/RMS-DATABASE.cgi which was constructed with support from the Science and Technology Facilities Council of the UK. This research made use of data products from the Millimetre Astronomy Legacy Team 90 GHz (MALT90) survey. The Mopra telescope is part of the Australia Telescope and is funded by the Commonwealth of Australia for operation as National Facility managed by CSIRO.


References
- Bonnell et al. (1998) Bonnell, I.A. et al 1998, MNRAS, 298, 93
- Bonnell et al. (2002) Bonnell, I.A. 2002, in ASP Conf.Ser. 267, The Earliest Stages of Massive Star Birth, ed. P.A. Crowther (San Francisco: ASP), 193
- Bonnell et al. (2004) Bonnell, I.A. et al. 2004, MNRAS, 349, 735
- Bronfman et al. (1996) Bronfman, L., Nyman, L.-A., May, J., 1996, A&AS, 115, 81
- Elmegreen et al. (1977) Elmegreen, B. G., Lada C.J., 1977, ApJ, 214, 725
- Foster et al. (2011) Foster J.B., et al. 2011, ApJS, 197, 25
- Fuller et al. (205) Fuller, G. A., Williams, S. J., Sridharan, T. K., 2005, A&A, 442, 949
- Hoq et al. (2013) Hoq, S., Jackson, J.M., Foster, J.B., et al. 2013, ApJ, 777, 157
- Keto (2002) Keto, E. 2002, ApJ, 580, 980
- Keto et al. (2006) Keto, E., Wood, K. 2006, ApJ, 637, 850
- Klaassen & Wilson (2007) Klaassen, P.D., Wilson, C.D., 2007, ApJ, 663, 1092
- Klaassen et al. (2012) Klaassen, P.D., Testi, L., Beuther, H., 2012, A&A, 538, 140
- Ladd et al. (2005) Ladd, N., Purcell, C., Wong, T., & Robertson, S. 2005, PASA, 22, 62
- Lefloch et al. (1994) Lefloch, B., Lazareff, B.,1994, A&A, 289, 559
- Lumsden et al. (2002) Lumsden, S. L., Hoare, M. G., Oudmaijer, R. D., Richards, D. 2002, MNRAS, 336, 621
- Mardones et al. (1997) Mardones, D., Myers, P. C., Tafalla, M. et al. 1997, ApJ, 489, 719
- Molinari et al. (1996) Molinari, S., Brand, J., Cesaroni, R., Palla, F. 1996, A&A, 308, 573
- Ossenkopf & Henning (1994) Ossenkopf, V., & Henning, T. 1994, A&A, 291, 943
- Pestalozzi et al. (2005) Pestalozzi, M.R., Minier, V., Booth, R.S., 2005, A&A, 432, 737
- Pineau des Forets et al. (1997) Pineau des Forets, G., Flower, D. R., & Chieze, J.-P. 1997, in IAU Symp. 182, Herbig-Haro Flows and the Birth of Stars, ed. B. Reipurth & C. Bertout (Dordrecht: Kluwer), 199
- Rawlings et al. (2004) Rawlings, J. M. C., Redman, M. P., Keto, E., Williams, D. A., 2004, MNRAS, 351, 1054
- Robitaille (2006) Robitaille, T. P., Whitney, B. A., Indebetouw, R., Wood, K., Denzmore, P., 2006, ApJS, 167, 256
- Robitaille (2007) Robitaille, T. P., Whitney, B. A., Indebetouw, R., Wood, K., 2007, ApJS, 169, 328
- Schilke et al. (1997) Schilke, P., Walmsley, C. M., Pineau des Forets, G., Flower, D. R., 1997, A&A, 321, 293
- Schilke et al. (2001) Schilke, P., Pineau des Forts, G., Walmsley, C.M., et al., 2001, A&A, 372, 291
- Shepherd et al. (2004) Shepherd, D.S., Kurtz, S.E., Testi, L. 2004, ApJ, 601, 952
- Sridharan et al. (2002) Sridharan, T. K., Schilke, P., Menten, K. M., Wyrowski, F. 2002, ApJ, 566, 931
- Sun et al. (2009) Sun Yan, Gao Yu, 2008, MNRAS, 392, 170
- Tsamis et al. (2008) Tsamis, Y.G., Rawlings, J.M.C., Yates, J.A., Viti, S. 2008, MNRAS, 388, 898
- Urquhart et al. (2007a) Urquhart, J. S., Busfield, A. L., Hoare, M. G., et al. 2007a, A&A, 461, 11
- Urquhart et al. (2007b) Urquhart, J. S., et al. 2007b, A&A, 474, 891
- Urquhart et al. (2008) Urquhart, J. S., et al. 2008, A&A, 487, 253
- Valdettaro et al. (2001) Valdettaro, R., Palla, F., Brand, J., et al. 2001, A&A, 368, 845
- Whitney et al. (2004) Whitney, B. A., Indebetouw, R., Bjorkman, J.E., Wood, K., 2004, ApJ, 617, 1177
- Whitney et al. (2003a) Whitney, B. A., Wood, K., Bjorkman, J. E., Cohen, M., 2003a, ApJ, 598, 1079
- Whitney et al. (2003b) Whitney, B. A., Wood, K., Bjorkman, J. E., Wolff, M. J., 2003b, ApJ, 591, 1049