Hard X-ray emissions from Cassiopeia A observed by INTEGRAL
Abstract
Cassiopeia A (Cas A) as the nearby young remnant of a core-collapse supernova is the best candidate for astrophysical studies in supernova explosion and its environment. We studied hard X-ray emissions from Cas A using the ten-year data of INTEGRAL observations, and first detected non-thermal continuum emission from the source up to 220 keV. The 44Ti line emissions at 68 and 78 keV are confirmed by our observations with a mean flux of ph cm-2 s-1, corresponding to a 44Ti yield in Cas A of . The continuum emission from 3 – 500 keV can be fitted with a thermal bremsstrahlung of keV plus a power-law model of . The non-thermal emission from Cas A is well fitted with a power-law model without a cutoff up to 220 keV. This radiation characteristic is inconsistent with the diffusive shock acceleration models with the remnant shock velocity of only 5000km s-1. The central compact object in Cas A cannot contribute to the emission above 80 keV significantly. Some possible physical origins of the non-thermal emission above 80 keV from the remnant shock are discussed. We deduce that the asymmetrical supernova explosion scenario of Cas A is a promising scenario to produce high energy synchrotron radiation photons, where a part of ejecta with the velocity of and opening angle of can account for the 100-keV emission, consistent with the ”jet” observed in Cas A.
1 Introduction
Supernova remnants (SNRs) are considered as the main sites to produce the high energy cosmic rays in the energies at least up to the so-called knee region of keV. The accelerated electrons and protons in the shock fronts can produce non-thermal emissions observed from radio to gamma-ray bands. The radio to X-ray emission comes from synchrotron radiation from accelerated electrons. The gamma-ray emission (GeV – TeV) is either caused by inverse Compton scattering by the same electrons that cause synchrotron emission, or by pion production caused by collisions of accelerated protons/ions with the background plasma. The more direct evidence for the efficient cosmic-ray acceleration comes from detection of TeV gamma-rays in Galactic SNRs by ground-based Cherenkov Telescopes, e.g., HEGRA (Aharonian et al. 2001), MAGIC (Albert et al. 2007), HESS (Aharonian et al. 2004) and VERITAS (Humensky 2008). The non-thermal hard X-ray emissions (above keV) will be the other good way to probe the accelerating ability of SNRs. The first evidence for the shock acceleration of high-energy electrons up to 100 TeV comes from detecting the X-ray synchrotron emission in SN 1006 by ASCA (Koyama et al. 1995). Later OSSE onboard CGRO (The et al. 1996) and RXTE (Allen et al. 1997) observations also discovered hard X-ray tails up to keV in the supernova remnant Cas A, which suggested that this remnant can accelerate the electrons to energies at least TeV.
Cas A is the famous young supernova remnant ( 330 years old) which is bright in all electromagnetic spectrum, making it a unique laboratory for studying high-energy phenomena in SNRs. The distance of Cas A is determined at kpc (Reed et al. 1995). Cas A is the first SNR detected in TeV bands, first by HEGRA (Aharonian et al. 2001), and confirmed by MAGIC (Albert et al. 2007) and VERITAS (Humensky 2008) with a photon index of . Recently FERMI/LAT also detected the GeV emission from Cas A, with a photon index of between 0.5 and 50 GeV (Abdo et al. 2010). Non-thermal hard X-ray emission from Cas A was also reported by OSSE (from 40 – 120 keV, The et al. 1996) and RXTE (2 – 60 keV, Allen et al. 1997) observations. Above 10 keV, the spectrum of Cas A can be fitted a power-law model of the photon index (Allen et al. 1997). Suzaku observations of Cas A also detected the hard X-ray emission up to 40 keV (Maeda et al. 2009), whose spectrum from 3 – 40 keV can fitted with a thermal bremsstrahlung and a power-law model with a photon index of .
Hard X-ray observations on Cas A can also study the hard X-ray lines at 67.9 and 78.4 keV coming from the decays of radioactive 44Ti. 44Ti is a short-lived radioactive isotopes with a half life of 59 years (Admad et al. 2006). In theories, the most plausible cosmic environment for production of 44Ti is the -rich freeze-out from high-temperature burning near the nuclear statistical equilibrium (Woosley et al. 1973; Timmes et al. 1996). So 44Ti should be produced in supernova explosions. 44Ti gamma-rays reflect the current rate of supernovae (SNe) due to its short decay time scale, and probe the inner regions of core-collapse SNe. Its yield also depends on the type of SNe. Solar metallicity Type II and Type Ib supernova standard models indicate yields of 44Ti (e.g. Woosley & Weaver 1995; Rauscher et al. 2002; Limongi & Chieffi 2003).
There are three -ray lines which can be used to detect the decay of 44Ti: the 67.9 and 78.4 keV lines from the 44Sc de-excitation cascade and the 1157 keV line as 44Ca decays to its stable ground state. The three lines are emitted with efficiencies of at 67.9 keV, at 78.4 keV, and at 1157 keV. Analysis of COMPTEL data supported a 5 detection of 44Ti in Cas A at in the 1157 keV line (Iyudin et al. 1994). The OSSE observations also marginally detected the 44Ti signal in Cas A around 60 – 90 keV (The et al. 1996), giving a mean flux of for the two low energy lines. The BeppoSAX Phoswich Detector System (PDS) detection of the two blended hard X-ray lines at 67.9 and 78.4 keV gave a 44Ti flux of (Vink et al. 2001). Early INTEGRAL/IBIS observations detected two hard X-ray lines, and determined the 44Ti flux of only using IBIS data, and an average flux of by combining COMPTEL, BeppoSAX PDS and IBIS measurements (Renaud et al. 2006). Recent imaging observations of 44Ti in Cas A by NuStar suggested the asymmetry in this core-collapse supernova (Grefenstette et al. 2014), and the reported line flux at 68 keV is about . The detected 44Ti flux deduced a yield range of in Cas A, which is higher than the 44Ti yields predicted by simulations of the standard spherical explosion models. This leaves the 44Ti observations from Cas A as a puzzle, requesting further studies.
In this work, we collect all the available INTEGRAL observations around Cas A at present to carry out analysis. More observational data compared with previous work will help to search for the non-thermal hard X-ray emission above 100 keV. With a broad energy band spectrum of Cas A, we can constrain the hard X-ray spectral properties for the non-thermal continuum. Then the hard X-ray line fluxes of 44Ti will be measured with a better continuum fit. In the following section, the INTEGRAL observations and data analysis will be briefly described. The hard X-ray spectral properties and 44Ti line features will be studied in §3. Finally, in §4 discussion on our results will be presented, specially, the implications of non-thermal emissions above 100 keV in Cas A will be discussed. We draw a brief conclusion in §5.
2 INTEGRAL Observations and data analysis
Main scientific objects of the INTEGRAL satellite include the nucleosynthesis via detection and fine spectroscopy of nearby supernova remnants (Winkler et al. 2003). Thus since its launch in 2002, INTEGRAL carried out the frequent pointing observations around the Cassiopeia region. In this work, we use the available archival data for the INTEGRAL observations where Cas A is within degrees of the pointing direction. The INTEGRAL observations showed a long-term frequent monitoring on Cas A from 2003 – 2012. The total pointing observations have about 3000 science windows (duration of each science window is about 2000 s). The archival data used in our work are available from the INTEGRAL Science Data Center (ISDC). The analysis is done with the standard INTEGRAL off-line scientific analysis (OSA, Goldwurm et al. 2003) software, ver. 10.
We mainly use the observational data obtained by the INTEGRAL Soft Gamma-Ray Imager (IBIS-ISGRI, Lebrun et al. 2003) which views the sky through a coded aperture mask. IBIS/ISGRI has a 12’ (FWHM) angular resolution and arcmin source location accuracy in the energy band of 15 – 500 keV. The total on-source time of IBIS/ISGRI obtained in our analysis is about 6.8 Ms after excluding the bad data due to solar flares and the INTEGRAL orbital phase near the radiation belt of the Earth. JEM-X aboard INTEGRAL is the small X-ray telescope (Lund et al. 2003) which can be used to constrain the continuum spectrum below 30 keV combined with IBIS. JEM-X has a small field of view, which can only detect the source with the off-source angle below . The total observational time obtained by JEM-X is only about Ms.
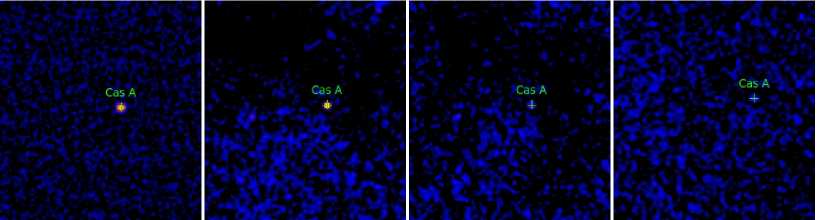
Individual pointings in collected IBIS and JEM-X data processed with OSA 10 were mosaicked to create the sky images for the source detection in the given energy ranges. In Fig. 1, the sky images in four energy bands obtained by JEM-X and IBIS are displayed. JEM-X detected Cas A in the range of 3 – 10 keV with a significance level of . For the higher energy ranges, IBIS detected Cas A with the significance levels of , and in three energy bands: 20 – 60 keV, 60 – 90 keV and 90 – 200 keV, respectively.
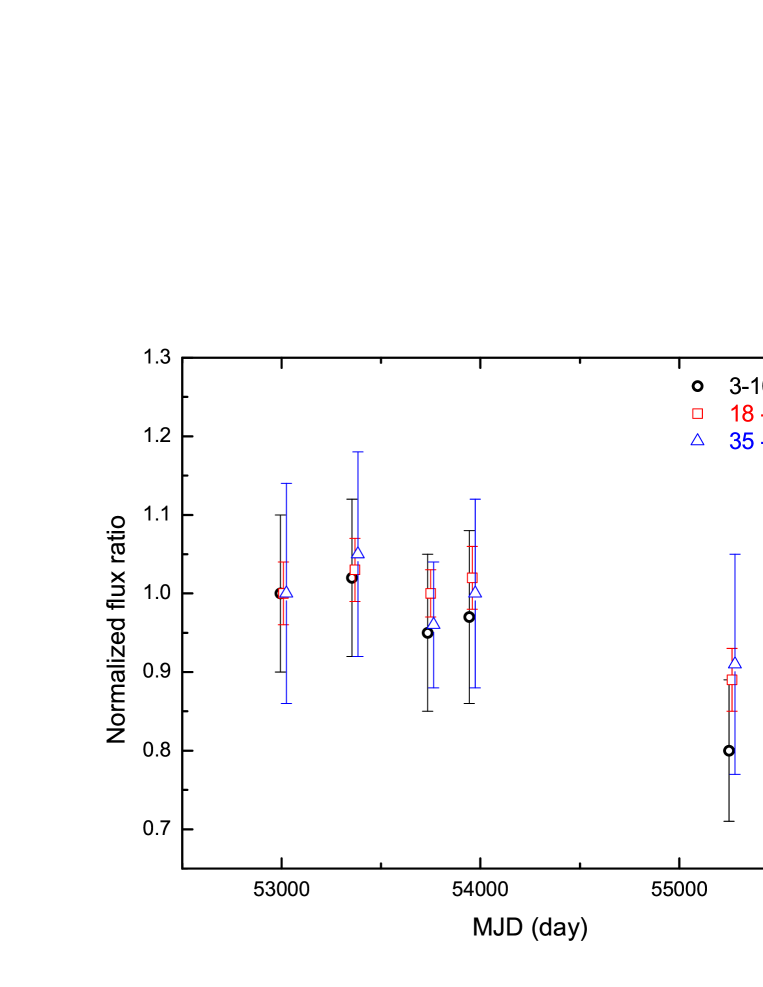
In addition, we also studied hard X-ray flux variation of Cas A from 2003 – 2011 detected by the INTEGRAL missions. In Fig. 2, The normalized hard X-ray flux of Cas A versus observed time is presented in three energy bands: 3 – 10 keV; 18 – 35 keV and 35 – 60 keV. The hard X-ray fluxes show no significant changes (within ) over nearly ten years. Though large error bars exist, there still may exist differences in flux variations among three energy ranges. In low energy band of 3 – 10 keV, the flux in 2009 – 2012 reduced to about 80 of that in 2003; while in high energy bands of 18 – 35 keV and 35 – 60 keV, the average changes of fluxes in two time intervals are generally blow . So that the higher hard X-ray emissions in Cas A might decrease slowly relative to the lower X-ray bands.
3 Hard X-ray spectral properties of Cas A
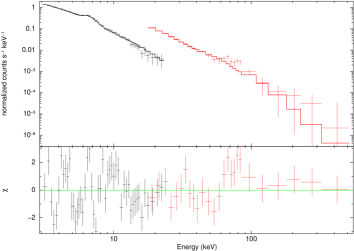
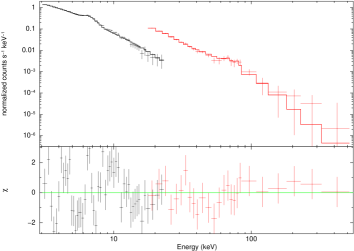
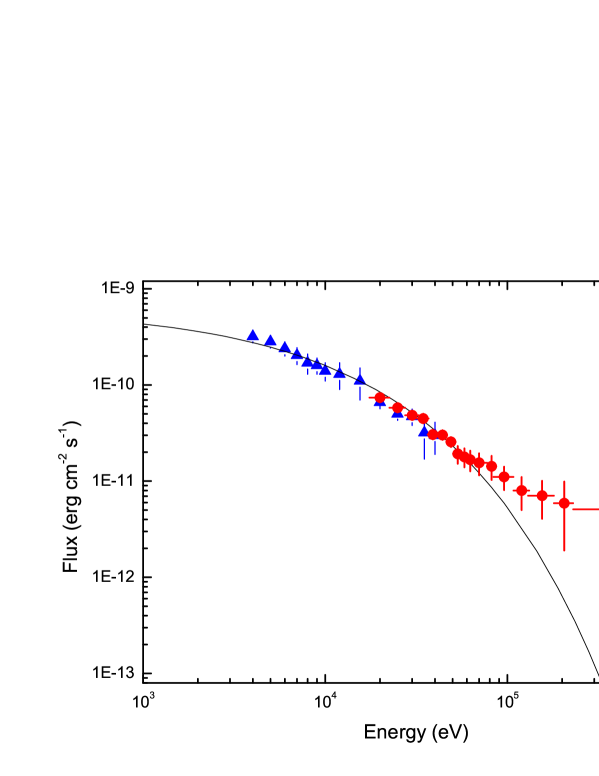
In this section, we analyzed the overall spectrum from 3 – 500 keV of Cas A with all available data. In Fig. 3, the extracted hard X-ray spectra from 3 – 35 keV obtained by JEM-X and 18 – 500 keV by IBIS are shown. Generally, the X-ray radiation from young supernova remnant Cas A should include both thermal emission component and non-thermal emission component. We have tried different continuum spectral models to fit the data, then checked which model can best fit the INTEGRAL data. In addition, if this count rate spectrum is only fitted by a simple power-law model (with ), three line features can be clearly found in the residuals: strong Fe K line around 6.5 keV; two hard X-ray lines at and 78 keV attributed to the decay of 44Ti. Thus, we showed the fitted reduced values (Table 1) by using four continuum models plus the iron line at 6.5 keV: a simple power-law model; a thermal bremsstrahlung plus a power-law model; a cool thermal bremsstrahlung plus a hot bremsstrahlung; a thermal bremsstrahlung plus an exponential decay. Comparing the different fitted reduced results in Table 1, the thermal bremsstrahlung plus a power-law model gave a best fit to the INTEGRAL data, and the other continuum models can be rejected with much larger reduced .
| Model | Reduced |
|---|---|
| simple power-law model iron line | 5.3811/69 |
| thermal bremsstrahlung plus a power-law model iron line | 2.1960/67 |
| a cool thermal bremsstrahlung plus a hot bremsstrahlung iron line | 5.7856/67 |
| thermal bremsstrahlung plus an exponential iron line | 6.1651/67 |
Then the hard X-ray continuum was fitted with a thermal bremsstrahlung plus a power-law model, giving keV and . The thermal emission component fraction is about at 3 keV, and at 4 keV. The iron line feature around 6.5 keV was fitted with a Gaussian line profile. We found a line centroid energy of keV, with a line width of keV, and a line flux of ph cm-2 s-1. The derived line parameters of the Fe K feature are well consistent with those obtained by Suzaku observations (Maeda et al. 2009). The power-law index of above 10 keV derived from the INTEGRAL data is consistent with the previous measurements by OSSE (The et al. 1996), RXTE (Allen et al. 1997), BeppoSAX (Favata et al. 1997), Suzaku (Maeda et al. 2009) and early INTEGRAL/IBIS data (Renaud et al. 2006).
In the top panel of Fig. 3, the spectrum was fitted with the continuum model with a thermal bremsstrahlung plus a power-law model, and an Fe K line at keV. Two emission line features at and 78 keV appear obviously in the residuals. In the bottom panel of Fig. 3, we fitted the spectrum with a thermal bremsstrahlung plus a power-law model, and three gaussian line profiles: the Fe K line, and two 44Ti decaying lines. For the two hard X-ray lines of 44Ti, we have fixed their energies at and 78.4 keV respectively in the fittings, and the line width is set to be zero due to the low spectral resolution of IBIS/ISGRI around 70 keV (). In addition, since the flux of the line at 67.9 keV is about of that of 78.4 keV, to improve the statistical significance of hard X-ray line detection, we also fix the line flux ratio during the fitting: . The best fitted spectral parameters by fitting the overall spectrum from 3 – 500 keV of Cas A are presented in Table 2. The average line flux of 44Ti lines is determined at ph cm-2 s-1 according to the present measurements. The measured 44Ti line flux range is well consistent with the previous BeppoSAX (Vink et al. 2001) and IBIS (Renaud et al. 2006) measurements, and still lower than the COMPTEL results (Iyudin et al. 1994).
| Continuum | ||
| Thermal bremsstrahlung | Power law | |
| (keV) | Flux (3 – 200 keV, erg cm-2 s-1) | |
| 0.81 | 3.13 | 6.3 |
| Fe K line | ||
| Energy (keV) | Width (keV) | Flux (10-3 ph cm-2 s-1) |
| 6.61 | 4.7 | |
| 44Ti lines | ||
| Energy (keV) | Width (keV) | Flux (10-5 ph cm-2 s-1) |
| 67.9 (fixed) | 0(fixed) | 0.93 |
| 78.4 (fixed) | 0(fixed) | 2.2 |
| Reduced () | 1.389 (66) |
Previous observations detected the non-thermal hard X-ray emissions in Cas A up to 100 keV by OSSE (The et al. 1996), RXTE (Allen et al. 1997), BeppoSAX (Favata et al. 1997), Suzaku (Maeda et al. 2009) and early INTEGRAL/IBIS data (Renaud et al. 2006). These previous detections showed that the hard X-ray emission of Cas A from 10 - 100 keV can be described by a power-law model of or a hot bremsstrahlung model ( keV). With accumulating nearly ten years of INTEGRAL data, we first detected the non-thermal X-ray emission extended to keV from Cas A (see Fig. 3). This non-thermal emission from 10 – 220 keV is well consistent with a simple power-law of the photon index . No spectral cutoff is detected in hard X-ray bands. The hot bremsstrahlung model is rejected by the new INTEGRAL data (also see Table 1). The derived non-thermal continuum flux from 3 – 200 keV is erg cm-2 s-1 from Cas A (the power-law component), corresponding to a hard X-ray luminosity of erg s-1 assuming a distance of 3.4 kpc.
4 Discussion
4.1 44Ti yield in Cas A
With the measured hard X-ray line flux at 78 keV, the 44Ti yield in Cas A can be estimated as , where kpc is the distance of Cas A, , the proton mass, yr, the characteristic time of the 44Ti decay chain, yr, the time since the explosion. The derived 44Ti yield in Cas A is .
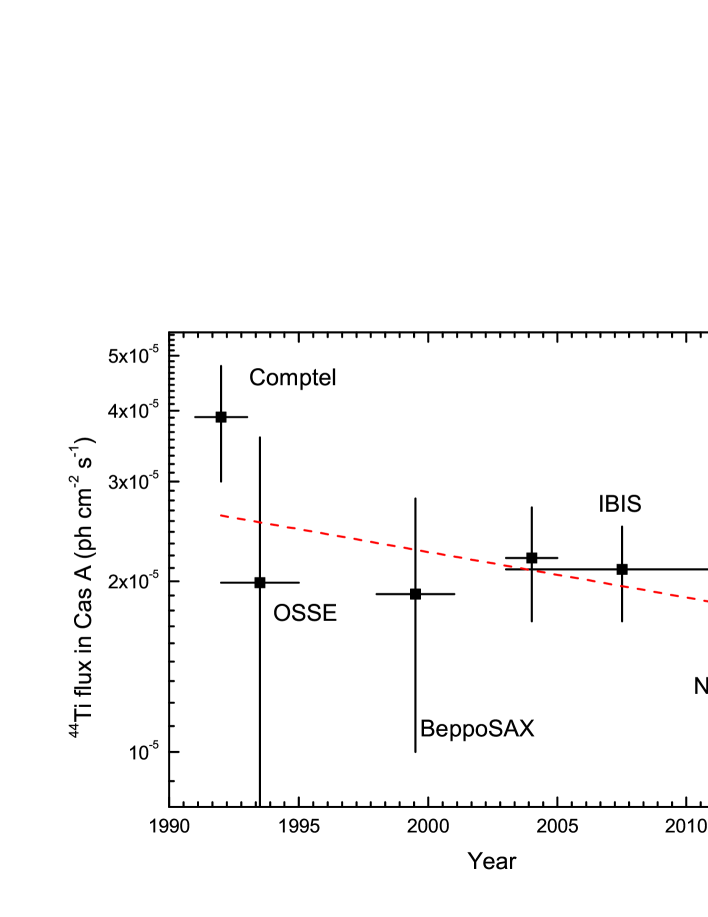
In the past twenty years, the measurements of three 44Ti lines in Cas A have been carried out by different missions. Here we collected all these reported 44Ti line fluxes together in Fig. 4. For the comparison in the fluxes by different measurements, we normalize the flux values to the flux levels at the 78 keV line, then reduce the COMPTEL flux around the 1157 keV line by , and increase the NuStar flux at the 68 keV line by . The observed 44Ti line flux decreased in the last twenty years, as expected for the decaying feature of the unstable 44Ti isotope. In Fig. 4, we also plotted the possible decaying curve of the 44Ti line flux in Cas A (red dashed line) by assuming that the initial 44Ti yield in Cas A is about , the explosion date is around AD 1671 (Thorstensen et al. 2001) with the distance of 3.4 kpc (Reed et al. 1995) and the half life of 44Ti decay chain at 59 years (Admad et al. 2006). The observed data points are generally consistent with the decaying curve, except that the COMPTEL data point is still above the curve. The 1157 keV from excited 44Ca∗ may have an additional nuclear de-excitation component originating from accelerated particles colliding with 44Ca∗ in the supernova remnant and swept-up interstellar medium (Siegert et al. 2015). However, the low energy lines at 68 and 78 keV come from the decay of the isotope 44Sc. 44Sc is short-lived, then no corresponding excitation of 44Sc will occur through such a cosmic ray process.
Generally people accepted that Cas A was formed by the explosion of a massive star progenitor (possible type Ib), a 16 single star (Chevalier & Oishi 2003) to a Wolf-Rayet (WR) remnant of a very massive ( ) precursor (Fesen & Becker 1991). The standard spherical explosion models (e.g., Woosley & Weaver 1995; Limongi & Chieffi 2003) predict the 44Ti yield below , which contradicts with the observational constraints. Since in the standard models of core-collapse supernova explosions, 44Ti and 56Ni are co-produced during the first stages of the explosion, the high 44Ti may require that Cas A should be brighter due to a larger product of 56Ni. There exist some indications that its explosion energy was about ergs (Laming & Hwang 2003), higher than the canonical value of ergs. The other possibility is that the explosion of Cas A could be intrinsically asymmetric. And the sensitivity of the 44Ti production to the explosion energy and asymmetries (Nagataki et al. 1998) may explain the higher 44Ti/56Ni ratio compared to standard spherical explosion models. This asymmetric explosion scenario is also supported by some observational evidence in the X-ray emitting ejecta of Cas A (Vink 2004; Hwang et al. 2004; Hwang & Laming 2012). The recent direct imaging observations of the 44Ti emission in Cas A suggested an intermediate asymmetry in this core-collapse supernova (Grefenstette et al. 2014): the 44Ti is extended along the jet axis seen in X-rays (Hwang et al. 2004). Therefore Cas A may be a very special case of supernova explosions in the Galaxy, and produced by an asymmetric and/or a relatively more energetic explosion.
4.2 Non-thermal power-law emission up to 220 keV in Cas A
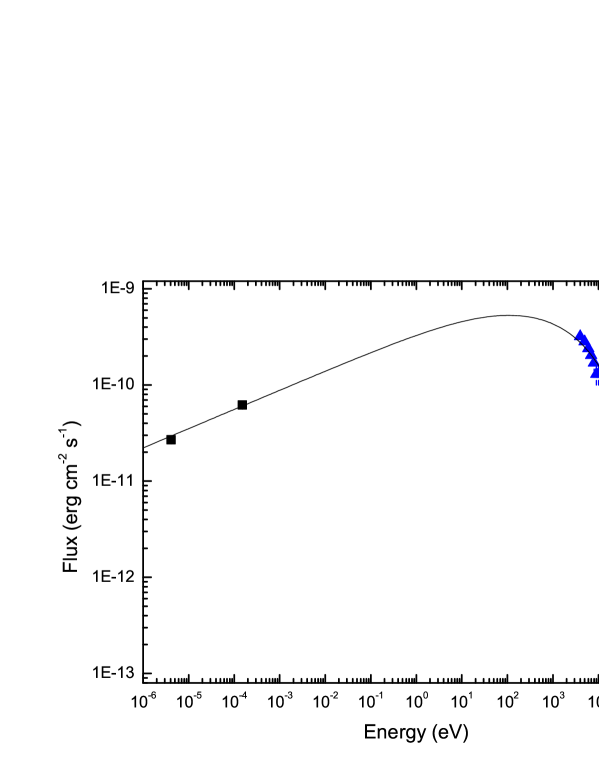
The non-thermal emissions from radio to X-ray bands in supernova remnants are generally believed to be produced by the synchrotron radiation of relativistic electrons accelerated in the remnant shocks. Based on the diffusive shock acceleration (DSA) theory, the produced synchrotron radiation spectrum shows a cutoff energy around a few keV. The present observed hard X-ray emission by IBIS in Cas A has a cutoff around a few keV, but the emission beyond the cutoff energy shows a power-law extended up to 220 keV, which is inconsistent with the DSA models. Recently Zirakashvili & Aharonian (2007; 2010) investigated the spectral shape of the shock-accelerated electrons subject to synchrotron cooling in the context of DSA theory, then they provided useful approximations for the subsequent synchrotron spectral shape, which is a slowly decreasing function other than sharp cutoff. We use this approximation (eq. 37 in Zirakashvili & Aharonian 2007) to fit the data points from the radio to hard X-ray bands observed in Cas A (see Fig. 5). This slow function can well fit the data points from radio to X-ray bands up to 70 keV, however, the data points above 80 keV derived by IBIS cannot be described by the approximation. Indeed the slower decrease at higher energy band (hinted in Fig. 2) may suggest the hardening spectral component at high energy.
What is the physical origin of the non-thermal emission from 80 – 220 keV? Cas A is thought to be produced by a type II explosion, then after the explosion, a neutron star or black hole should be left in the center. In the center of the remnant, a compact source is discovered in the first light observations of Chandra X-ray Observatory (Tanabraum 1999). Further deep observations find the spectrum of the point source in the band of 0.5– 5 keV can be well fitted by a black body of keV (Pavlov et al. 2000; Chakrabarty et al. 2001), which is consistent with the standard neutron star cooling. This spectrum is also explained by the fallback accretion model into a neutron star or a black hole. If we assume the compact object could be a young normal pulsar, the power-law fit can obtain a photon index of (Pavlov et al. 2000; Chakrabarty et al. 2001) which is much softer than other known young pulsars (). Could the possible hard X-ray emission from the compact object explain the observed hard X-ray flux?
Thermal radiation models from the neutron star cooling or fallback accretion cannot produce the non-thermal emission above 80 keV, so we only consider the possible origin of an active pulsar for the point source in Cas A. The soft X-ray flux of the point source in Cas A is very weak, with erg cm-2 s-1 in the range of 1– 5 keV (Pavlov et al. 2000; Chakrabarty et al. 2001). If the source has a power-law emission with the photon index of , the hard X-ray flux attributed by the pulsar candidate is only at the level of erg cm-2 s-1 above 80 keV, much lower than the total observed flux in Cas A. The pulsar component could not significantly contribute to the non-thermal emission above 80 keV, except that we assume the photon index of non-thermal emission from the pulsar candidate in Cas A changing from 3 below 5 keV to around 1 above 10 keV. However, the hard spectrum of the photon index around 1 is not consistent with the observed non-thermal emission above 80 keV. In addition, NuStar has not detected the compact source in the range of 3 – 79 keV (Grefenstette et al. 2014), suggesting that the compact source cannot become brighter above 5 keV.
Thus, the compact source will not contribute to the non-thermal emission from 80 – 220 keV significantly. In the following part, we assume that the emission is due to synchrotron radiation from the remnant shock, and discuss the requirement for producing 100-keV emission.
The acceleration of electrons in the remnant shock suffers from radiative energy loss. The maximum synchrotron photon energy where the electron acceleration and synchrotron cooling times are equal is (e.g., Katz & Waxman 2006), where is the ratio of the diffusion coefficient to the Bohm diffusion one, and is the shock velocity. As the bulk velocity of the shock in Cas A is (e.g., Fesen et al. 2006; Grefenstette et al. 2014), the cutoff energy is at a few keV for the Bohm limit . The Cas A spectrum is consistent with a turnover around a few keV. However, by the DSA theory the spectrum beyond the cutoff is an exponential decay (e.g., Zirakashvili & Aharonian 2007), inconsistent with our result at keV. Since the acceleration is not expected to be faster than Bohm limit (), the 100-keV emission cannot be produced by the bulk remnant shock of Cas A.
One may argue that the postshock magnetic field may not be uniform. There may be stronger magnetic field distributed in smaller spatial region. Thus, when the electrons are sampling the high magnetic field region they emit higher energy synchrotron photons. Since the synchrotron photon frequency goes with magnetic field as , the keV emission compared to a few keV cutoff needs a magnetic field contrast of times, which may be too large to imagine. The other option is that the magnetic field increases downstream with the distance away from the shock front, so that electrons may produce higher energy photons when flowing downstream. But so far there is no support from theory and observation for magnetic field increasing downstream.
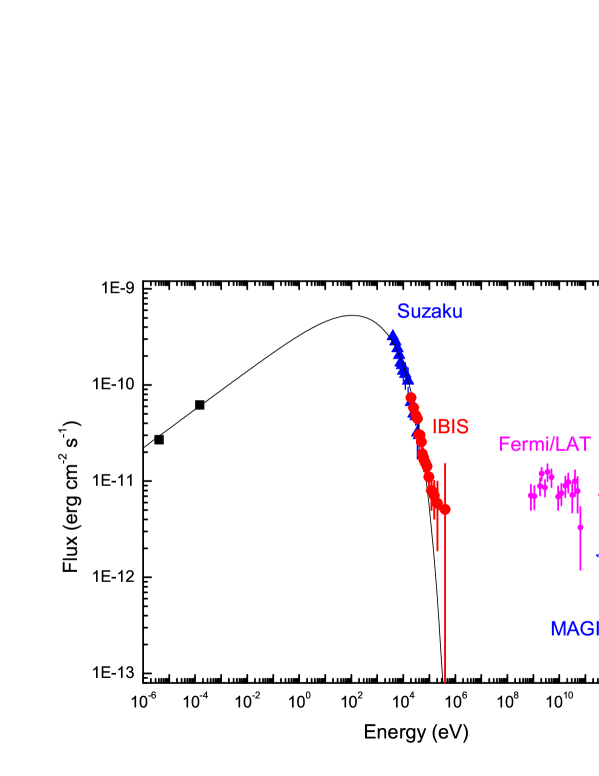
One may also expect that if the relativistic electrons that are responsible to the 100-keV synchrotron emission is not produced by shock acceleration, then it is possible to avoid the limit to the synchrotron photon energy. A possible high energy electron origin is the hadronic process that the shock-accelerated cosmic rays interact with the background medium and produce pions which decay quickly into secondary electrons (or positrons), as well as neutrinos and photons, i.e., , and . Because of the connection between the secondary electrons and photons, there should be also a connection between the secondary photons and the electrons-emitted synchrotron radiation. Because the produced ’s, ’s, and ’s have similar numbers and energy, and the secondaries approximately share the primary energy, we have , , and hence . Since the synchrotron photon energy is and the electrons rapidly lose energy by synchrotron radiation, we have . For the 100-keV synchrotron radiation the corresponding secondary photon energy is PeV. In the broad band spectrum of Cas A (Fig. 6), the 10-TeV flux is already more than one order of magnitude smaller than the 100-keV flux, . Since the spectrum decays fast beyond TeV, the PeV flux is even lower. So the radiation at 100 keV is impossible to be of secondary electron origin.
4.2.1 Asymmetrical supernova explosion?
A possible model for the hard X-ray emission may be asymmetrical explosion where the ejecta velocity is angularly dependent, and the 100-keV emission can be produced by the highest velocity ejecta. For the emission cutoff to reach keV, the required ejecta velocity is about with . Let us estimate the angular distribution of the ejecta velocity that can produce the observational high energy X-ray emission. Assume the solid angle of ejecta with velocity follows a power law of . We derive the index below.
Consider an area element in the shock surface with a solid angle of , velocity , and radius of with the supernova age. The number of swept-up medium electrons is . The electrons are accelerated and follow a power law distribution, (). The postshock magnetic field and minimum electron Lorentz factor are ( is the medium density), and , respectively, and the cutoff frequency is . Denote the synchrotron frequency that is emitted by electrons with cooling timescale equal to the supernova age. Because , the synchrotron flux at the cutoff frequency is (Sari et al. 1998)
Here the characteristic frequencies are and (Sari et al. 1998), and the peak flux is . Inserting these scaling into the above equation, we have Taking , we have the spectrum
and If the observed spectrum shows a photon index , then In Cas A, , and , then we derive .
Assume axis-symmetrical explosion, (if ), then , or . For , the velocity profile is
In Cas A, the bulk ejecta with lowest velocity have and km s-1, then the ejecta with velocity contain an angle of .
The shock radius should roughly follows the velocity profile, . It should be noted that there is a “jet” observed in Cas A, with opening angle , and transverse expansion velocity km s-1 (Fesen et al.2006), that is consistent with the requirement to explain the photon index of the 100-keV emission. Because of the projection effect the true velocity should be larger than the measured transverse velocity, and may reach to produce the 100-keV emission.
5 Conclusion and summary
Cas A is studied with the near ten-year data of INTEGRAL observations. We first detect the non-thermal hard X-ray continuum from Cas A up to 220 keV. The spectrum of Cas A from 3 – 500 keV is derived by the INTEGRAL/JEM-X and IBIS telescopes. The broad-band continuum spectrum can be fitted with a thermal component with a thermal bremsstrahlung model of keV plus a power-law model of . The Fe line is detected with the centroid energy of keV, a line width of keV, and a line flux of ph cm-2 s-1. The 44Ti emission lines at 68 and 78 keV are confirmed by our observations. The 44Ti lines are detected with a significance level of . The mean 44Ti line flux at 78 keV is ph cm-2 s-1 which is consistent with the previous measurements. The derived 44Ti yield from the explosion of Cas A is according to the present measurements.
Cas A is detected in hard X-ray bands up to 220 keV. In addition, the spectrum from 20 – 220 keV shows a single power-law feature without cutoff. This spectral feature (specially non-thermal emission above 80 keV) is inconsistent with the present DSA models. The central compact object in Cas A could not contribute to the non-thermal hard X-ray emission significantly. This non-thermal component above 80 keV should come from the synchrotron radiation in the shock of the remnant. We have discussed the possible physical origin of the non-thermal emission above 100 keV from the shock waves. There may exist a higher magnetic field in some small region in the remnant or the magnetic field might increase downstream with the distance away from the shock front. However, there is no support from theory and observations for the magnetic field spatial variation by a large contrast of tens of times in the supernova remnants. The other possible contribution comes from synchrotron radiation of the secondary relativistic electrons which originate in hadronic process, but this component is about one order of magnitude lower than the observed hard X-ray flux in Cas A. Finally we discuss the radiation from the asymmetrical supernova explosion which is also supported by the 44Ti observations in Cas A. If the fastest ejecta have a velocity of and contain an angle of , their synchrotron radiation can produce the non-thermal emission around 100 keV and explains the observed spectral index. This is consistent with the other observation that shows a “jet” in Cas A.
References
- (1) Abdo, A.A. et al. 2010, ApJ, 710, 92
- (2) Admad, I. et al. 2006, Phys. Rev. C. 74, 065803
- (3) Aharonian, F., et al. 2001, A&A, 370, 112
- (4) Aharonian, F. A., et al. 2004, Nature, 432, 75
- (5) Albert, J., et al. 2007, A&A, 474, 937
- (6) Allen, G. E., et al. 1997, ApJL, 487, L97
- (7) Artyukh, V. S., Vitkevich, V. .V. & Dagkesamanski, R. D. 1967, Astron. Zh., 44, 984
- (8) Chakrabarty, Deepto; Pivovaroff, Michael J.; Hernquist, Lars E.; Heyl, Jeremy S.; Narayan, Ramesh 2001, ApJ, 548, 800
- (9) Chevalier, R. A., & Oishi, J. 2003, ApJ, 593, L23
- (10) Favata, F. et al. 1997, A&A, 324, L49
- (11) Fesen, R. A., & Becker, R. H. 1991, ApJ, 371, 621
- (12) Fesen, R. A., Hammell, M. C., Morse, J., et al. 2006, ApJ, 645, 283
- (13) Goldwurm, A., et al. 2003, A&A, 411, L223
- (14) Grefenstette, B. W. et al. 2014, Nature, 506, 339
- (15) Humensky, T. B. 2008, in American Institute of Physics Conference Series, American Institute of Physics Conference Series (ed. F. A. Aharonian, W. Hofmann, & F. Rieger), 1085, 357
- (16) Hwang, U., et al. 2004, ApJ, 615, L117
- (17) Hwang, U. & Laming, J. M. 2012, ApJ, 746, 130
- (18) Iyudin, A. F., et al. 1994, A&A, 284, L1
- Katz & Waxman (2008) Katz, B., & Waxman, E. 2008, J. Cosmology Astropart. Phys, 1, 18
- (20) Koyama, K., Petre, R., Gotthelf, E. V., Hwang, U., Matsuura, M., Ozaki, M., Holt, S. S. 1995, Nature, 378, 255
- (21) Laming, J. M., & Hwang, U. 2003, ApJ, 597, 347
- (22) Lebrun, F., et al. 2003, A&A, 411, L141
- (23) Limongi, M., & Chieffi, A. 2003, ApJ, 592, 404
- (24) Lund, N. et al., 2003, A&A, 411, L231
- (25) Maeda, Y. et al. 2009, PASJ, 61, 1217
- (26) Nagataki, S., Hashimoto, M., Sato, K., Yamada, S., & Mochizuki, Y. 1998, ApJ, 492, L45
- (27) Pavlov, G. G.; Zavlin, V. E.; Aschenbach, B.; Trümper, J.; Sanwal, D 2000, ApJ, 531, L53
- (28) Rauscher, T., et al. 2002, ApJ, 576, 323
- (29) Reed, J.E. et al. 1995, ApJ, 440, 706
- (30) Renaud, M. et al., 2006, ApJL, 647, L41
- Sari et al. (1998) Sari, R., Piran, T., & Narayan, R. 1998, ApJ, 497, L17
- (32) Siegert, T. et al. 2015, A&A, 579, 124
- (33) Tananbaum, H. 1999, IAU Circ., No. 7246, 1
- (34) The, L.-S. et al. 1996, A&AS, 120, 357
- (35) Thorstensen, J.R., Fesen, R. A. & van den Bergh, S. 2001, ApJ, 122, 297
- (36) Timmes, F. X., Woosley, S. E., Hartmann, D. H., & Hoffman, R. D. 1996, ApJ, 464, 332
- (37) Vink, J. et al. 2001, ApJ, 560, L79
- (38) Vink, J. 2004, New Astron. Rev., 48, 61
- (39) Winkler, C. et al., 2003, A&A, 411, L1
- (40) Woosley, S. E.; Arnett, W. D.; Clayton, D.D., 1973, ApJS, 26, 231
- (41) Woosley, S. E., & Weaver, T. A. 1995, ApJS, 101, 181
- (42) Yuan, Y. et al. 2013, ApJ, 779, 117
- Zirakashvili & Aharonian (2007) Zirakashvili, V. N., & Aharonian, F. 2007, A&A, 465, 695
- Zirakashvili & Aharonian (2010) Zirakashvili, V. N., & Aharonian, F. A. 2010, ApJ, 708, 965