Recommended Thermal Rate Coefficients for the C + H Reaction and Some Astrochemical Implications
Abstract
We have incorporated our experimentally derived thermal rate coefficients for C + H forming CH+ and CH into a commonly used astrochemical model. We find that the Arrhenius-Kooij equation typically used in chemical models does not accurately fit our data and use instead a more versatile fitting formula. At a temperature of 10 K and a density of 104 cm-3, we find no significant differences in the predicted chemical abundances, but at higher temperatures of 50, 100, and 300 K we find up to factor of 2 changes. Additionally, we find that the relatively small error on our thermal rate coefficients, , significantly reduces the uncertainties on the predicted abundances compared to those obtained using the currently implemented Langevin rate coefficient with its estimated factor of 2 uncertainty.
106 91, Sweden
1 Introduction
Interstellar astrochemistry is mostly organic in nature. Of the 194 molecules identified to date in the interstellar medium (ISM) and circumstellar shells, approximately three-quarters are carbon bearing (Müller et al., 2005). Formation of these molecules begins with atomic carbon becoming bound into hydrocarbons (van Dishoeck & Blake, 1998; Herbst & van Dishoeck, 2009). This represents one of the first links in the chain of astrochemical reactions leading to the synthesis of complex organic molecules (COMs). A key reaction in this network is the proton transfer process (Wakelam et al., 2012)
| (1) |
In dense clouds, the resulting CH+ is predicted to rapidly undergo sequential hydrogen abstraction with the abundant H2 in the cloud to form CH, which has been identified as a bottleneck species in the chain of reactions leading to the formation of interstellar COMs (Smith & Spanel, 1995).
Current astrochemical models use the Langevin rate coefficient for Reaction (1). However, our recent laboratory work has shown that the Langevin rate coefficient agrees poorly with the experimentally derived thermal rate coefficient (O’Connor et al., 2015). Similarly, calculations by Talbi et al. (1991) and Bettens & Collins (1998, 2001), using a combination of quantum mechanical potential energy surfaces and classical trajectories, do not agree with our experimental results for Reaction (1). Additionally, we find that the reaction
| (2) |
is open, despite the lack of its inclusion in current astrochemical databases. We also find poor agreement between our results for Reaction (2) and semi-classical calculations. Moreover, our rate coefficient for this channel is larger than that of Reaction (1) for temperatures below K. The resulting CH then undergoes hydrogen abstraction to form CH.
Reducing the uncertainty of the rate coefficient for Reaction (1) has been identified by Wakelam et al. (2009, 2010) as being critically important in order to more reliably predict the abundances for a large number of species observed in dense molecular clouds. Similarly, Vasyunin et al. (2008) has shown that the uncertainty in this rate coefficient hinders our ability to reliably predict chemical abundances in protoplanetary disks. Our recent laboratory studies have reduced the uncertainty on this reaction from a factor of 2 down to . Additionally, our work has demonstrated that Reaction (2) is open at molecular cloud temperatures and should be included in the chemical network.
In this paper, we explore the astrochemical impact of our new rate coefficients for Reactions (1) and (2). First, we have fit our experimentally derived thermal rate coefficients from O’Connor et al. (2015) for these reactions to a simple functional form. Using our results, combined with the KInetic Database for Astrochemistry (KIDA; Wakelam et al., 2015) and the gas-phase astrochemical code Nahoon (Wakelam et al., 2012), we have then investigated the impact of our new data on astrochemical models. Below, we briefly discuss the O’Connor et al. (2015) results in Section 2. We present the functional fits to the experimental data in Section 3. In Section 4, we briefly review the astrochemical model. Some astrochemical implications of our new thermal rate coefficients are discussed in Section 5, and a summary is presented in Section 6.
2 Experimental Work
O’Connor et al. (2015) and de Ruette et al. (2016), respectively, measured reactions between H, with an internal energy of K, and ground term atomic C and O, with the fine-structure levels statistically populated. In those works, we detail how we derived thermal rate coefficients from our data and discuss in detail their validity for astrochemical models.
To summarize those results for our carbon work, we found good agreement between our data and the mass-scaled results of Savic et al. (2005), who studied C with statistically populated fine-structure levels reacting with D with an internal energy of 77 K. Their work was carried out at a kinetic temperature of K. We found good agreement in the rate coefficients for both the CH+ and CH outgoing channels and for the sum of both channels. Additionally, in our oxygen work, we found good agreement between the thermal rate coefficient summed over both the OH+ and H2O+ outgoing channels compared to flow tube work at kinetic temperatures of K, which used H with a corresponding level of internal temperature (Fehsenfeld, 1976; Milligan & McEwan, 2000). We refer the reader to O’Connor et al. (2015) and de Ruette et al. (2016) for more details.
Clearly, the optimal laboratory situation would be experimentally derived thermal rate coefficients involving thermally populated levels in C and H. However, such measurements appear to be beyond current experimental capabilities. Reliable calculations also appear to be just beyond current capabilities of quantum mechanical approaches. For now, the results of O’Connor et al. (2015) represent the state of the art for Reactions (1) and (2). For the rest of this paper, we follow the standard practice of extrapolating state-of-the-art laboratory results to the temperatures needed for molecular cloud studies.
3 Fitting the Experimental Results
Astrochemical databases typically store thermal rate coefficients using the Arrhenius-Kooij formula
| (3) |
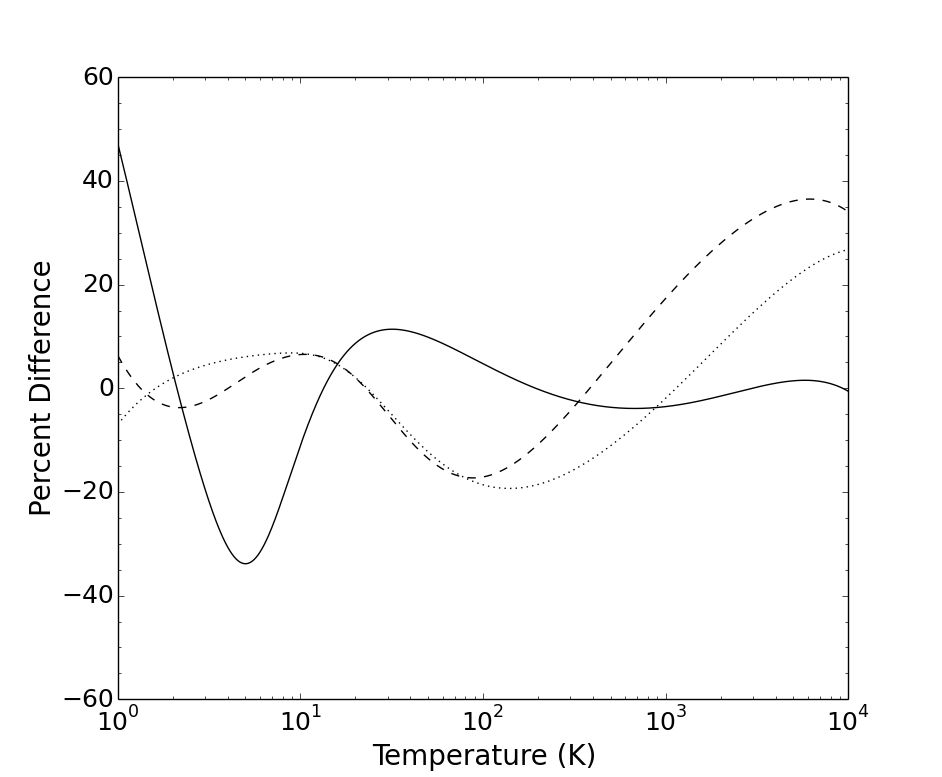
However, our experimentally derived thermal rate coefficients for Reactions (1) and (2) cannot be accurately reproduced by this formula. This can be seen in Figure 1, which presents the fit using Equation (3) to the O’Connor et al. (2015) data minus their actual data, normalized by their results (i.e., the normalized residuals). These findings continue the trend seen in merged-beams astrochemical studies that the Arrhenius-Kooij formula does a poor job in reproducing the experimentally derived rate coefficients for barrierless exoergic reactions, as has been seen for associative detachment (Kreckel et al., 2010), dissociative recombination (Novotný et al., 2013, 2014), and proton and H transfer reactions (de Ruette et al., 2016).
In the absence of any deep theoretical understanding of Reactions (1) and (2), it is not clear what fitting formula to use. We have opted to use the versatile fitting function recommended by Novotný et al. (2013) for astrochemical modeling, namely,
| (4) |
We have used this equation to fit the thermal rate coefficient data of O’Connor et al. (2015) for Reactions (1) and (2) to better than 1% over the K temperature range. The relevant fitting parameters are listed in Table 1. In that table, we also give a fitted rate coefficient for the sum of both channels.
4 Astrochemical Model
In order to study the impact of the experimentally derived thermal rate coefficients from O’Connor et al. (2015) on astrochemical models of dark molecular clouds, we have used the Nahoon code along with the kida.uva.2014 astrochemical database (Wakelam et al., 2012, 2015). The database currently contains 489 species and 7509 reactions. These include Reaction (1) but not Reaction (2). We have modified KIDA so that we can run the model using either our fitted rate coefficient data for both these channels or for the sum of these two channels.
The input parameters used were typical values for dark molecular clouds (Nummelin et al., 2000; Rodríguez-Fernández et al., 2010). For each run, the cosmic ray ionization rate was taken to be and the visual extinction was set to . The initial chemical abundances were taken from Wakelam et al. (2015), and are reproduced in Table 2. Each simulation used a fixed cloud temperature, , between 10 to 300 K and a fixed total number density of hydrogen nuclei, , in a range from to cm-3.
5 Astrochemical Implications
We first look at how the differences in the temperature dependence and magnitude of our rate coefficients relative to those of the Langevin rate coefficient affect predicted chemical abundances. Next, we investigate how the error reported in O’Connor et al. (2015) reduces the uncertainty in the predicted abundances compared to the uncertainties resulting from the estimated factor of 2 error in the Langevin value.
In order to test the sensitivity of our results to the experimentally derived branching ratio for forming CH+ or CH, we have run the model treating both reactions separately and with both reactions summed together. For the results presented below, we find no significant difference in the model output for either assumption. We attribute this to the high H2 abundance in the dark clouds, resulting in rapid hydrogen abstraction reactions.
5.1 Predicted Abundances
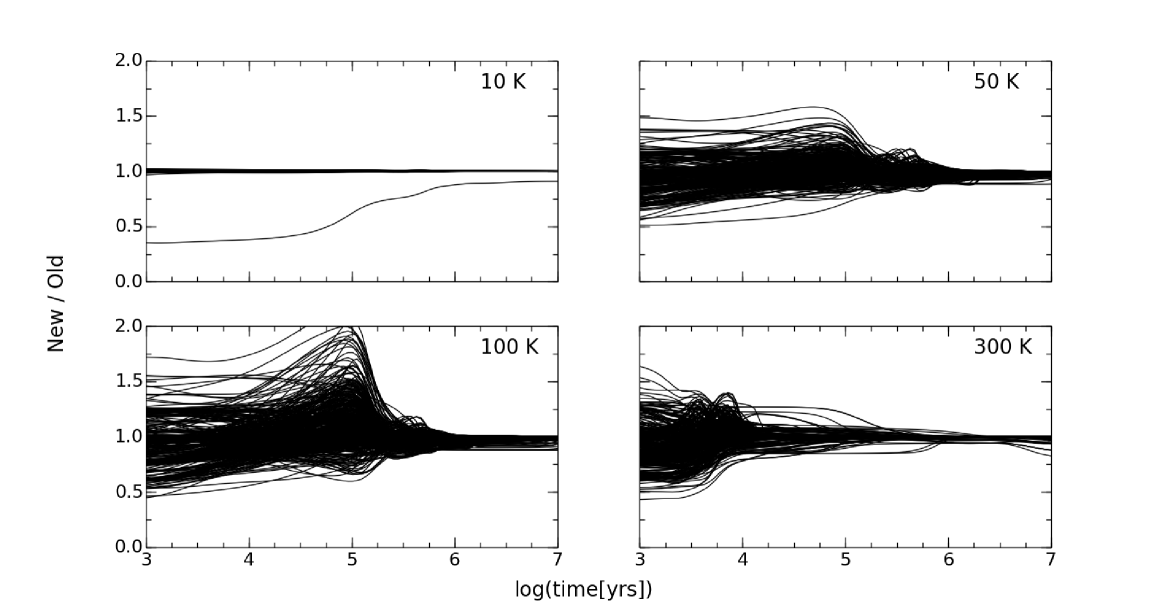
Figure 2 shows the fractional difference in the predicted abundances for all 489 species using our new rate coefficients relative to those from the unmodified model. Specifically, we have plotted the new abundances normalized by the old abundances. Calculations were carried out for = 104 cm-3 and = 10, 50, 100, and 300 K.
At 10 K, we find no significant differences except for CH+. The abundances of all other species are essentially unchanged because, as noted by O’Connor et al. (2015), any CH+ and CH formed rapidly undergo hydrogen abstraction, leading to CH, and the summed rate coefficient at 10 K for Reactions (1) and (2) is basically equal to the Langevin value currently used in the database for Reaction (1). Hence the absence of Reaction (2) in the databases appears not to be an issue at this temperature. The decreased abundance for CH+ in the new model is due to the decreased rate coefficient for Reaction (1). Naively, one would expect the CH abundance to increase due to the addition of Reaction (2) to the network. However, this is compensated for by a reduction in the hydrogen abstraction rate for CH+ forming CH due to the decreased CH+ abundance. Hence the CH abundance remains unchanged.
At 50 K, our summed rate coefficient is a factor of smaller than the Langevin value. For species that depend on the products of Reactions (1) and (2), this means their abundances decrease in the modified model using our data. Conversely, for species whose formation depends on C and H, the abundance of those species increases with the new model as C and H are destroyed less rapidly using our new rate coefficients. The new predicted abundances range from a factor of 2 smaller than the old to a factor of 1.5 larger; however, this spread decreases dramatically between and years. This appears to be due to a large increase in the abundance of O2 during this epoch, which enables the reaction
| (5) |
to become important. This leads to a dramatic decrease in the atomic C abundance, thereby reducing the importance of reactions (1) and (2).
At 100 K, the summed rate coefficient is smaller than the Langevin value, and this leads to correspondingly larger variations in the predicted abundances plotted in Figure 2. The new abundances range from a factor of 2 smaller to a factor of 2 larger. As before, these variations decrease dramatically between and years. This is again due to a large increase in the O2 abundance, an increase in the importance of Reaction (5), and an accompanying decrease in the C abundance.
At 300 K, the total rate coefficient is smaller than the Langevin value, leading to new abundances which range from a factor of 2 smaller than the old to a factor of 1.5 larger. Also, at this higher temperature a new set of chemical reactions become important, leading to a dramatic decrease in the atomic C abundance at around years. This decrease appears to be due, in large part, to an increase in the abundance of neutral hydrocarbons, which react with and incorporate much of the atomic C in the cloud. As a result of the decreased atomic C abundance, at this temperature, Reactions (1) and (2) are less important for cloud ages above years.
5.2 Abundance Uncertainties
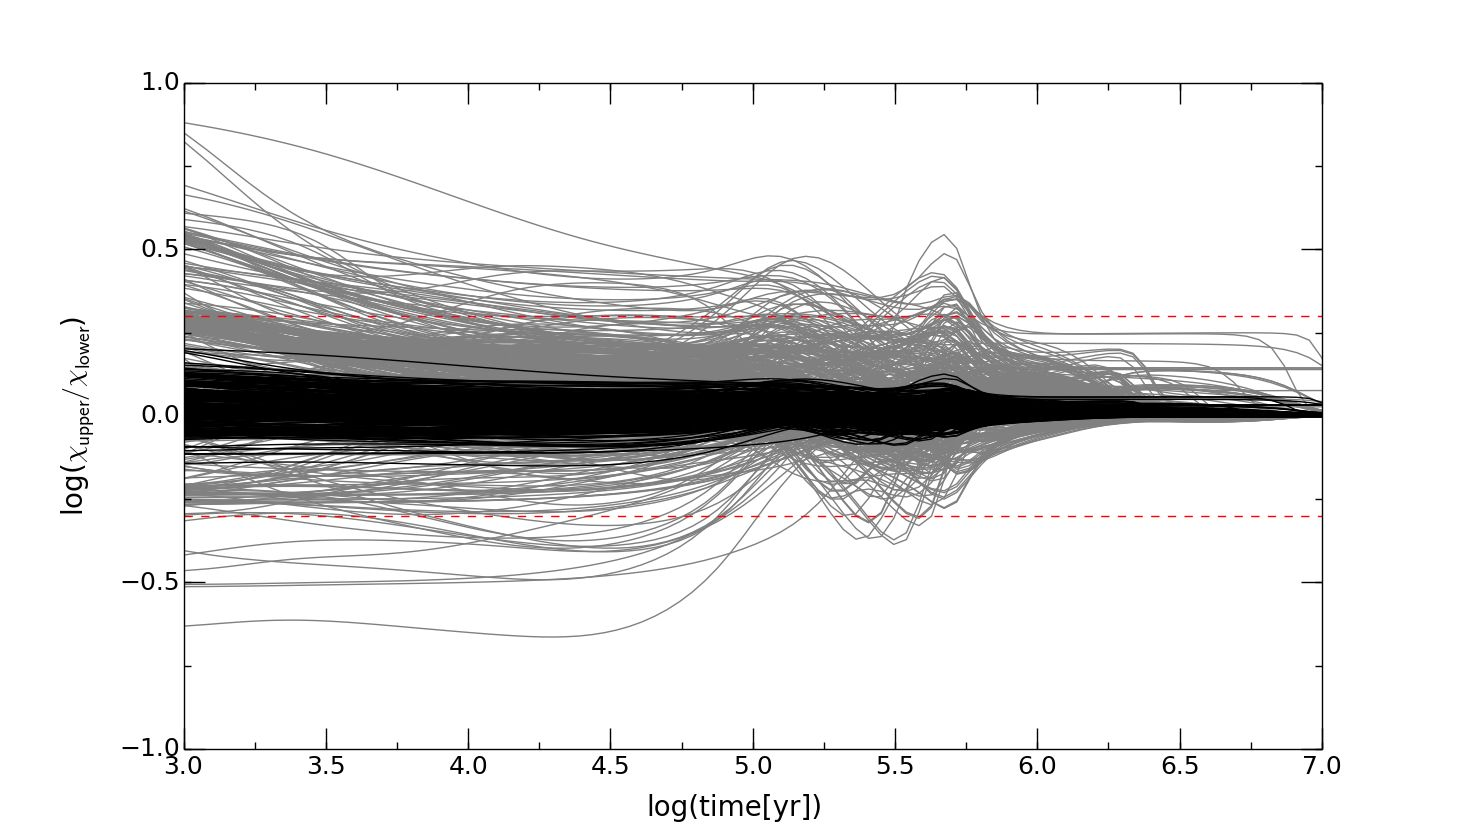
Langevin rate coefficients have estimated uncertainties of a factor of 2, though our previous work indicates that the actual uncertainties in Langevin rate coefficients may be even larger (Kreckel et al., 2010; O’Connor et al., 2015; de Ruette et al., 2016). O’Connor et al. (2015) report uncertainty factors of and for their experimentally derived thermal rate coefficients for Reactions (1) and (2), respectively. To track the resulting decrease of uncertainty throughout the network, we first ran the model using the Langevin rate coefficient at the upper limit of the estimated factor of 2 uncertainty, and then at the lower limit of its uncertainty. For each species, the abundances from those runs ( and , respectively) were obtained as a function of time. The difference of the logarithms of the two abundances, , was used as a heuristic for the level of uncertainty in the predicted abundances. Then, we replaced the Langevin value with our new coefficients and ran the model again using the new upper and lower uncertainty limits. By tracking the uncertainty statistic for the old and new models, we were able to track the reduction in the abundance uncertainties throughout the network.
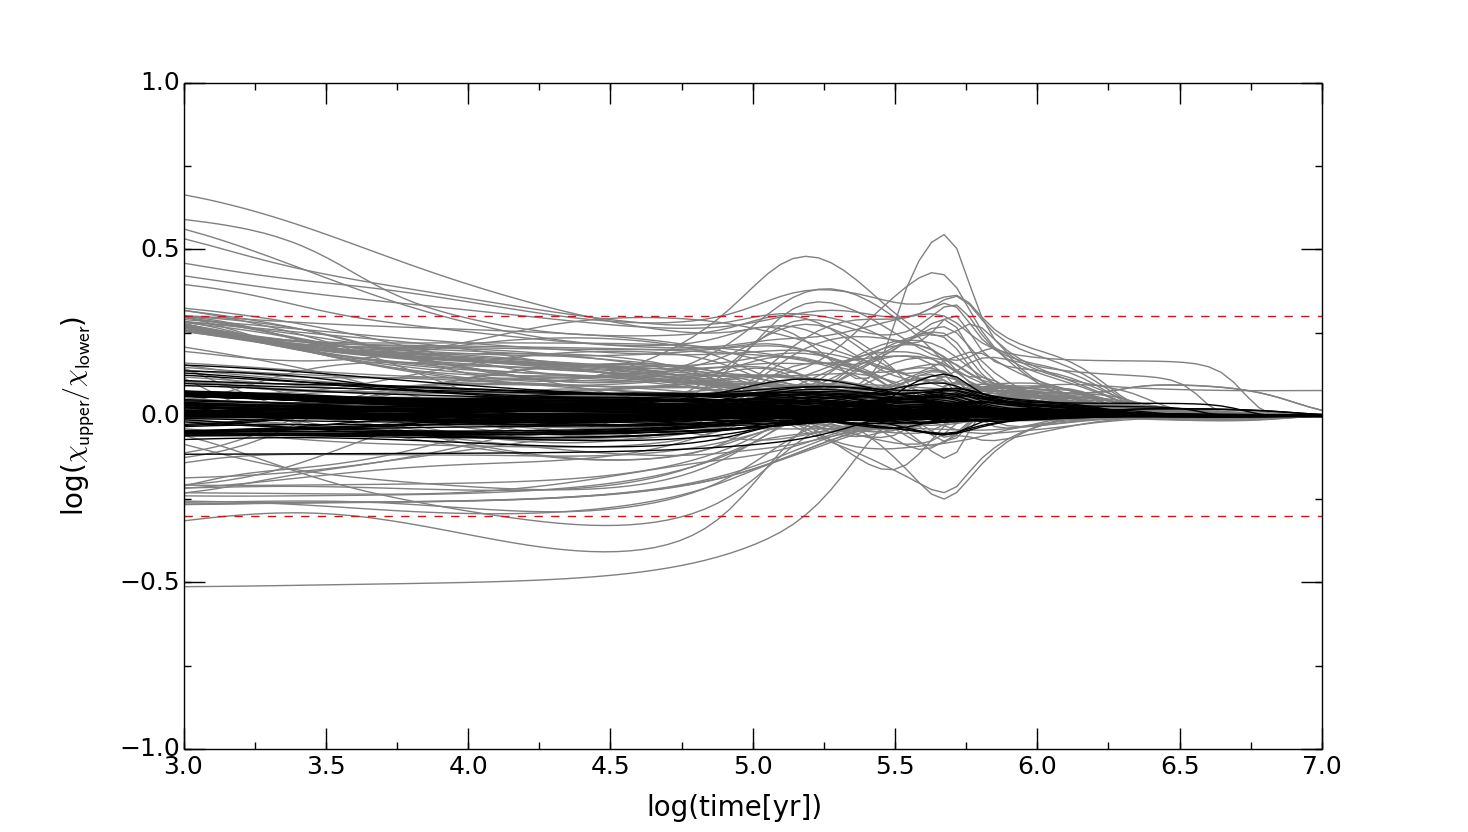
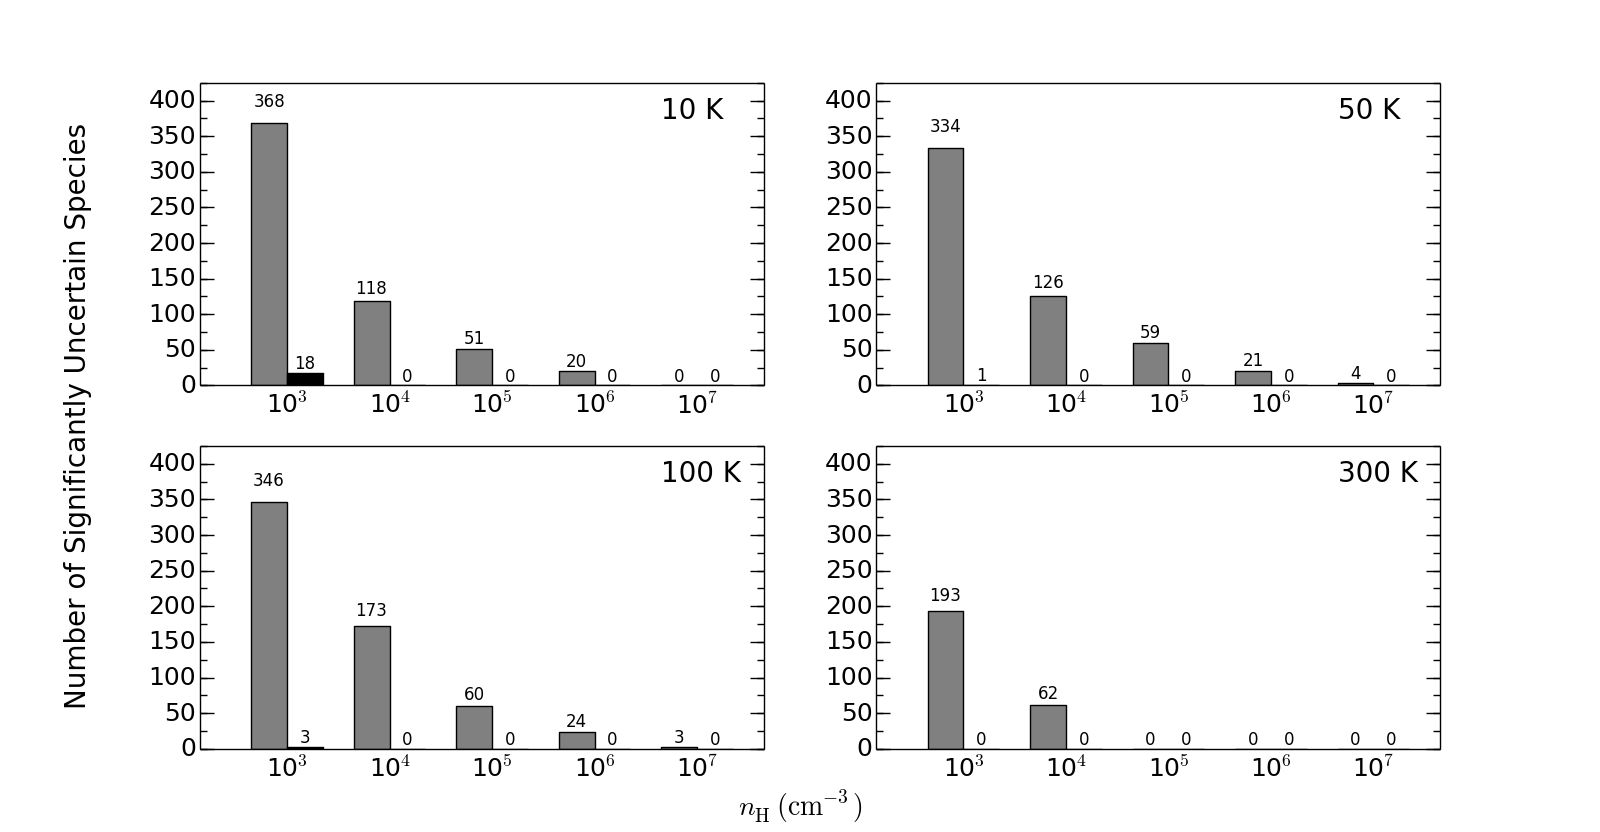
Following Wakelam et al. (2015), a “significantly” uncertain species was taken to mean that was greater than or equal to 0.3 (i.e., a factor of 2 difference). We find that for every temperature and density in our model, there was a reduction in the number of significantly uncertain species. Figure 3 shows this for 10 K and cm-3 by overplotting the uncertainty statistic for the old and new networks. In this figure, 118 species in the old model are shown to be significantly uncertain, while no species in the new models are. Figure 4 does the same, but only for species that have been observed in the ISM. In this figure, 17 species in the old model are significantly uncertain. These species (listed here by number of atoms) are NaOH, SO2, HOOH, HCOOH, HC4N, CH3CN, C2H4, CH3CHO, CH2CHCN, HCOOCH3, CH3CH2OH, CH3OCH3, CH3C4H, CH3COCH3, CH3C5N, CH3C6H, and C6H6. No species in the new model are significantly uncertain. Additionally, Figure 5 shows the relationship between the number of significantly uncertain species and for = 10, 50, 100, and 300 K. The number of significantly uncertain species has been reduced over the full range of temperatures and densities.
6 Summary
In this work, we have fit the experimentally derived thermal rate coefficients of O’Connor et al. (2015) for Reactions (1) and (2) to a functional form given by Equation (4), as the Arrhenius-Kooij formula gives a poor fit to the data. We then included these results into the KIDA/Nahoon astrochemical model to determine their impact on the predicted abundances and their uncertainties as a function of temperature and density. At 10 K, the summed rate coefficient of O’Connor et al. (2015) matches the Langevin value, leading to no significant difference between the old and new models for predicted abundances. However, at higher temperatures the updated rate coefficient decreases relative to the Langevin value, leading to significant differences in predicted abundances. Additionally, we show that the smaller uncertainties on the O’Connor et al. (2015) data, compared to that of the Langevin value, lead to a reduction in the uncertainties of the predicted abundances.
References
- Bettens & Collins (1998) Bettens, R. P. A., & Collins, M. A. 1998, JChPh, 108, 2424
- Bettens & Collins (2001) Bettens, R. P. A., & Collins, M. A. 2001, JChPh, 114, 6490
- de Ruette et al. (2016) de Ruette, N., Miller, K. A., O’Connor, A. P., et al. 2016, ApJ, 816, 31
- Fehsenfeld (1976) Fehsenfeld, F. C. 1976, ApJ, 209, 638
- Herbst & van Dishoeck (2009) Herbst, E. & van Dischoeck, E. F. 2009, ARA&A, 47, 427
- Kreckel et al. (2010) Kreckel, H., Bruhns H., Cizek, M., et al. 2010, Sci, 329, 69
- Milligan & McEwan (2000) Milligan, D. B. & McEwan, M. J. 2000, CPL, 319, 482
- Müller et al. (2005) Müller, H. S. P., Schlöder, F., Stutzki, J., & Winnewisser, G. 2005, J. Mol. Struct., 742, 215, http://www.astro.uni-koeln.de/cdms/molecules
- Novotný et al. (2013) Novotný, O., Becker, A., Buhr, H., et al. 2013, ApJ, 777, 54
- Novotný et al. (2014) Novotný, O., Berg, M., Buhr, H., et al. 2014, ApJ, 792, 132
- Nummelin et al. (2000) Nummelin, A., Bergman, P., Hjalmarson, Å., et al. 2000, ApJS, 128, 213
- O’Connor et al. (2015) O’Connor, A.P., Urbain, X., Stützel, J., et al. 2015, ApJS, 219, 6
- Rodríguez-Fernández et al. (2010) Rodríguez-Fernández, N. J., Tafalla, M., Gueth, F., & Bachiller, R. 2010, A&A, 516, A98
- Savic et al. (2005) Savić, I., Cermák, I., & Gerlich, D. 2005, IJMSp, 240, 139
- Smith & Spanel (1995) Smith, D. & Spanel, P. 1995, Mass Spec. Revs., 14, 255
- Talbi et al. (1991) Talbi, D., Defrees, D. J., Egolf, D. A., & Herbst, E. 1991, ApJ, 374, 390
- van Dishoeck & Blake (1998) van Dishoeck E. F. & Blake, G. A. 1998, ARA&A, 36, 317
- Vasyunin et al. (2008) Vasyunin, A. I., Semenov, D., Henning, T., et al. 2008, ApJ, 672, 629
- Wakelam et al. (2009) Wakelam, V., Loison, J.-C., Herbst, E., et al. 2009, A&A, 495, 513
- Wakelam et al. (2010) Wakelam, V., Smith, I. M. W., Herbst, E., et al. 2010, Space Sci. Rev., 156, 13
- Wakelam et al. (2012) Wakelam, V., Herbst, E., Loison, J.-C., et al. 2012, ApJS, 199, 21
- Wakelam et al. (2015) Wakelam, V., Loison, J.-C., Herbst, E., et al. 2015, ApJS, 217, 20
| Parameter | CH+ | CH | Sum | Units | |||
|---|---|---|---|---|---|---|---|
| dimensionless | |||||||
| K | |||||||
| K | |||||||
| K | |||||||
| K | |||||||
Note. — The value for each parameter is given by .
| Species | Abundance | |
|---|---|---|
| He | 9.0 | -2 |
| C | 1.7 | -4 |
| S | 8.0 | -8 |
| Fe | 3.0 | -9 |
| Mg | 7.0 | -9 |
| P | 2.0 | -10 |
| N | 6.2 | -5 |
| O | 2.4 | -4 |
| Si | 8.0 | -9 |
| Na | 2.0 | -9 |
| Cl | 1.0 | -9 |