Determining the large-scale environmental dependence of gas-phase metallicity in dwarf galaxies
Abstract
We study how the cosmic environment affects galaxy evolution in the Universe by comparing the metallicities of dwarf galaxies in voids with dwarf galaxies in more dense regions. Ratios of the fluxes of emission lines, particularly those of the forbidden [O III] and [S II] transitions, provide estimates of a region’s electron temperature and number density. From these two quantities and the emission line fluxes [O II] , [O III] , and [O III] , we estimate the abundance of oxygen with the Direct method. We estimate the metallicity of 42 blue, star-forming void dwarf galaxies and 89 blue, star-forming dwarf galaxies in more dense regions using spectroscopic observations from the Sloan Digital Sky Survey Data Release 7, as re-processed in the MPA-JHU value-added catalog. We find very little difference between the two sets of galaxies, indicating little influence from the large-scale environment on their chemical evolution. Of particular interest are a number of extremely metal-poor dwarf galaxies that are less prevalent in voids than in the denser regions.
1 Introduction
Galaxy redshift surveys have shown that the large-scale structure of the galaxy distribution is similar to that of a three-dimensional cosmic web (Bond et al., 1996) in which the voids (large, underdense regions that fill upwards of 60% of space) separate galaxy clusters connected by thin filaments of galaxies. The voids found in early surveys (e.g., Gregory & Thompson, 1978; Kirshner et al., 1981; de Lapparent et al., 1986) proved to be an ubiquitous feature of large-scale structure. Analyses of the Sloan Digital Sky Survey (Abazajian et al., 2009; Ahn et al., 2012) have yielded catalogs of voids (Pan et al., 2012; Sutter et al., 2014).
These cosmic voids are an important environment for studying galaxy formation (see van de Weygaert & Platen (2011) for a review). Gravitational clustering within a void proceeds as if in a very low density universe, in which aggregation of gravitationally bound dark matter halos ends relatively early and there is relatively little subsequent interaction between galaxies, both because of the lower density and the faster local Hubble expansion. Thus, the CDM cosmology predicts that galaxies formed in voids should have lower mass and may be retarded in their star formation when compared to those in more dense environments (e.g., Gottlöber et al., 2003; Goldberg et al., 2005; Cen, 2011). Goldberg & Vogeley (2004) show that the interior of a spherical void with 10% of the mean density in a , universe evolves dynamically like an , , universe. Hydrodynamical cosmological simulations by Cen (2011) show that the gas in voids remains below the critical entropy threshold, allowing the void galaxies to continue forming stars. While the more dense environment of cluster galaxies drastically alters their chemical composition and future evolution through the relatively frequent occurrences of mergers, tidal stripping, and/or ram-pressure stripping, void galaxies evolve in a relatively pristine environment where interactions are far less frequent and star formation may proceed up to the present epoch because void galaxies are able to retain their gas.
The effects of the void environment should be most obvious in the dwarf galaxies. Dwarf galaxies are sensitive to many astrophysical effects, including cosmological reionization, internal feedback from supernova and photoheating from star formation, external effects from tidal interactions and ram pressure stripping, small-scale details of dark matter halo assembly, and properties of dark matter. Many of these effects have been invoked to attempt to resolve the discrepancy between the mass function of galaxy halos predicted by CDM and the observed, much smaller density of dwarf galaxies observed in voids (see, e.g., Kravtsov (2009) for a review). It is critical to explore dwarfs in voids to complement studies of dwarfs in groups and clusters because the assembly histories of low-mass galaxies are predicted to be very different (e.g., Gao & White, 2007; Lackner et al., 2012) and observations to date show that the properties of dwarfs vary dramatically with environment (e.g., Ann et al., 2008; Geha et al., 2012). Diffuse cold-mode accretion, rather than mergers, has been suggested to be the dominant mechanism for growing dark matter halos in voids (e.g., Kereš et al., 2005; Fakhouri & Ma, 2009). Late-time gas accretion may be possible in voids if void galaxies retain a baryonic reservoir up to the present epoch. Thus, these few, lonely, faint galaxies test important features of the structure formation model and our understanding of galaxy formation “gastrophysics.”
Observational studies of void galaxies have included examination of photometric properties such as luminosity (Hoyle et al., 2005; Croton et al., 2005; Moorman et al., 2015), color and morphological type (Grogin & Geller, 2000; Rojas et al., 2004; Patiri et al., 2006; Park et al., 2007; von Benda-Beckmann & Müller, 2008; Hoyle et al., 2012) star formation rates estimated from optical spectroscopy and UV photometry (Rojas et al., 2005; Moorman et al., 2015; Beygu et al., 2016), and gas content (Kreckel et al., 2012; Moorman et al., 2016; Jones et al., 2016). Void galaxies tend to be of lower luminosity, of late morphological type, blue, have relatively high rates of star formation per stellar mass, and gas rich.
Another important diagnostic of galaxy formation is metallicity, which is a measure of the integrated star formation history and is frequently characterized by the ratio of the oxygen to hydrogen atomic density (often , though sometimes given in units of the solar metallicity, ). The metallicity should depend on the galaxy’s star formation history, specifically the percentage of the galaxy’s gas that has been processed in stars (Guseva et al., 2009). If void galaxies have only recently started forming stars or have recently accreted unprocessed gas, we would expect these galaxies to have a lower metallicity than those in more dense regions (whose star formation started earlier due to e.g., tidally-triggered star formation). Furthermore, gas-phase metallicity is affected by the evolution of a galaxy’s stellar population and the composition of its interstellar medium (ISM). It reveals a galaxy’s history of releasing metals into the ISM via supernovae and stellar winds, ejecting gas via galactic outflows, and accreting gas from the surrounding environment (see, e.g., Cooper et al., 2008; Cybulski et al., 2014; Hirschmann et al., 2014, and references therein). Understanding the evolution of metallicity in galaxies is therefore crucial in uncovering the details of galactic evolution.
Observations by Cooper et al. (2008); Deng (2011); Filho et al. (2015); Pustilnik et al. (2006, 2011b, 2011a, 2013); Pustilnik (2014) appear to support the hypothesis of lower metallicity in void galaxies, while Kreckel et al. (2015) find no effect of the void environment on their sample of eight void dwarf galaxies. Most of the conclusions of previous work are based on samples containing only a handful of galaxies. Because large sky surveys like SDSS contain a substantial collection of dwarf galaxies, we can now analyze the dwarf galaxy population in the relatively nearby universe to test this hypothesis with more statistical significance. In particular, the main galaxy sample of SDSS DR7 covers a large enough volume to identify over 1000 voids (Pan et al., 2012) and provides spectroscopy to permit metallicity estimates of void dwarf galaxies. We make use of the reprocessed spectroscopic data from the MPA-JHU catalog111Available at http://www.mpa-garching.mpg.de/SDSS/DR7/ to study the metallicity of the large collection of dwarf galaxies in SDSS DR7. As explained by Tremonti et al. (2004), the spectra in the MPA-JHU catalog are analyzed with a more detailed stellar continuum, permitting the weaker emission lines to become more apparent. With the dependence of our analysis on weak emission lines (especially [O III] ), this detailed treatment of the weak emission lines should produce more accurate results. We study the metallicity of these galaxies as a function of large-scale environment, testing the hypothesis that void dwarf galaxies have lower gas-phase metallicities than dwarf galaxies in more dense regions.
Our paper is organized as follows. Section 2 describes the theory and method for using various emission lines to estimate the metallicity of galaxies. We review the source of our data and errors in Section 3. Section 4 includes the results of our metallicity calculations, and we discuss the likelihood of any large-scale environmental influence on these results in Section 5. Finally, Section 6 summarizes our conclusions and discusses future work.
2 Estimation of galaxy metallicity from optical spectroscopy
2.1 Overview of Methods
We characterize the galaxy metallicity using oxygen because it is relatively abundant, it emits strong lines for several ionization states in the optical regime, and a ratio of its lines provides a good estimate of the electron temperature (Kewley & Dopita, 2002). Here, we describe the theory and method we employ to estimate oxygen abundances in dwarf galaxies.
UV photons from young stars in an H II region keep the interstellar gas partially ionized. Optical photons are either absorbed and re-emitted throughout the region at resonant frequencies (resulting in classically permitted electron transitions), or the electrons are collisionally excited (resulting in classically forbidden electron transitions). Collisional excitation of the lower energy levels of metal ions is possible because these levels are only a few eV above the ground state (De Robertis et al., 1987). Consequently, the UV-optical spectrum contains some of the most useful diagnostic emission lines. Due to observational constraints of SDSS DR7 (the spectrometer’s wavelength range and the signal-to-noise of the resulting spectra; see Section 3), not all these emission lines are easily measured.
Three classes of methods have been developed to estimate the gas-phase metallicity of a galaxy, which we label as direct, theoretical, and empirical. Direct- methods are based on a measurement of the [O III] auroral line, from which a “direct” estimate of the electron temperature can be made (e.g., Izotov et al., 2006; Kniazev et al., 2008; Pilyugin & Thuan, 2007; Yin et al., 2007). Theoretical methods are based on photoionization models (e.g., Kewley & Dopita, 2002). Empirical methods make an indirect estimate of the electron temperature based on calibrated relationships between direct metallicity estimates and other strong-line ratios in H II regions (see, for example, Pettini & Pagel, 2004; Pilyugin & Mattsson, 2011; Dopita et al., 2013; Lara-Lopez et al., 2013; Marino et al., 2013). While each of these methods provides an estimate for the metallicity, they are all developed for use on sets of galaxies with different characteristics (stellar mass or gas-phase metallicity, for example). Previously, most theoretical and empirical methods have been calibrated with galaxies of larger stellar mass and higher luminosity. Because the properties of dwarf galaxies differ from those of higher luminosity (and larger stellar mass), most of these methods drastically over- or under-estimate the gas-phase metallicity for dwarf galaxies. Consequently, we must exercise caution when applying these various calculation methods for estimating the metallicity of dwarf galaxies. We attempt to avoid any calibration issues by estimating gas-phase metallicity using the direct- method. This method relies on the weak [O III] emission line, which limits the number of dwarf galaxies we can analyze. However, because this method provides more reliable metallicity estimates than any of the others for dwarf galaxies, we chose quality over quantity in our results.
2.2 [O III]
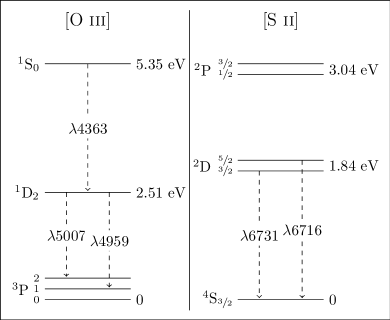
There are three significant emission lines for doubly-ionized oxygen. The relative excitation rates to the 1S and 1D energy levels depend very strongly on the electron temperature, ; therefore, the relative strengths of these emitted lines can be used to measure the electron temperature (Osterbrock, 1989). In the low-density limit , most excitations to the 1D level result in an emission of a photon with a wavelength of either or , as shown in Fig. 1. Most excitations up to 1S produce a photon of wavelength , followed by a photon of either of the two previous wavelengths (since the electron is now in the 1D level).
At higher densities, collisional de-excitation begins to influence these emission rates (Osterbrock, 1989). Because the 1D level has a longer lifetime than the 1S state, it is collisionally de-excited at lower electron densities. This weakens the and emission lines. At the same time, the additional collisional excitations of the 1D state permitted by the higher electron densities strengthen the emission line.
[O III] is a temperature-sensitive forbidden transition line of doubly-ionized oxygen that is the preferred line to use when measuring the metallicity of galaxies. Since the most effective cooling channel in these H II regions is oxygen line emission, lower metallicity regions have higher temperatures (Saintonge, 2007). Collisional excitations up to this energy level are more common at higher temperatures, since there are more electrons with the kinetic energy required to excite the O++ ion to this energy level. As a result, the line strength of [O III] correlates with the region’s temperature and is therefore anticorrelated with the metallicity of the galaxy. [O III] is already one to two orders of magnitude weaker than the [O III] doublet, so it is very difficult to obtain an accurate ratio with this line. It is for these reasons that other “empirical” relations were developed for metallicity calculations, eliminating the need for an electron temperature estimate from this emission line.
Given an electron temperature and density, the flux ratio of the [O III] doublet to H provides an abundance estimate for doubly-ionized oxygen.
2.3 [O II]
A less temperature-sensitive line than [O III] , the [O II] forbidden transition doublet of singly-ionized oxygen is often used in metallicity calculations. With an electron temperature and density, its flux provides an estimate of the abundance of singly-ionized oxygen. In SDSS spectra, this line can be observed for objects with a redshift greater than 0.02. However, because dwarf galaxies are inherently faint objects (), they are targeted for spectroscopy in SDSS only out to redshift , thus we can only estimate the metallicity of dwarf galaxies in the redshift range .
2.4 [S II]
Just as we are able to measure the electron temperature from [O III] transitions, we can estimate the electron number density from [S II] transitions. Below a density of about , the [S II] ratio has a weak dependence on the density. All our galaxies fall within this low-density regime, so we assume a low-density limit of .
2.5 Direct method
We use the method published by Izotov et al. (2006), which is based on the astrophysics in Osterbrock (1989). It makes use of the [O III] , lines and the [O II] doublet. While often regarded as the most accurate estimate of the metallicity, it is difficult to employ due to the restrictions on [O III] . Consequently, this method is best suited for low-redshift, low-metallicity galaxies. The electron temperature is derived by solving the following system of equations:
| (1) |
where and
| (2) |
where . The ionic abundances are then found with the equations
| (3) | ||||
| (4) |
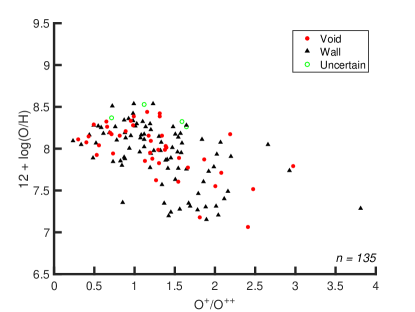
where , (Garnett, 1992), and . Andrews & Martini (2013) show that this relation between and may overestimate the temperature in the low ionization zone, causing the calculated metallicities to be underestimated. Because we care only about the relative metallicity values of the galaxies, this effect will only affect our results in galaxies where O+ dominates the oxygen abundance (where O+/O) in higher temperature regions (or low metallicities). As shown in Fig. 2, this affects perhaps fifteen galaxies and does not change our conclusions.
The total gas-phase oxygen abundance is equal to the sum of the abundances of each of the ionized populations:
| (5) |
3 SDSS data and galaxy selection
The SDSS Data Release 7 (DR7) (Abazajian et al., 2009) is a wide-field multi-band imaging and spectroscopic survey, using drift scanning to map approximately one-quarter of the northern sky. Photometric data in the five band SDSS system — , , , , and — are taken with a dedicated 2.5-meter telescope at the Apache Point Observatory in New Mexico (Fukugita et al., 1996; Gunn et al., 1998). Galaxies with a Petrosian -band magnitude are selected for spectroscopic analysis (Lupton et al., 2001; Strauss et al., 2002). The spectra have an observed wavelength range of to with a resolution , and are taken using two double fiber-fed spectrographs and fiber plug plates with a minimum fiber separation of 55 arcseconds (Blanton et al., 2003). The emission line flux data used in this study are from the MPA-JHU value-added catalog, which is based on the SDSS DR7 sample of galaxies. Absolute magnitudes, colors, and all other additional data are from the KIAS value-added galaxy catalog (Choi et al., 2010).
3.1 Spectroscopic selection
To satisfy the needs of our analysis, we make the following cuts to our sample. All analyzed galaxies must have relatively recent star formation, since UV photons are needed to excite the interstellar gas to produce the required emission lines. As a result, each galaxy must have a star-forming BPT classification by Brinchmann et al. (2004). In addition, because we analyze only dwarf galaxies (), there is a natural redshift upper limit of 0.03 on the samples; dwarf galaxies at higher redshifts are not bright enough to be included in the spectroscopic data of SDSS. For a galaxy to be analyzed, we require a minimum detection of the H emission line and at least a detection of the [O III] forbidden transition. The restriction on both these lines eliminate those galaxies with a low S/N spectrum. This is particularly important for [O III] , as it is inherently a weak emission line. We are aware that implementing this restriction on [O III] eliminates those galaxies with higher metallicities, since the strength of this line is inversely proportional to the metallicity of the galaxy (see Sec. 2.2 for details). However, we show that this restriction does not affect our conclusions on the large-scale environmental dependence on the gas-phase metallicity.
In addition, we also eliminate galaxies with temperature estimates . Gas temperatures above this threshold are not physical for an H II region (inferred from Osterbrock, 1989; Izotov et al., 2006; Luridiana et al., 2015).
For the dwarf galaxies in our sample, the [O II] spectral line is very close to the edge of the spectrometer due to their maximum redshift . Consequently, its flux measurement is not always reliable. Therefore, the flux values labeled oii_flux in the MPA-JHU catalog are used instead of the combined flux values measured for the [O II] doublet. Because the velocity dispersion is not fixed when measuring the flux found in oii_flux, the resulting measurements tend to be more realistic than those measured with the fixed dispersion (C. Tremonti, private communication). In addition, those galaxies with remaining erroneous measurements for the [O II] doublet were removed by hand, after comparing the listed flux values to the spectra by eye. All spectral lines used in the analysis must have a flux greater than 0, to ensure that they are emission lines.
3.2 Void classification
Void galaxies are identified using the void catalog compiled by Pan et al. (2012), which was built based on the galaxies in SDSS DR7 catalog. Starting with galaxies with absolute magnitudes , the VoidFinder algorithm of Hoyle & Vogeley (2002) removes all isolated galaxies (defined as having the third nearest neighbor more than 7 Mpc away). After applying a grid to the remaining galaxies, spheres are grown from all empty grid cells (cells containing no galaxies). A sphere reaches its maximum size when it encounters four galaxies on its surface. To be classified as a void (or part of one), a sphere must have a minimum 10 Mpc radius. If two spheres overlap by more than 10%, they are considered part of the same void. See Hoyle & Vogeley (2002) for a more detailed description of the VoidFinder algorithm. Those galaxies that fall within these void spheres are classified as void galaxies. Those galaxies that lie outside the spheres are classified as wall galaxies. Because we cannot identify any voids within 10 Mpc of the edge of the survey, we do not include the galaxies that fall within this region in either the void or wall sample (throughout this paper, these galaxies are labeled as “Uncertain”).
Of the 800,000 galaxies with spectra available in SDSS DR7, 9519 are dwarf galaxies. Applying the spectroscopic cuts, 42 void dwarf galaxies, 89 wall dwarf galaxies, and 4 dwarf galaxies with uncertain large-scale environments are left to analyze (for a total of 135 dwarf galaxies, 131 of which are used in the environmental tests).
4 Metallicity analysis and results
Our primary objective is to perform a relative measurement of metallicity of dwarf galaxies to discern how the large-scale environment affects their chemical evolution. As discussed in Section 2, the strength of and ability to observe different spectral lines between various surveys and observations require multiple methods to be developed for metallicity calculations. In this paper, we use only the Direct method, because no other method has yet been calibrated using dwarf galaxies. The results from the various methods are not directly comparable; while they all return metallicities within the same range, the same galaxy can have very different metallicity values depending on which method is used. Conversions between methods have been developed (see Kewley & Ellison, 2008), but it is not clear that these conversions would be accurate for dwarf galaxies. Unfortunately, there are not enough galaxies available in our sample to calibrate these other methods for dwarf galaxies.
All line ratios listed are ratios of the emission line fluxes. Galaxies with low metallicities have (Pustilnik et al., 2006); galaxies with high metallicities have (Pilyugin et al., 2006). The solar metallicity is (Asplund et al., 2009).
4.1 Estimation of uncertainties and confirmation of our method
We estimate uncertainties in the computed metallicity using a Monte-Carlo method. Using the measured line fluxes and scaled uncertainty estimates222As described at http://wwwmpa.mpa-garching.mpg.de/SDSS/DR7/raw_data.html from the MPA-JHU catalog, 100,000 different metallicities are calculated for a given galaxy. For each estimate, the flux of a line is drawn from a normal distribution, with the expectation value being the original measured flux and the standard deviation being the given error in the flux measurement. We require all simulated line fluxes to be positive, as negative flux values would result in erroneous metallicity values. The standard deviation in the set of these 100,000 calculated values is used as the error in the metallicity estimate for the galaxy. As a result, these uncertainties tend to be larger than those quoted in other sources, as they include more information than just the quality of the fit used to derive the metallicity.
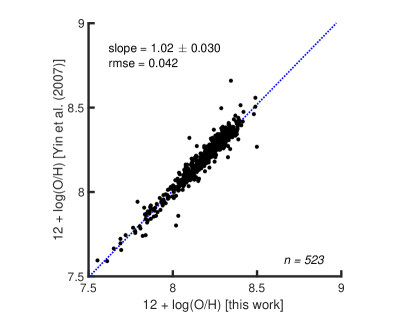
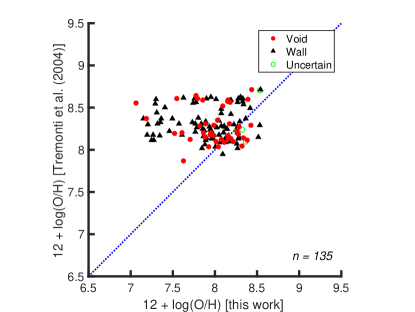
We compare results of our analysis of the same set of SDSS galaxies that Yin et al. (2007) analyze to confirm that our code was working properly, since Yin et al. (2007) also uses the metallicity method outlined in Izotov et al. (2006). The results of this comparison can be seen in Fig. 3. Yin et al. (2007) also uses the MPA-JHU catalog as the source for their data, so our results should be identical.
4.2 Results
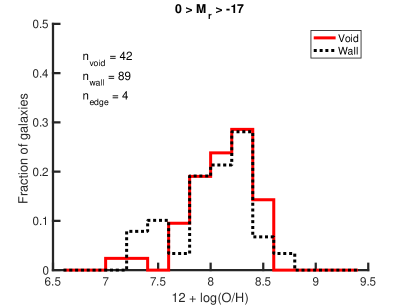
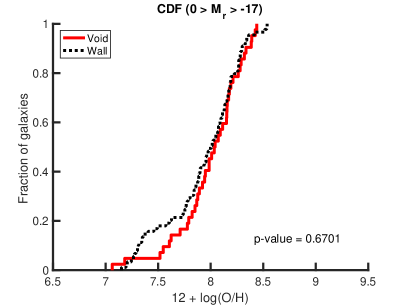
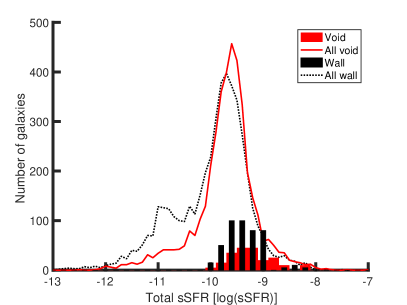
Metallicities calculated using the Direct method for our dwarf galaxy sample are listed in Table 1, along with other key identification for the galaxies (including whether they are a void or wall galaxy). A histogram of the resulting metallicities is shown in Fig. 4. As can be seen in Fig. 4, there is very little difference in the spread of metallicity values in dwarf galaxies between voids and walls. A two-sample Kolmogorov-Smimov (KS) test quantifies this observation — it produced a test statistic of 0.13, corresponding to a probability of 67% that a test statistic greater than or equal to that observed will be measured if the void sample were drawn from the wall sample; the cumulative distribution function (CDF) of these samples can be seen on the right in Fig. 4.
| IndexaaKIAS-VAGC galaxy index number | R.A. | Decl. | Redshift | Void/Wall | |||
|---|---|---|---|---|---|---|---|
| 63713 | 092004.27 | -00°30’08”.97 | 0.0257 | -16.73 | 7.80 | 0.41 | Wall |
| 73537 | 092524.23 | +00°12’40”.39 | 0.0250 | -16.94 | 7.94 | 0.34 | Wall |
| 75442 | 131324.25 | +00°15’02”.95 | 0.0264 | -16.81 | 7.55 | 0.35 | Void |
| 168874 | 114513.16 | -01°48’17”.68 | 0.0273 | -16.99 | 8.16 | 0.31 | Wall |
| 184308 | 093909.38 | +00°59’04”.15 | 0.0244 | -16.73 | 7.36 | 0.43 | Wall |
Note. — Five of the 135 dwarf galaxies analyzed from SDSS DR7. The flux values for all required emission lines can be found in the MPA-JHU value-added catalog. Metallicity values are calculated using the direct method, with error estimates via a Monte Carlo method. The void catalog of Pan et al. (2012) is used to classify the galaxies as either Void or Wall. If a galaxy is located too close to the boundary of the SDSS survey to identify whether or not it is inside a void, it is labeled as Uncertain. Table 1 is published in its entirety online in a machine-readable format. A portion is shown here for guidance regarding its form and content.
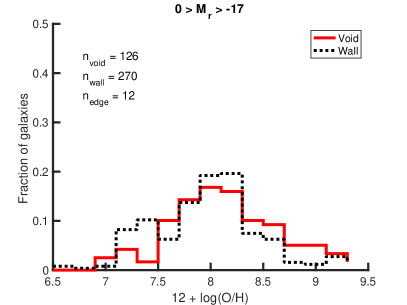
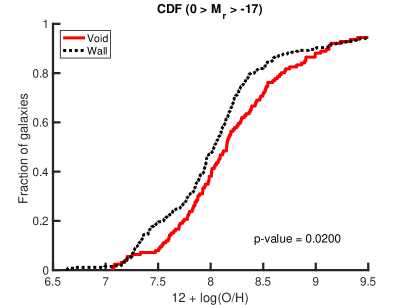
The requirement of a minimum detection of [O III] eliminates galaxies with a low-quality spectrum and those with a weak [O III] line. Since this line is inversely proportional to the oxygen abundance in the interstellar gas, this biases the sample towards more low-metallicity galaxies. To see how much this cut affects the results, we perform the same analysis with no minimum detection limit of [O III] . As can be seen in Fig. 5, this adds a substantial number of galaxies to the sample (there are now 126 void galaxies and 270 wall galaxies analyzed), predominately in the high-metallicity regime. As Table 2 makes apparent, there is now a higher percentage of void dwarf galaxies with high metallicities than wall dwarf galaxies. However, the uncertainties in the metallicity estimates for are almost 0.5 dex, due to the extremely weak [O III] auroral line. Because of these uncertainties, the difference in the distributions may not be statistically significant.
| restriction on [O III] | |||
|---|---|---|---|
| Void | 9.52% (4) | 66.67% (28) | 23.81% (10) |
| Wall | 19.10% (17) | 59.55% (53) | 21.35% (19) |
| No restriction on [O III] | |||
| Void | 13.33% (16) | 45.83% (55) | 40.83% (49) |
| Wall | 23.26% (60) | 46.12% (119) | 30.62% (79) |
4.3 Sources of systematic error
It is well-known that many physical properties of galaxies vary with the distance from the center of the galaxy (Bell & de Jong, 2000). Therefore, a metallicity measurement is dependent on the location of the spectroscopic fiber on the galaxy. If not all the light of the galaxy is contained within the fiber of the spectrograph, the estimated metallicity will not necessarily be representative of a global metallicity value. Indeed, it has been shown that different parts of a galaxy have different metallicity values (Bell & de Jong, 2000). In SDSS, the fiber size is 3 arcseconds – this corresponds to a physical diameter between 1.29 kpc and 1.93 kpc at redshifts . For many of the dwarf galaxies, this covers more than 50% of the galaxy’s luminous surface. The fiber is almost always centered on the brightest spot of the galaxy. For spiral and elliptical galaxies, this is often the center of the galaxy. Since the metallicity of the center of a galaxy is often higher than at its edge, these metallicity values may be overestimates of the global metallicity. Many dwarf galaxies are irregular galaxies, where the fiber is instead focused on a bright H II region.
Due to the requirements we place on the emission lines for the galaxies, we are inherently limiting our sample to only blue, star-forming galaxies. This is not a representative sample of the dwarf galaxy population. Rather, in this study we are only able to comment on the large-scale environmental influence on blue, star-forming dwarf galaxies in a narrow redshift range. Unfortunately, we cannot measure the metallicity of red dwarf galaxies with the Direct method, since we need the UV photons from young stars to excite the interstellar gas.
4.4 Comparison to previously published metallicity measurements
To place our metallicity measurements in the context of previous work, we compare our results to the metallicity values measured by Tremonti et al. (2004). While we both use data from the MPA-JHU value-added catalog, Tremonti et al. (2004) employs an empirical method for estimating the metallicity, which is based on calibrated relationships between direct metallicity values and strong-line ratios. The results of this comparison are shown in Figure 6. Unfortunately, the range of metallicity values found by Tremonti et al. (2004) is limited to those galaxies with high metallicities , due to the characteristics of their sample and their method; they found less than 2% of their total sample to have metallicities less than 8.5. Kennicutt et al. (2003) shows that methods which make extensive use of the strong emission lines (so-called “strong-line” methods) can overestimate the metallicity abundances by as much as 0.3 dex. A similar comparison is made in Yin et al. (2007), where they too find that the metallicity estimates of Tremonti et al. (2004) are overestimated by 0.34 dex on average. This can be seen quite clearly in Figure 6, as there is no correlation between galaxies with our estimates of and the metallicities measured by Tremonti et al. (2004), since their metallicities are much higher than ours. The formal correlation coefficient between these two data sets is ; the correlation coefficient for those galaxies we measure to have metallicities greater than 7.6 (so excluding the low-metallicity galaxies) is . While this shows a slightly stronger correlation, we realize that these galaxies cover a limited range of metallicity values. As a result, any scatter due to the errors in the calculations will result in a low correlation coefficient, which is what we see. Therefore, by Fig. 6, we can see that there is a reasonable agreement between our metallicity values and those of Tremonti et al. (2004), excluding those galaxies we found to have extremely low metallicity values.
While it is known that there are systematic offsets between different metallicity calculation methods (Kewley & Ellison, 2008), that does not seem to be the case in the relation between our metallicities (measured with the Direct method) and those of Tremonti et al. (2004) (measured with a combination of “strong-line” methods). While the metallicity estimates by Tremonti et al. (2004) do not appear to be significantly biased at , they overestimate the metallicities for low-metallicity galaxies.
4.5 Mass-metallicity relation
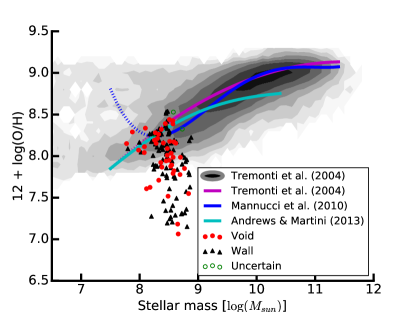
A strong correlation between the stellar mass and metallicity of galaxies reflects the fundamental connection between galactic mass and the chemical evolution of galaxies. We use stellar mass estimates from the MPA-JHU catalog to examine the mass-metallicity relation in our sample of 135 dwarf galaxies. We have also included those galaxies from the MPA-JHU catalog with metallicity estimates from Tremonti et al. (2004) to place our sample in context. Due to the narrow range of masses in our sample, it is difficult to derive an accurate fit to the data. However, we make comparisons to three published mass-metallicity relations (Tremonti et al., 2004; Mannucci et al., 2010; Andrews & Martini, 2013). As can be seen in Fig. 7, the fit by Mannucci et al. (2010) diverges at the low-mass limit, and the relations of Tremonti et al. (2004) and Andrews & Martini (2013) predict metallicities that are higher than measured for most galaxies in this sample. It is important to note that two of these relations are only calibrated down to a stellar mass of . In Fig. 7, these relations have been extended to , in order to continue past our galaxy sample.
In addition to looking at the overall mass-metallicity relation for dwarf galaxies, we can also investigate the difference in the relation between galaxies in voids and those in more dense regions. There appear to be no significant differences in the two populations, indicating minimal influence from the large-scale environment on the mass-metallicity relation of these dwarf galaxies. Hughes et al. (2013) also find that the stellar mass-metallicity relation is independent of large-scale environment. This prompts the conclusion that the internal evolutionary processes of a galaxy have a greater influence on its chemical evolution than its large-scale environment. We expect this dependence of the chemical content of a galaxy on its stellar mass, since the accumulated metals reflect the integrated history of star formation. However, we would expect an environmental dependence to appear as well, if void galaxies are in an earlier stage of evolution and/or are continuing to accrete fresh gas.
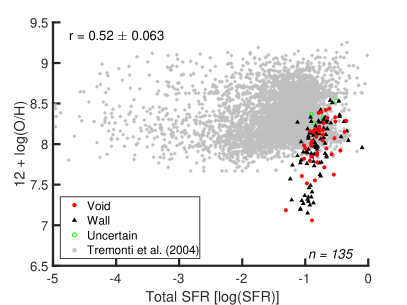
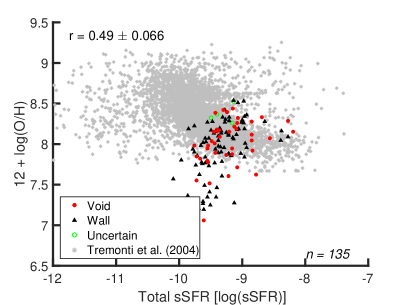
4.6 SFR-metallicity relation
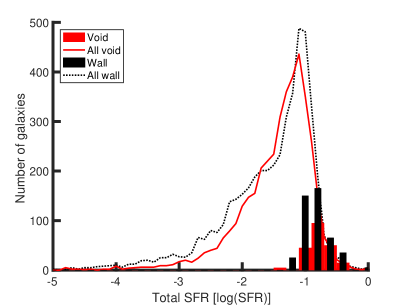
A fundamental diagnostic of the star formation history of galaxies is the relation between stellar mass, metallicity, and star formation rate. Therefore, we also look at the relationship between the (specific) star formation rate and metallicity of these 135 dwarf galaxies. The total (specific) star formation rate estimates for these galaxies are from the MPA-JHU value-added catalog, based on the technique discussed in Brinchmann et al. (2004). For low-mass galaxies, Henry et al. (2013) show that the metallicity is inversely proportional to the star formation rate of a galaxy. However, this is not what is observed in our data, as seen in Fig. 8. The correlation coefficient between the total (specific) star formation rate and the metallicity and , showing a positive correlation between the two properties. Indeed, those galaxies with the lowest metallicities have some of the lowest (specific) star formation rates among the dwarf galaxies in our sample. Since we are limiting our sample to only star-forming galaxies, the (s)SFR must be relatively high to emit the UV photons needed to ionize the gas. As a result, all low (s)SFR galaxies will be eliminated from our sample, as seen in Fig. 9. In addition, due to the behavior of the [O III] auroral line, all galaxies with metallicities are also eliminated from the sample. As a result, we are only calculating the metallicity of galaxies in the lower right corners of the (s)SFR plots in Fig. 8, which is why we see the unexpected correlation. There does not seem to be a difference between the void and wall galaxies in this relation, indicating no large-scale environmental influence on the (s)SFR–Z relation.
4.7 Color-metallicity relation
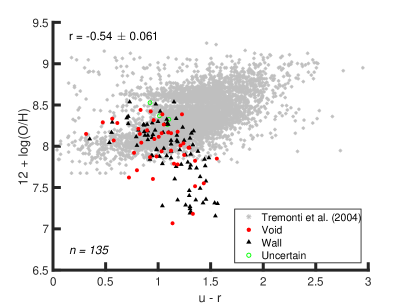
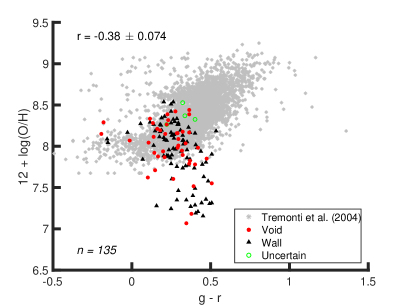
Metallicity is expected to have a positive correlation with color, as older galaxies are expected to have higher metallicities, since they have had more time to convert their gas into heavier elements through star formation. Therefore, we also look at the color–metallicity relation of our sample of 135 galaxies – these relations can be seen in Fig. 10. To place our galaxies in the context of other dwarf galaxies, we have included the sample of dwarf galaxies for which Tremonti et al. (2004) has estimated metallicities (grey stars in the figures).
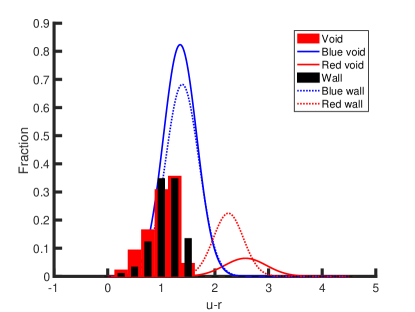
As we can see in Fig. 11, by overlaying our distribution of dwarf galaxies on Fig. 4 of Hoyle et al. (2012), all of our dwarf galaxies are members of the blue dwarf galaxy population. (The Gaussian parameters for the curves are taken from Table 3 in Hoyle et al. (2012).) This is as expected, since the Direct method requires measurements of the emission lines of the galaxies; these emission lines are caused by the UV photons of newly formed stars, indicating a star-forming galaxy and giving the galaxy a blue color.
While the majority of our galaxies follow the positive correlation between color and metallicity, the group of extremely low-metallicity galaxies is less blue than their metallicities would indicate. However, when compared to the red/blue curves in Fig. 11, these galaxies occupy the typical range of blue dwarf galaxies, so their colors are not unique. There is no clear separation between the void and wall dwarf galaxies in Fig. 10, indicating that there is little or no large-scale environmental influence on the color-metallicity relation of these galaxies.
5 Discussion
5.1 Comparison to literature results
We find no clear distinction between the metallicities of dwarf galaxies in voids and dwarf galaxies in more dense regions. This result agrees with the results of Mouhcine et al. (2007); Cooper et al. (2008); Nicholls et al. (2014); Kreckel et al. (2015) but disproves our initial hypothesis and contradicts the published results of Pustilnik et al. (2006, 2011b); Pustilnik (2014); Sánchez Almeida et al. (2016). Cooper et al. (2008) concludes that metal-rich galaxies preferentially reside in high-density regions. Due to our requirement on the [O III] auroral line, we have very few dwarf galaxies with high metallicities. As a result, we are not able to confirm their conclusions. Deng (2011) also reports a relationship between environment and metallicity. However, he highlights a large difference in metallicity as a function of redshift which correlates with his two samples. It is possible that the dependence he found is actually the result of a systematic dependence on redshift in their metallicity calculation.
Many studies suggest that the metallicity of void galaxies should, on average, be lower than that of galaxies in more dense regions. Mouhcine et al. (2007) and Cooper et al. (2008) both perform statistical studies of this relationship on SDSS DR4, and Deng (2011) repeats this with the DR7 data (only looking at galaxies with a redshift ). Mouhcine et al. (2007) conclude that the relation between stellar mass and metallicity is much stronger than that between a galaxy’s environment and its metallicity. Cooper et al. (2008) find a more substantial correlation between a galaxy’s environment and its metallicity, but point out that the noise of the different methods used to calculate metallicity is larger than any environment-metallicity relation. Our analysis shows that there is very little difference between void and wall dwarf galaxies, suggesting that the large-scale environment does not strongly influence a dwarf galaxy’s chemical evolution.
5.2 Large-scale environmental influence
Consideration of interactions between the interstellar medium (ISM), circumgalactic medium (CGM), and intergalactic medium (IGM) suggests that void galaxies should have relatively lower metallicity than galaxies in denser environments. We find no such trend, perhaps because the IGM around star-forming “wall galaxies” in our sample is similar to that of void galaxies.
Simulations by Cen (2011) show that the entropy of gas in the IGM in voids remains below the critical entropy (defined to be when the cooling time of the gas is equal to the Hubble time), so the gas from the IGM can cool and fall into a void galaxy’s CGM. In a galaxy’s ISM, supernovae expel gas (primarily metal-rich) into the CGM. This gas has a higher metallicity than the average metallicity of the ISM (shown by Muratov et al., 2016). While some of this gas reaches the outer edge of the CGM, most of it cools and falls back onto the galaxy’s ISM, after having mixed with the hydrogen that has entered the CGM from the IGM. Therefore, the gas falling back into the galaxy’s ISM has a lower metallicity than the galaxy’s ISM.
In contrast to the void galaxies, the IGM around most wall galaxies is not cool enough to fall back onto the CGM. Cen (2011) shows that, in general, the IGM of a wall galaxy has an entropy higher than the threshold for cooling. As a result, most of the gas that falls back onto a wall galaxy’s ISM is not as diluted as what falls onto a void galaxy’s ISM. This is where our hypothesis originated: because wall galaxies no longer have a source of cool hydrogen in the IGM, their metallicities will be higher than that of the void galaxies (for a fixed stellar mass).
However, Fig. 4 does not reveal a lower metallicity in void galaxies. Instead, our results indicate that there is no difference in the distribution of metallicities in wall and void galaxies. In detail, Fig. 10 of Cen (2011) shows that not all wall galaxies rise above the entropy threshold. This is also coincident with the sSFR of the galaxies — those galaxies with higher sSFRs are below the entropy threshold, while those with low sSFRs are above (independent of their large-scale environment). Since all our galaxies have relatively high sSFRs (as required by the analysis — star formation is required to detect the emission lines necessary for the metallicity calculations), it is possible that our population of wall dwarf galaxies is still surrounded by a cool IGM, similar to that of the void galaxies. As a result, the wall galaxies still have a source of cool hydrogen, so the resulting distribution of the metallicities in the wall and void dwarf galaxies is the same. Brisbin & Harwit (2012) show that most star-forming galaxies with appear to be fed by the infall of pristine or low-metallicity gas. Moran et al. (2012) also find that the lowest-mass galaxies () have a sharp decline in their metallicity at large radii; coupled with a strong correlation to the galaxies’ H I masses, they concluded that this indicates newly accreted pristine gas in the galaxies. It appears that the large-scale (10 Mpc) has little effect on the chemical evolution of galaxies; a galaxy’s medium-scale (2 Mpc) environment might have much more influence on its chemical evolution.
5.3 Extreme low-metallicity galaxies
Based on observations of six extremely low-metallicity galaxies found in voids, Pustilnik et al. (2006, 2011b, 2013) infer that there is a fractionally larger population of metal-poor galaxies located in voids than in more dense regions. Filho et al. (2015) study the environment of 140 extremely metal-poor galaxies and find that they preferentially reside in low-density environments in the local universe. Of the 135 galaxies we analyze, twenty-one have extremely low gas-phase metallicity values (); they are highlighted in Table 3. Of these twenty-one galaxies, only four are found in voids (roughly 10% of the dwarf void population measured) and seventeen are located in more dense regions (about 19% of the dwarf wall population measured). These population fractions do not support the existence of a special population of extreme metal-poor galaxies in voids, although the statistics are very small. None of these galaxies share the same local environment (none are neighbors to each other). In addition, Fig. 4 shows no evidence to support a special population of extremely metal-poor galaxies in the voids, as extremely metal-poor galaxies are more prevalent in the more dense regions.
| IndexaaKIAS-VAGC galaxy index number | R.A. | Decl. | Redshift | Void/Wall | ||
|---|---|---|---|---|---|---|
| 268470 | 131817.82 | +02°12’59”.83 | 0.0252 | 7.06 | 0.37 | Void |
| 1422637 | 141812.14 | +13°59’33”.98 | 0.0261 | 7.15 | 0.41 | Wall |
| 839665 | 080953.53 | +29°17’04”.82 | 0.0281 | 7.18 | 0.44 | Void |
| 1168448 | 110641.00 | +45°19’09”.28 | 0.0220 | 7.19 | 0.46 | Wall |
| 1299291 | 121714.02 | +43°18’53”.36 | 0.0233 | 7.21 | 0.42 | Wall |
| 1170573 | 110539.42 | +46°03’28”.37 | 0.0250 | 7.24 | 0.34 | Wall |
| 2288717 | 104612.18 | +21°31’37”.37 | 0.0248 | 7.27 | 0.48 | Wall |
| 955643 | 114203.02 | +49°21’25”.18 | 0.0244 | 7.28 | 0.44 | Wall |
| 1344311 | 123313.64 | +11°10’28”.46 | 0.0245 | 7.29 | 0.50 | Wall |
| 1254352 | 132902.45 | +10°54’55”.80 | 0.0237 | 7.30 | 0.44 | Wall |
| 1857820 | 084500.34 | +27°16’47”.04 | 0.0257 | 7.31 | 0.48 | Wall |
| 866876 | 090457.96 | +41°29’36”.42 | 0.0240 | 7.32 | 0.40 | Wall |
| 833588 | 084310.71 | +43°08’53”.58 | 0.0245 | 7.34 | 0.41 | Wall |
| 283263 | 141412.88 | +01°50’12”.88 | 0.0255 | 7.35 | 0.43 | Wall |
| 184308 | 093909.38 | +00°59’04”.15 | 0.0244 | 7.36 | 0.43 | Wall |
| 1389829 | 143101.38 | +38°04’21”.50 | 0.0269 | 7.41 | 0.46 | Wall |
| 858951 | 093139.60 | +49°49’56”.85 | 0.0251 | 7.46 | 0.46 | Wall |
| 1270221 | 132739.85 | +50°54’09”.69 | 0.0295 | 7.49 | 0.43 | Wall |
| 431383 | 085844.96 | +50°29’58”.98 | 0.0230 | 7.52 | 0.60 | Void |
| 75442 | 131324.25 | +00°15’02”.95 | 0.0264 | 7.55 | 0.35 | Void |
| 1322765 | 141505.58 | +36°22’57”.77 | 0.0273 | 7.57 | 0.40 | Wall |
Note. — Details of the 21 extreme low gas-phase metallicity () galaxies found. Four of these galaxies are located in voids (about 10% of the void dwarf population measured) and seventeen are in more dense regions (about 19% of the wall dwarf population measured); thus, there does not seem to be a special population of extreme low-metallicity galaxies in voids. Further study of these galaxies is recommended to confirm metallicity values and identify any shared characteristics.
We find that these twenty-one extremely metal-poor galaxies are redder and have a lower (s)SFR than the others when looking at the color (Fig. 10) and (specific) star formation rate (Fig. 8) of the 135 analyzed galaxies. The [O III] auroral line is within the noise of the spectra in thirteen of these extremely metal-poor dwarf galaxies. While normally such a weak detection of this line corresponds to a high metallicity (see Sec. 2.2 for details), most of the spectra of these twenty-one galaxies have very low S/N overall. As a result, it is not surprising that [O III] is within the noise here. Further study of these twenty-one galaxies is recommended, to confirm these low metallicity values.
6 Conclusions
Using spectroscopic line flux measurements of galaxies in the SDSS DR7 sample available through the MPA-JHU catalog, we estimate the metallicity of dwarf galaxies based on the Direct method. From the 135 galaxies analyzed, there appears to be no large-scale environmental dependence of the metallicity of these galaxies, as the distributions of metallicity values are very similar for those residing in voids and those in more dense regions. Thus, the large-scale () environment does not appear to strongly influence the chemical evolution of dwarf galaxies.
We examine the relationship between metallicity and other physical characteristics of our dwarf galaxies. In the mass-metallicity relation, our galaxies are at the low-mass extreme; the extreme low metallicity galaxies we found are scattered below this relation. All our dwarf galaxies are at the upper limit in total (s)SFR, and they are on the blue end of the color spectrum. There is no large-scale environmental dependence of the metallicity in any of these categories.
No special population of extremely metal-poor galaxies is found in the voids, as extremely metal-deficient galaxies are found in both voids and walls. A more detailed study of these twenty-one galaxies is recommended, to confirm their metallicity values and discover characteristics shared by the population.
Although over 800,000 galaxies in SDSS DR7 have spectroscopic observations, only 135 are dwarf galaxies with metal line fluxes necessary to estimate gas-phase oxygen abundances using the Direct method. Unfortunately, this was not enough to re-calibrate any of the more common methods used to calculate metallicity for use on dwarf galaxies. Better data are required to discern the metallicity of a larger selection of dwarf galaxies, from which accurate calibrations can be developed. These estimated ionic abundances can then be compared with predictions of the environmental dependence of star formation and metallicity from high-resolution hydrodynamic simulations.
References
- Abazajian et al. (2009) Abazajian, K. N., Adelman-McCarthy, J., Agueros, M. A., et al. 2009, ApJS, 182, 543
- Ahn et al. (2012) Ahn, C. P., Alexandroff, R., Allende Prieto, C., et al. 2012, ApJS, 203, 21
- Andrews & Martini (2013) Andrews, B. H., & Martini, P. 2013, ApJ, 765, 140
- Ann et al. (2008) Ann, H. B., Park, C., & Choi, Y.-Y. 2008, MNRAS, 389, 86
- Asplund et al. (2009) Asplund, M., Grevesse, N., Sauval, A. J., & Scott, P. 2009, ARA&A, 47, 481
- Bell & de Jong (2000) Bell, E. F., & de Jong, R. S. 2000, MNRAS, 312, 497
- Beygu et al. (2016) Beygu, B., Kreckel, K., van der Hulst, J. M., et al. 2016, MNRAS, 458, 394
- Blanton et al. (2003) Blanton, M. R., Lin, H., Lupton, R. H., et al. 2003, AJ, 125, 2276
- Bond et al. (1996) Bond, J. R., Kofman, L., & Pogosyan, D. 1996, Nature, 380, 603
- Brinchmann et al. (2004) Brinchmann, J., Charlot, S., White, S. D. M., et al. 2004, MNRAS, 351, 1151
- Brisbin & Harwit (2012) Brisbin, D., & Harwit, M. 2012, ApJ, 750, 142
- Cen (2011) Cen, R. 2011, ApJ, 741, 99
- Choi et al. (2010) Choi, Y.-Y., Han, D.-H., & Kim, S. S. 2010, JKAS, 43, 191
- Cooper et al. (2008) Cooper, M. C., Tremonti, C. A., Newman, J. A., & Zabludoff, A. I. 2008, MNRAS, 390, 245
- Croton et al. (2005) Croton, D. J., Farrar, G. R., Norberg, P., et al. 2005, MNRAS, 356, 1155
- Cybulski et al. (2014) Cybulski, R., Yun, M. S., Fazio, G. G., & Gutermuth, R. A. 2014, MNRAS, 439, 3564
- de Lapparent et al. (1986) de Lapparent, V., Geller, M. J., & Huchra, J. P. 1986, ApJL, 302, L1
- De Robertis et al. (1987) De Robertis, M., Dufour, R., & Hunt, R. 1987, JRASC, 81, 195
- Deng (2011) Deng, X.-F. 2011, AJ, 141, 162
- Dopita et al. (2013) Dopita, M. A., Sutherland, R. S., Nicholls, D. C., Kewley, L. J., & Vogt, F. P. 2013, ApJS, 208
- Fakhouri & Ma (2009) Fakhouri, O., & Ma, C.-P. 2009, MNRAS, 394, 1825
- Filho et al. (2015) Filho, M. E., Sánchez Almeida, J., Muñoz-Tuñón, C., et al. 2015, ApJ, 802, 82
- Fukugita et al. (1996) Fukugita, M., Ichikawa, T., Gunn, J. E., et al. 1996, AJ, 111, 1748
- Gao & White (2007) Gao, L., & White, S. D. M. 2007, MNRAS, 377, L5
- Garnett (1992) Garnett, D. R. 1992, AJ, 103, 1330
- Geha et al. (2012) Geha, M., Blanton, M. R., Yan, R., & Tinker, J. L. 2012, ApJ, 757, 85
- Goldberg et al. (2005) Goldberg, D. M., Jones, T. D., Hoyle, F., et al. 2005, ApJ, 621, 643
- Goldberg & Vogeley (2004) Goldberg, D. M., & Vogeley, M. S. 2004, ApJ, 605, 1
- Gottlöber et al. (2003) Gottlöber, S., Łokas, E. L., Klypin, A., & Hoffman, Y. 2003, MNRAS, 344, 715
- Gregory & Thompson (1978) Gregory, S. A., & Thompson, L. A. 1978, ApJ, 222, 784
- Grogin & Geller (2000) Grogin, N. A., & Geller, M. J. 2000, AJ, 119, 32
- Gunn et al. (1998) Gunn, J. E., Carr, M., Rockosi, C., et al. 1998, AJ, 116, 3040
- Guseva et al. (2009) Guseva, N., Papaderos, P., Meyer, H., Izotov, Y., & Fricke, K. 2009, A&A, 505, 63
- Henry et al. (2013) Henry, A., Martin, C. L., Finlator, K., & Dressler, A. 2013, ApJ, 769, 148
- Hirschmann et al. (2014) Hirschmann, M., De Lucia, G., Wilman, D., et al. 2014, MNRAS, 444, 2938
- Hoyle et al. (2005) Hoyle, F., Rojas, R. R., Vogeley, M. S., & Brinkmann, J. 2005, ApJ, 620, 618
- Hoyle & Vogeley (2002) Hoyle, F., & Vogeley, M. S. 2002, ApJ, 566, 641
- Hoyle et al. (2012) Hoyle, F., Vogeley, M. S., & Pan, D. 2012, MNRAS, 426, 3041
- Hughes et al. (2013) Hughes, T. M., Cortese, L., Boselli, A., Gavazzi, G., & Davies, J. I. 2013, A&A, 550, A115
- Izotov et al. (2006) Izotov, Y., Stasinska, G., Meynet, G., Guseva, N., & Thuan, T. 2006, A&A, 448, 955
- Jones et al. (2016) Jones, M. G., Papastergis, E., Haynes, M. P., & Giovanelli, R. 2016, MNRAS, 457, 4393
- Kennicutt et al. (2003) Kennicutt, Jr., R. C., Bresolin, F., & Garnett, D. R. 2003, ApJ, 591, 801
- Kereš et al. (2005) Kereš, D., Katz, N., Weinberg, D. H., & Davé, R. 2005, MNRAS, 363, 2
- Kewley & Dopita (2002) Kewley, L., & Dopita, M. 2002, ApJS, 142, 35
- Kewley & Ellison (2008) Kewley, L. J., & Ellison, S. L. 2008, ApJ, 681, 1183
- Kirshner et al. (1981) Kirshner, R. P., Oemler, Jr., A., Schechter, P. L., & Shectman, S. A. 1981, ApJL, 248, L57
- Kniazev et al. (2008) Kniazev, A. Y., Zijlstra, A. A., Grebel, E. K., et al. 2008, MNRAS, 388, 1667
- Kravtsov (2009) Kravtsov, A. 2009, in Astronomical Society of the Pacific Conference Series, Vol. 419, Galaxy Evolution: Emerging Insights and Future Challenges, ed. S. Jogee, I. Marinova, L. Hao, & G. A. Blanc, 283
- Kreckel et al. (2015) Kreckel, K., Croxall, K., Groves, B., van de Weygaert, R., & Pogge, R. W. 2015, ApJL, 798, L15
- Kreckel et al. (2012) Kreckel, K., Platen, E., Aragon-Calvo, M., et al. 2012, AJ, 144, 16
- Lackner et al. (2012) Lackner, C. N., Cen, R., Ostriker, J. P., & Joung, M. R. 2012, MNRAS, 425, 641
- Lara-Lopez et al. (2013) Lara-Lopez, M., Hopkins, A., Lopez-Sanchez, A., et al. 2013, MNRAS, 434, 451
- Lupton et al. (2001) Lupton, R., Gunn, J. E., Ivezić, Z., Knapp, G. R., & Kent, S. 2001, in Astronomical Society of the Pacific Conference Series, Vol. 238, Astronomical Data Analysis Software and Systems X, ed. F. R. Harnden, Jr., F. A. Primini, & H. E. Payne, 269
- Luridiana et al. (2015) Luridiana, V., Morisset, C., & Shaw, R. A. 2015, A&A, 573, A42
- Mannucci et al. (2010) Mannucci, F., Cresci, G., Maiolino, R., Marconi, A., & Gnerucci, A. 2010, MNRAS, 408, 2115
- Marino et al. (2013) Marino, R. A., Rosales-Ortega, F. F., Sánchez, S. F., et al. 2013, A&A, 559, A114
- Moorman et al. (2016) Moorman, C. M., Moreno, J., White, A., et al. 2016, ArXiv e-prints, arXiv:1601.04092
- Moorman et al. (2015) Moorman, C. M., Vogeley, M. S., Hoyle, F., et al. 2015, ApJ, 810, 108
- Moran et al. (2012) Moran, S. M., Heckman, T. M., Kauffmann, G., et al. 2012, ApJ, 745, 66
- Mouhcine et al. (2007) Mouhcine, M., Baldry, I. K., & Bamford, S. P. 2007, MNRAS, 382, 801
- Muratov et al. (2016) Muratov, A. L., Keres, D., Faucher-Giguere, C.-A., et al. 2016, ArXiv e-prints, arXiv:1606.09252
- Nicholls et al. (2014) Nicholls, D. C., Jerjen, H., Dopita, M. A., & Basurah, H. 2014, ApJ, 780, 88
- Osterbrock (1989) Osterbrock, D. E. 1989, Astrophysics of Gaseous Nebulae and Active Galactic Nuclei (Mill Valley, CA: University Science Books)
- Pan et al. (2012) Pan, D. C., Vogeley, M. S., Hoyle, F., Choi, Y.-Y., & Park, C. 2012, MNRAS, 421, 926
- Park et al. (2007) Park, C., Choi, Y.-Y., Vogeley, M. S., et al. 2007, ApJ, 658, 898
- Patiri et al. (2006) Patiri, S. G., Prada, F., Holtzman, J., Klypin, A., & Betancort-Rijo, J. 2006, MNRAS, 372, 1710
- Pettini & Pagel (2004) Pettini, M., & Pagel, B. E. 2004, MNRAS, 348, L59
- Pilyugin & Mattsson (2011) Pilyugin, L. S., & Mattsson, L. 2011, MNRAS, 412, 1145
- Pilyugin & Thuan (2007) Pilyugin, L. S., & Thuan, T. X. 2007, ApJ, 669, 299
- Pilyugin et al. (2006) Pilyugin, L. S., Thuan, T. X., & Vilchez, J. M. 2006, MNRAS, 367, 1139
- Pustilnik et al. (2006) Pustilnik, S., Engels, D., Kniazev, A., et al. 2006, AstL, 32, 228
- Pustilnik et al. (2011a) Pustilnik, S., Martin, J., Tepliakova, A., & Kniazev, A. 2011a, MNRAS, 417, 1335
- Pustilnik et al. (2011b) Pustilnik, S., Tepliakova, A., & Kniazev, A. 2011b, AstBu, 66, 255
- Pustilnik (2014) Pustilnik, S. A. 2014, ArXiv e-prints, arXiv:1412.1316
- Pustilnik et al. (2013) Pustilnik, S. A., Martin, J.-M., Lyamina, Y. A., & Kniazev, A. Y. 2013, MNRAS, 432, 2224
- Rojas et al. (2004) Rojas, R. R., Vogeley, M. S., Hoyle, F., & Brinkmann, J. 2004, ApJ, 617, 50
- Rojas et al. (2005) —. 2005, ApJ, 624, 571
- Saintonge (2007) Saintonge, A. 2007, PhD thesis, Cornell University
- Sánchez Almeida et al. (2016) Sánchez Almeida, J., Pérez-Montero, E., Morales-Luis, A. B., et al. 2016, ApJ, 819, 110
- Strauss et al. (2002) Strauss, M. A., Weinberg, D. H., Lupton, R. H., et al. 2002, AJ, 124, 1810
- Sutter et al. (2014) Sutter, P. M., Lavaux, G., Wandelt, B. D., et al. 2014, MNRAS, 442, 3127
- Tremonti et al. (2004) Tremonti, C. A., Heckman, T. M., Kauffmann, G., et al. 2004, ApJ, 613, 898
- van de Weygaert & Platen (2011) van de Weygaert, R., & Platen, E. 2011, International Journal of Modern Physics Conference Series, 1, 41
- von Benda-Beckmann & Müller (2008) von Benda-Beckmann, A. M., & Müller, V. 2008, MNRAS, 384, 1189
- Yin et al. (2007) Yin, S., Liang, Y., Hammer, F., et al. 2007, A&A, 462, 535