Are Some Milky Way Globular Clusters Hosted by Undiscovered Galaxies?
Abstract
The confirmation of a globular cluster (GC) in the recently discovered ultrafaint galaxy Eridanus II (Eri II) motivated us to examine the question posed in the title. After estimating the halo mass of Eri II using a published stellar mass - halo mass relation, the one GC in this galaxy supports extending the relationship between the number of GCs hosted by a galaxy and the galaxy’s total mass about two orders of magnitude in stellar mass below the previous limit. For this empirically determined specific frequency of between 0.06 and 0.39 globular clusters per 109 of total mass, the surviving Milky Way (MW) subhalos with masses smaller than could host as many as 5 to 31 GCs, broadly consistent with the actual population of outer halo MW GCs, although matching the radial distribution in detail remains a challenge. Using a subhalo mass function from published high resolution numerical simulations and a Poissonian model for populating those halos with the aforementioned empirically constrained frequency, we find that about 90% of these GCs lie in lower-mass subhalos than that of Eri II. From what we know about the stellar mass-halo mass function, the subhalo mass function, and the mass-normalized GC specific frequency, we conclude that some of the MW’s outer halo GCs are likely to be hosted by undetected subhalos with extremely modest stellar populations.
Subject headings:
dark matter — Galaxy: halo — globular clusters: general1. Introduction
Based on the successful modeling of the internal dynamics and surface brightness profiles of globular clusters (GCs), it is generally thought that they are free of dark matter (Michie, 1963; King, 1966; Conroy et al., 2011). However, GCs are always found within a larger-scale dark matter halo, that of their host galaxy. In actuality, the number of GCs correlates with the host’s total mass more strongly than it does with the host’s luminosity or stellar mass (Blakeslee, 1997; McLaughlin, 1999; Spitler et al., 2008; Harris et al., 2013; Hudson, et al., 2014; Harris et al., 2015). Does the relationship between the number of GCs and host’s total mass extend into the subhalo regime? Could some of the Milky Way’s GCs be hosted by yet undetected subhalos with extremely modest stellar populations?
The suggestion that GCs could be hosted by subhalos originates with Peebles (1984). The scenario is a natural outgrowth of the standard, dark-matter-dominated, hierarchical model (Moore et al., 2006), and has more recently been adopted primarily as a means of understanding GC chemical anomalies (Bekki et al., 2008; Bekki, 2011). Testing the scenario is difficult. Subhalos, as traced using their constituent stellar populations, become difficult to identify in the ultrafaint galaxy regime because of the a precipitous decline in the stellar mass fraction with decreasing halo mass (for a review see Kravtsov, 2010). Among the known Milky Way (MW) low-mass subhalos, only the Fornax dwarf Spheroidal, which lies at the upper range of the MW dwarf satellite galaxy mass function, hosts multiple GCs. Tidally disrupted satellite galaxies, both of the MW and M31, may have hosted GCs (Ibata et al., 1995; Crane et al., 2003; Martin et al., 2004; Mackey et al., 2010; Veljanoski et al., 2014; Li et al., 2015) but determining those subhalo masses is difficult.
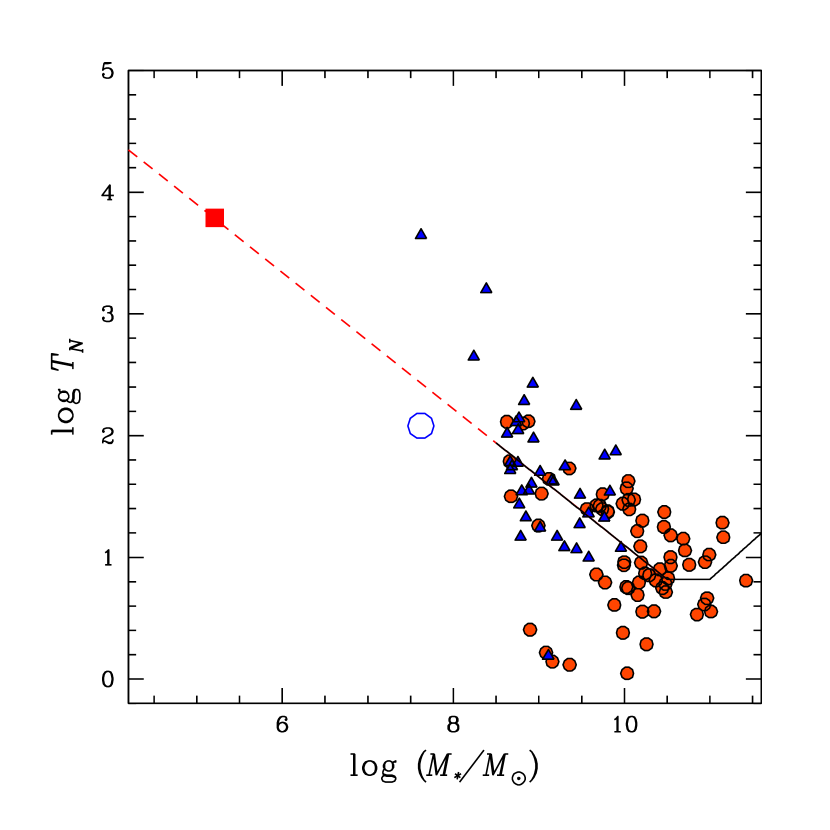
Crnojević et al. (2016) confirm the existence of a GC in Eridanus II (Eri II) by matching color-magnitude diagrams (CMDs) for the GC and Eri II, thereby identifying the systems as coincident in 3-D, and measuring a size and luminosity for the GC that are within the ranges of MW outer halo GCs ( and pc). The cluster CMD is consistent with that of Eri II, which is itself consistent with a 10 Gyr isochrone. The GC in Eri II (Koposov et al., 2015; Crnojević et al., 2016) prompts a re-evaluation of the questions posed above and provides important empirical grounding for various arguments. First, Eri II and its GC extend the stellar mass, , lower bound of MW subhalos that can host GCs by about two orders of magnitude. As such, the specific frequency, defined as the normalized number of GCs per 10 of stellar mass (), is extremely high for this galaxy (Figure 1) and proves by example that subhalos of low total mass, in this case, can host GCs. Second, the system constrains the GC specific frequency in low mass halos, which in turn enables an empirically-based, quantitative treatment of the problem. Third, the system proves by example that GCs can survive as a recognizable GC within such subhalos for a Hubble time. In this Letter we explore the implications of the Eri II GC using a simple, empirically-constrained model of the incidence of GCs within subhalos to determine whether we should expect subhalos to host some MW GCs. We close by noting that Crnojević et al. (2016) provide a strong upper limit on the Eri II HI content and do not find evidence for a young stellar population. As such, even though Eri II is currently at a large Galctocentric distance ( 370 kpc), it may not be too dissimilar to other nearer MW satellites and is perhaps not on its initial infall.
2. Results
Our data come from the study of Eri II (Bechtol et al., 2015; Koposov et al., 2015; Crnojević et al., 2016), the compilation of Local Group dwarf properties (McConnachie, 2012, and references therein), and the study of GC populations in early-type (Zaritsky et al., 2015) and late-type (Zaritsky et al., 2016) galaxies in the S4G survey (Sheth et al., 2010).
To calculate specific frequencies as defined most commonly in the literature, we require the number of GCs hosted by a galaxy and either that galaxy’s luminosity, , or . We focus on the -normalized version of the specific frequency, . For Eri II, we use the published value of ( ; Bechtol et al., 2015). To compare Fornax to Eri II, we calculate the implicit value of in the Bechtol et al. (2015) study, 1.1 in solar units, and use that value to convert the available Fornax V-band magnitude ( mag; McConnachie, 2012) to . To then place these estimates of , which are based on a Chabrier initial mass function (IMF), on the same system as those from S4G, which are based on a Salpeter IMF (Eskew et al., 2012), we double the estimates for Eri II and Fornax. Our discussion depends only on relative values of , so the choice of IMF is irrelevant to the degree that a universal IMF holds.
In Figure 1, we reproduce the plot of vs. host from Zaritsky et al. (2016) but expand the range to include Eri II. The Figure combines a) an existing datum for the Fornax dwarf Spheroidal, b) early- and late-type host galaxy results, c) a fit to those results for and extrapolation to higher based principally on the observations of Peng et al. (2008) (see Zaritsky et al., 2016, for details)), and d) the new results that include the Eri II datum and a linear extrapolation of the previously published fit extending to lower . The extrapolation of the previous fit falls nearly exactly on the position of Eri II, suggesting that the GC populations in low- galaxies follow the trends established using high- ones.
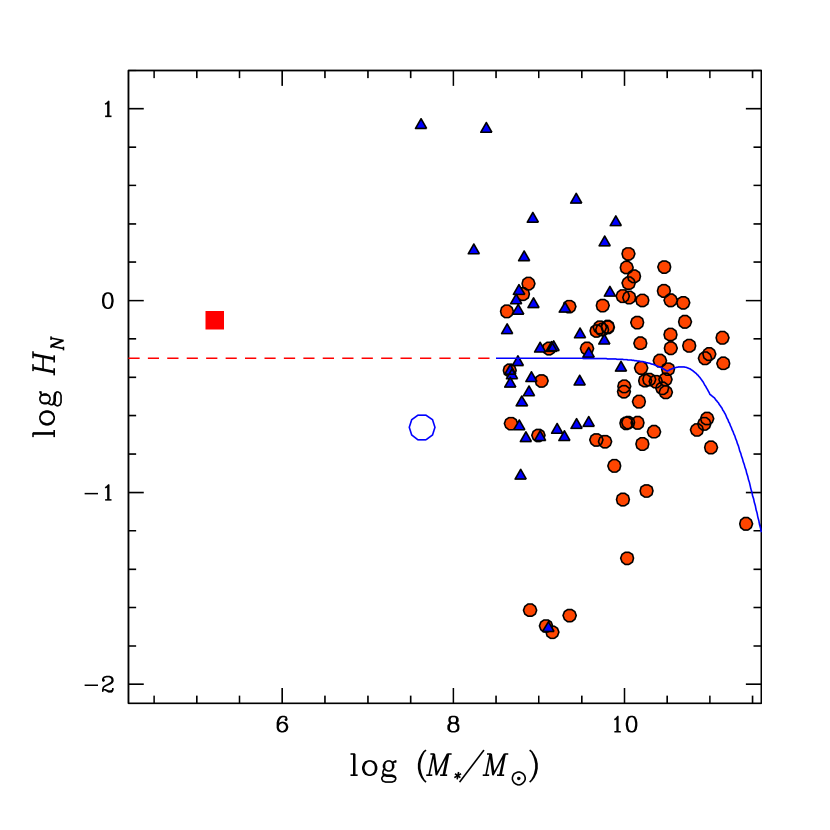
Utilizing a large compilation of GC studies, Harris et al. (2013) explored normalizing the GC number by host galaxy total mass rather than by stellar mass, following previous suggestions that either the total baryon or halo mass is the more physically-relevant parameter (Blakeslee, 1997; McLaughlin, 1999; Spitler et al., 2008). We adopt this idea in Figure 2, utilizing the functional form of the stellar mass - halo mass relation provided by Behroozi et al. (2010) (correcting for the different adopted IMF and extending the relation beyond the mass range over which it is calibrated) to calculate the halo-mass-normalized GC specific frequency, which we name and express in units of number per , for all of the galaxies and the model shown in Figure 1.
is strikingly constant for . Of course, this result depends on the nature of the stellar mass-halo mass function, which has sizable uncertainties even within the well-calibrated regime (Behroozi et al., 2010), but we ourselves have not had any tuning freedom in reaching this result. As found for more massive galaxies (e.g. Blakeslee, 1997; McLaughlin, 1999; Harris et al., 2013) and in simulations (Kravtsov & Gnedin, 2005), the GC population closely tracks the overall halo mass.
Although the two low-mass MW satellites that host at least one globular cluster fall tantalizingly close to the model extrapolation, there are 8 other known MW satellites that have stellar masses greater than that of Eri II and less than that of Fornax that do not host GCs. The lack of GCs in these systems does not necessarily invalidate the extrapolated model. First, because the number of GCs in any of these galaxies is small, only some subhalos, by chance, should be expected to host GCs. Second, additional physical effects might shape the GC population. For example, some GCs might be tidally disrupted within their host subhalo or stripped away from their host subhalo by the MW’s tidal field. Indeed the situation is likely to be quite complicated at small Galactocentric radii where both the clusters and subhalos will experience significant tidal forces and Galactic orbital times are shorter. Therefore, we focus our discussion on the outer MW halo, but the appropriate choice for the lower radial bound to use in defining the outer halo is unclear. Given that the cluster NGC 1851 appears to lie within an extended stellar population of the type of interest here (Olszewski et al., 2009) and lies at a Galactocentric radius, , of 16.6 kpc, there could be hosted clusters at Galactocentric radii as small as 15 kpc.
We caution that detailed comparison between the data and models are premature. Our census of clusters similar to that in Eri II is woefully incomplete beyond 130 kpc (Koposov et al., 2008). More GCs with characteristics similar to that of the GC in Eri II ( and pc) have been discovered in the past few years (see Drlica-Wagner et al., 2015) than are in the Harris (1996) compilation. Our calculation is merely a plausibility argument and significant further work is necessary to transform this into a detailed comparison with discriminatory power.
3. Discussion
To enable progress, we explore a simple Poissonian model. There are of course highly plausible reasons why Poisson statistics may be inappropriate, for example it may be that the existence of a first cluster naturally inhibits the formation of a second cluster. Nevertheless, given our ignorance, we adopt the simple Poissonian model and use the current data to set the one parameter that defines a Poisson distribution. Adopting a mean value of , , we then realize the number of GCs in any subhalo by drawing from a Poisson distribution, where the mean number of GCs in a subhalo of mass is simply , where is in units of .
The key to this model lies in determining . We cannot simply adopt as measured for Eri II or Fornax because of the 8 other systems in this mass range that do not host GCs. Instead, we adopt the range of for which we expect to find 1) a system with the halo mass of Eri II that has at least one GC, 2) a system like Fornax with 5 or fewer GCs, and 3) zero GCs in at least 8 of the 10 MW satellite galaxies in this mass range. This approach implicitly assumes that is independent of halo mass for the halo mass range bracketed by Eri II and Fornax. The results from Monte Carlo simulations are presented in Figure 3. The Eri II and Fornax requirements provide upper and lower bounds on , (90% confidence limits). The additional constraint from the large fraction of satellites without GCs allows only for a small region around . However, because we cannot be certain that physical processes have not removed or destroyed GCs in some of these satellites, we do not advocate for the calculated tight constraint around . Instead, we only explore the ramifications of .
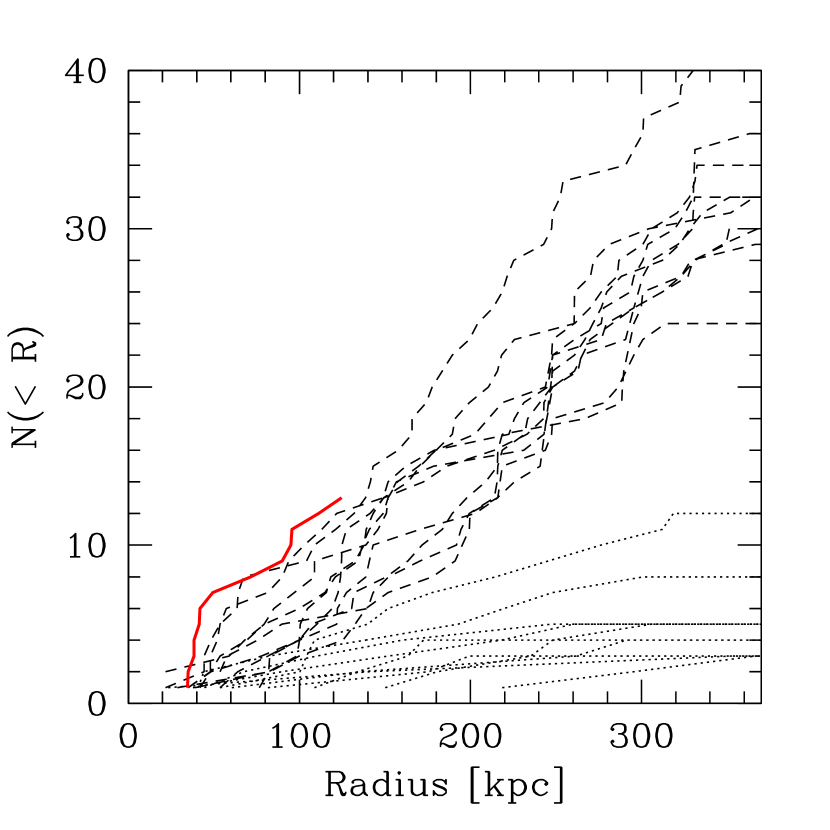
Can some of the outer halo MW GCs lie within subhalos with masses as small or smaller than that of the known ultrafaint galaxies? The necessary calculation is fraught with various uncertainties and so the following is principally a plausibility argument. We begin by adopting the subhalo distribution from the Via Lactea simulations (Madau et al., 2008; Diemand et al., 2007) for and a Galactocentric radius less than that of Eri II (370 kpc). We then use our Poisson model and random realizations to calculate the number of GCs found in subhalos of a given mass. From a set of realizations of this Poissonian model, we find that for the range of , subhalos out to a radius of 370 kpc host between 5 and 31 GCs, respectively (Figure 4).
Straightforwardly, our simple model appears to account for a significant fraction of the outer halo MW GC population. If we consider only the radial range over which our model predicts hosted GCs ( kpc) out to the outermost cluster in the Harris (1996) compilation ( kpc), then that sample contains 13 clusters and compares favorably with the upper branch of the modeled distribution of clusters in Figure 4. However, we caution against strong inferences from the current quantitative comparisons. As the discovery of the GC in Eri II demonstrates, there may be GCs at large that are yet to be discovered. The majority of GCs similar to the one in Eri II ( and pc) have been discovered over the last few years and have a Galactocentric distance distribution that is markedly different than that of the previously known GCs (Drlica-Wagner et al., 2015). Specifically, only 10% of the GCs in the Harris (1996) compilation lie beyond 30 kpc, while 70% (5/7) of the new GCs in this class do. The reason for this is evident in the completeness simulations of Koposov et al. (2008) when one considers that the newer clusters are significantly less luminous than most in the Harris (1996) compilation. In addition, various model parameters are poorly constrained. varies by a factor of 6 and the subhalo bound mass fraction from simulations is not a detailed match to the MW, where the LMC alone accounts for a 25% subhalo mass fraction (Peñarrubia et al., 2016).
About 90% of the hosted GCs in our model are in subhalos with an smaller than that of Eri II. As the image in Crnojević et al. (2016) makes clear, the globular cluster is of higher surface brightness, and therefore easier to identify, than the underlying galaxy. It is not a great leap of imagination to conjure systems where the underlying stellar population is below the detection limit while the globular cluster is not. In fact, the stellar halo found surrounding NGC 1851 (Olszewski et al., 2009), may be one example, the newly discovered Crater 2 dwarf and its potential globular cluster (Torrealba et al., 2016) another, and the large incidence of extratidal stars around inner halo MW GCs may point to the relics of such systems(Carballo-Bello et al., 2014). However, concluding that outer halo GCs could be hosted, is not the same as concluding that they are hosted. Deep observations will be necessary to determine if there are large-scale underlying stellar populations surrounding many outer halo GCs.

Another significant challenge to this model might appear to be the dynamical constraints on dark matter in GCs (e.g. Conroy et al., 2011). However, detailed modeling, such as that by Conroy et al. (2011), has been carried out on only a handful of GCs. A similar handful of GCs, those in Fornax and Eri II, are almost certainly example of clusters that lie within a dark matter subhalo. We conclude that neither subset can be used as motivation for a blanket statement about the properties of all GCs.
Our scenario is quite different than that advocated by some (e.g. Kravtsov & Gnedin, 2005; Kruijssen, 2015), where the GCs form in high density, star forming disks at high redshifts and mergers redistribute the GCs into the galaxy halos. However, the models are not mutually exclusive. There are both kinematic and photometric distinctions within GC populations that hint at multiple formation paths (Brodie & Strader, 2006; Da Costa et al., 2009).
4. Summary
The existence of one globular cluster (GC) in one of the ultrafaint MW satellites (Eri II) motivates our examination of how GCs populate low-mass subhalos. Using the Behroozi et al. (2010) stellar mass - halo mass function, we estimate the halo mass of Eri II and the Fornax dSph and find that the total-mass-normalized frequency of GCs in these two galaxies is consistent with that measured for much more massive galaxies. This result suggests that the mean, mass normalized, GC frequency can be roughly extended to MW subhalos. For quantitative purposes, we use the observed GC incidence in Eri II and Fornax, and the lack of GCs in 8 other systems with comparable masses, to place bounds on the total-mass-normalized GC specific frequency, , where the scaling is in terms of GCs per . We calculate that subhalos with , which in simulations contain as much as 10% of the MW halo mass (Madau et al., 2008), may host somewhere between 5 and 31 GCs. The order of magnitude agreement with the observed number of outer halo MW GCs demonstrates the plausibility of this model and suggests that some GCs may be hosted by yet undetected subhalos with extremely modest stellar populations. The model further predicts that 90% of the subhalos that host these GCs are of lower mass than that of Eri II, suggesting that host galaxy stellar populations will be difficult to detect. One such case may already be known (NGC 1851; Olszewski et al., 2009) and examples where similar systems may have been tidally disturbed are increasingly common (Carballo-Bello et al., 2014; Torrealba et al., 2016).
In closing, we encourage theorists to consider the effect that a hosting subhalo could have on a variety of long-standing questions regarding GCs and observers to revisit GCs when searching for the diffuse underlying stellar populations of ultrafaint galaxies.
References
- Bechtol et al. (2015) Bechtol, K., Drlica-Wagner, A., Balbinot, E., et al. 2015, ApJ, 807, 50
- Behroozi et al. (2010) Behroozi, P.S., Conroy, C., & Wechsler, R.H. 2010, ApJ, 717, 379
- Bekki (2011) Bekki, K., 2011, MNRAS, 412, 2241
- Bekki et al. (2008) Bekki, K., Yahagi, H., Nagashima, M., & Forbes, D.A. 2008, MNRAS, 387, 1131
- Blakeslee (1997) Blakeslee, J.P. 1997, ApJ, 481, L59
- Brodie & Strader (2006) Brodie, J.P., & Strader, J. 2006, Ann. Rev. Astron. & Astroph., 44 193
- Carballo-Bello et al. (2014) Carballo-Bello, J.A., Sollima, A., Martinez-Delgado, D., et al. 2014, MNRAS, 445, 2971
- Conroy et al. (2011) Conroy, C., Loeb, A., & Spergel, D.N. 2011, ApJ, 741, 72
- Crane et al. (2003) Crane, J.D., Majewski, S.R., Rocha-Pinto, H.J., Frinchaboy, P.M., Skrutskie, M.F., & Law, D.R. 2003, ApJ, 594, 119
- Crnojević et al. (2016) Crnojević, D., Sand, D.J., Zaritsky, D., Spekkens, K., Willman, B., & Hargis, J.R. 2016, in prep.
- Eskew et al. (2012) Eskew, M., Zaritsky, D., & Meidt, S. 2012, AJ, 143 139
- Da Costa et al. (2009) Da Costa, G.S., Grebel, E.K., Jerjen, H., Rejkuba, M., & Sharina, M.E. 2009, AJ, 137, 4361
- Diemand et al. (2007) Diemand, J., Kuhlen, M., & Madau, P. 2007, ApJ, 657, 252
- Drlica-Wagner et al. (2015) Drlica-Wagner, A., Bechtol, K., Rykoff, E.S., et al. (2015), ApJ, 813, 109
- Harris (1996) Harris, W.E., 1996, AJ, 112, 1487
- Harris et al. (2013) Harris, W.E., Harris, G.L.H., & Alessi, M. 2013, ApJ, 772, 82
- Harris et al. (2015) Harris, W.E., Harris, G.L, & Hudson, M.J. 2015, ApJ, 806, 36
- Hudson, et al. (2014) Hudson, M.J., Harris, G.L., & Harris, W.E. 2014, ApJ, 787, 5
- Ibata et al. (1995) Ibata, R.A., Gilmore, G., & Irwin, M.J. 1995, MNRAS, 277, 781
- King (1966) King, I.R. 1966, AJ, 71, 64
- Koposov et al. (2008) Koposov, S.E., Belokurov, V., Evans, N.W., et al. 2008, ApJ, 686
- Koposov et al. (2015) Koposov, S.E., Belokurov, V., Torrealba, G., & Evans, N.W. 2015, ApJ, 805, 130
- Kravtsov (2010) Kravtsov, A. 2010, Advances in Astronomy, 8
- Kravtsov & Gnedin (2005) Kravtsov, A.V., & Gnedin, O.Y. 2005, ApJ, 623, 650
- Kruijssen (2015) Kruijssen, J.M.D. 2015, MNRAS, 454, 1658
- Li et al. (2015) Li, T.S., Balbinot, E., Mondrik, N., et al. 2015, arXiv:1509:04296
- Mackey et al. (2010) Mackey, A.D., Huxor, A.P., Ferguson, A.M.N., et al. 2010, ApJ,l, 717, 11
- Madau et al. (2008) Madau, P., Diemand, J., Kuhlen, M. 2008, ApJ, 679, 1260
- Martin et al. (2004) Martin, N.F., Ibata, R.A., Bellazzini, M., Irwin, M.J., Lewis, G.F., & Dehnen, W. 2004, MNRAS, 348, 12
- McConnachie (2012) McConnachie, A. 2012, AJ, 144, 4
- McLaughlin (1999) McLaughlin, D.E. 1999, AJ, 117, 2398
- Michie (1963) Michie, R.W. 1963, MNRAS, 125, 127
- Moore et al. (2006) Moore, B., Diemand, J., Madau, P., Zemp, M., & Stadel, J. 2006, MNRAS, 368, 563
- Olszewski et al. (2009) Olszewski, E.W., Saha, A., Knezek, P., et al. 2009, AJ, 138, 1570
- Peebles (1984) Peebles, P.J.E. 1984, ApJ, 277, 470
- Peñarrubia et al. (2016) Peñarrubia, J., Gómez, F.A., Besla, G., Erkal, D., & Ma, Y.-Z. 2016, MNRAS, 456, 54
- Peng et al. (2008) Peng, E., Jordán, A., Côté, P. et al. 2008, ApJ, 681, 197
- Sheth et al. (2010) Sheth, K. et al. 2010, PASP, 122, 1397
- Spitler et al. (2008) Spitler, L.R., Forbes, D.A., Strader, J., Brodie, J.P., & Gallagher, J.S., 2008, MNRAS, 385, 361
- Torrealba et al. (2016) Torrealba, G., Koposov, S.E., Belokurov, V., & Irwin, M. 2016, arXiv:1601.07178
- Veljanoski et al. (2014) Veljanoski, J., Mackey, A.D., Ferguson, A.M.N. et al. 2014, MNRAS, 442, 2929
- Zaritsky et al. (2015) Zaritsky, D., et al. 2015, ApJ, 799, 159
- Zaritsky et al. (2016) Zaritsky, D., et al. 2016, ApJ, 818, 99