Deep imaging of Eridanus II and its lone star cluster**affiliation: This paper includes data gathered with the 6.5 meter Magellan Telescopes at Las Campanas Observatory, Chile.
Abstract
We present deep imaging of the most distant dwarf discovered by the Dark Energy Survey, Eridanus II (Eri II). Our Magellan/Megacam stellar photometry reaches mag deeper than previous work, and allows us to confirm the presence of a stellar cluster whose position is consistent with Eri II’s center. This makes Eri II, at , the least luminous galaxy known to host a (possibly central) cluster. The cluster is partially resolved, and at it accounts for of Eri II’s luminosity. We derive updated structural parameters for Eri II, which has a half-light radius of pc and is elongated (), at a measured distance of kpc. The color-magnitude diagram displays a blue, extended horizontal branch, as well as a less populated red horizontal branch. A central concentration of stars brighter than the old main sequence turnoff hints at a possible intermediate-age ( Gyr) population; alternatively, these sources could be blue straggler stars. A deep Green Bank Telescope observation of Eri II reveals no associated atomic gas.
Subject headings:
galaxies: individual (Eridanus II) — galaxies: dwarf — galaxies: stellar content — galaxies: photometry1. Introduction
The last several years have seen another burst of discovery of Milky Way (MW) satellites from ATLAS (Belokurov et al. 2014; Torrealba et al. 2016), the Panoramic Survey Telescope & Rapid Response System (Pan-STARRS; Laevens et al. 2015a, b), the Dark Energy Survey (DES; Bechtol et al. 2015; Koposov et al. 2015; Drlica-Wagner et al. 2015) and the Dark Energy Camera more generally (Kim et al. 2015; Kim & Jerjen 2015; Martin et al. 2015).
The most distant of the new satellites is Eridanus II (Eri II), at 350 kpc and mag, which was discovered simultaneously by two groups (Bechtol et al. 2015; Koposov et al. 2015). The distance to Eri II roughly corresponds to the virial radius of the MW (300 kpc; e.g. Klypin et al. 2002): this places Eri II near the transition radius between those dwarf spheroidals (with 300 kpc), which appear to have lost their primordial gas, and more distant dwarfs which generally retain HI gas reservoirs (e.g. Spekkens et al. 2014). The properties of Eri II suggest that it may be similar to Leo T, another recently discovered dwarf just beyond the virial radius of the MW (410 kpc, ; de Jong et al. 2008), which displays a significant HI gas reservoir (Ryan-Weber et al. 2008) and has undergone multiple epochs of star formation (de Jong et al. 2008; Weisz et al. 2012). Additionally, Koposov et al. (2015) tentatively suggested that Eri II may have a globular cluster, which would make it the smallest known galaxy with its own star cluster.
Motivated by the hints that set Eri II apart from the bulk of the new MW satellites, we obtained deep photometric and HI observations to further study its physical properties. In Section 2, we describe the optical Magellan/Megacam observations, as well as our stellar photometry. In Section 3 we present the color-magnitude diagram (CMD) of Eri II and its stellar populations, we derive updated values for its distance, structural parameters, luminosity and HI gas content, and we describe the properties of its stellar cluster. We discuss and conclude in Section 4.
2. Data reduction and photometry
Eri II was observed on 2015 October 12 (UT) with the Megacam imager (McLeod et al. 2015) on the Magellan Clay telescope. Megacam has a field-of-view and a binned pixel scale of 016. The seeing was 09 and 06 for the - and -band, respectively. We took 14 300 sec exposures in -band and 6 300 sec exposures in -band, which were dithered to fill in the gaps between the CCDs. The data were reduced using the Megacam pipeline at the Smithsonian Astrophysical Observatory Telescope Data Center.
We perform point spread function fitting photometry on each of the stacked final images, using the suite of programs DAOPHOT and ALLFRAME (Stetson 1994), and following the procedure described in Crnojević et al. (2016). To calibrate our data, we used the AAVSO Photometric All-Sky Survey (APASS; Henden et al. 2012) - and -band photometry and cross-matched it with short (60 sec) Eri II exposures, propagating the derived zeropoints and color terms to the longer science exposures. The calibrated catalogues were corrected for Galactic extinction (Schlegel et al. 1998; Schlafly & Finkbeiner 2011) star by star (the average extinction across the image is mag), and we present dereddened and magnitudes throughout this work.
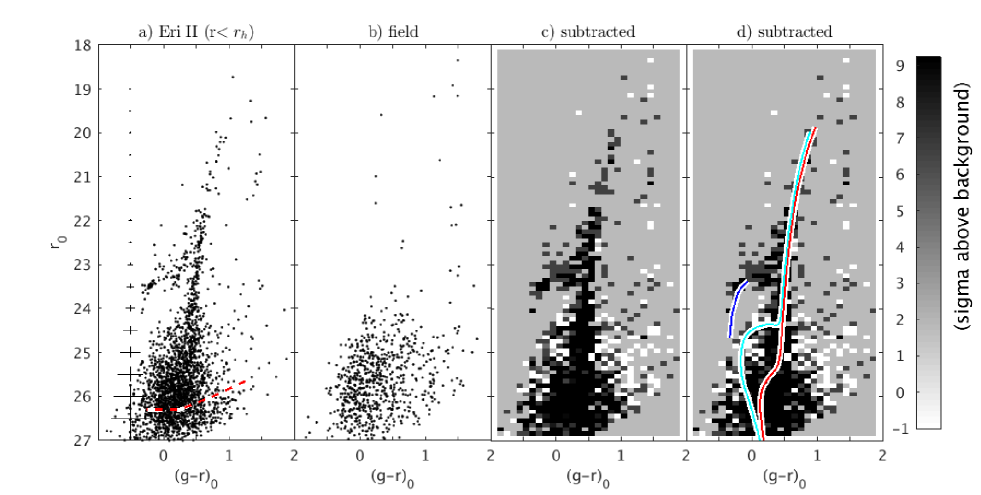
We performed a series of artificial star tests to determine our photometric errors and completeness as a function of magnitude and color. Over many experiments, we injected 10 times the number of artificial stars into our data as were detected in the unaltered images. The artificial stars were homogeneously distributed across the field-of-view, with a color-magnitude distribution similar to that of the observed sources, but extending 2 magnitudes fainter. The photometry of the images with artificial star injections was derived exactly in the same way as for the real data. The color-averaged completeness limits are 26 and 26.6 mag. In Fig. 1, we present the CMD of Eri II, along with our derived photometric errors and completeness limits.
3. Analysis
The CMD for sources within Eri II’s half-light radius () is presented in Fig. 1, along with a background CMD derived from two regions of identical size located away from Eri II. Our CMD reaches mag deeper than the discovery data (Bechtol et al. 2015; Koposov et al. 2015).
3.1. Stellar populations
Eri II is not simply a single old and metal poor stellar population, in contrast to many of the new, faint satellites of the MW (Brown et al. 2014). The color and slope of the RGB and the blue extent of the extended horizontal branch (HB; Fig. 1) are characteristic of old, metal-poor ( Gyr, [Fe/H]) populations such as those in globular clusters or ultra-faint dwarfs. The HB is not purely blue, but has a red HB (RHB) portion as well: while this can be a feature of old and metal-rich populations, the RGB slope of Eri II seems to exclude the presence of significantly enriched stars. Alternatively, the RHB could arise from a metal-poor population marginally younger ( Gyr) than the oldest one, or as a second parameter effect (Salaris & Cassisi 2005). The objects between the BHB and the RHB at a range of magnitudes are candidate RR Lyrae stars.
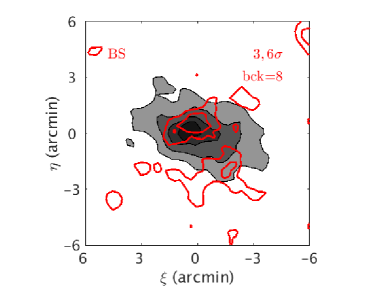
We consider the Hess diagram for the field-subtracted CMD (Fig. 1): an excess of sources is present above the subgiant branch portion of the old isochrone, around and . This feature is well fit by a Gyr and [Fe/H] isochrone (panel d of Fig. 1), or alternatively by a Gyr population as metal-poor as the old RGB. A significantly younger and more metal-rich population can be ruled out, since it would produce a RGB redder than observed; similarly, for older ages the turnoff would be too faint to match the observed one. We cannot exclude the possibility that these are, at least in part, blue straggler (BS) stars arising from binary systems, which can mimic intermediate-age populations (for a discussion about the “blue plume” in faint MW satellites see Sand et al. 2010; Santana et al. 2013; Weisz et al. 2015). The ratio of the number of candidate BS stars to the number of blue HB (BHB) stars (computed following Deason et al. 2015) is , consistent with empirical values derived for dwarf galaxies with luminosities similar to Eri II (e.g., Deason et al. 2015). This supports the BS interpretation for these stars.
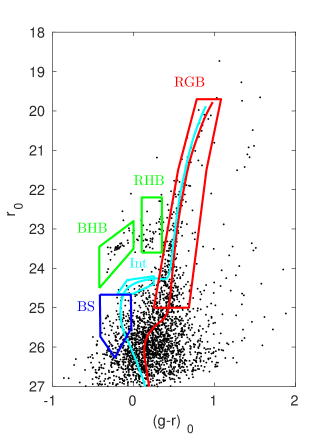
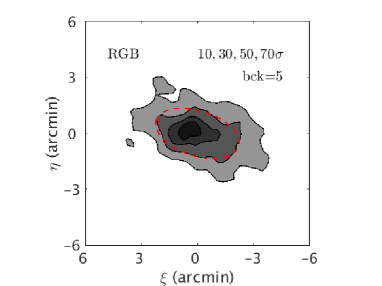
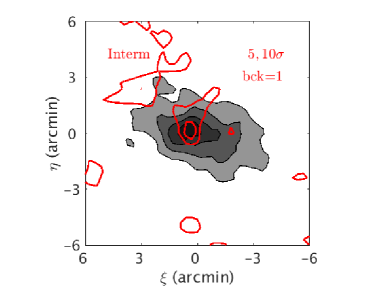
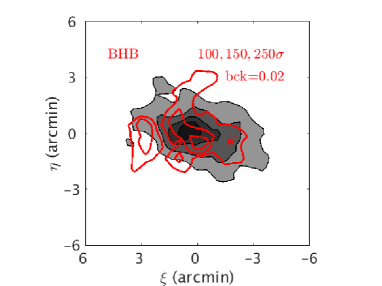
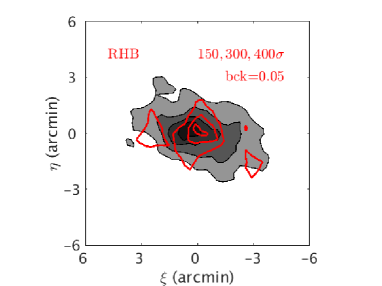
We select different CMD populations as shown in Fig. 2, and draw their spatial distribution (as density maps) in Fig. 3. RGB stars present a regular and elongated shape, with no clear signs of disturbance. Intermediate-age stars produce a very noisy stellar density map but have a significant overdensity at the center of Eri II. The map for candidate BS stars is similarly noisy, but it still shows a possible central concentration, which would favor the intermediate-age population interpretation (BS binary systems are expected to have a spatial distribution similar to that of the old population). The BHB and RHB maps have a very high significance above the field level; the BHB sample’s highest overdensity is slightly offset from Eri II’s center.
Koposov et al. (2015) suggested that Eri II possesses a young stellar population component ( Myr) based on the presence of a few stars blueward of the RGB’s bright end (at and ). If these were truly young stars, we would detect sources along the main sequence portion (around ) of the young isochrone plotted in Fig. 16 of Koposov et al. (2015), but we do not observe these in our dataset.
3.2. Distance
We rederive the distance to Eri II from the luminosity of its BHB (e.g., Sand et al. 2012). We adopt the fiducial HB sequence for M92 from Bernard et al. (2014), and convert the Pan-STARRS1 magnitudes into the SDSS system following Tonry et al. (2012). While we adopt the nominal M92 distance value reported by Bernard et al. (2014) (, from Harris 2010), other studies have measured slightly different values, as high as (see di Cecco et al. 2010), but they are all within their respective errors. We thus adopt an M92 distance uncertainty of , which is the major source of error in our measurement. We perform a least-squares fitting of the M92 HB fiducial to Eri II’s BHB, and we find a best-fit value of , corresponding to a distance of Mpc. This is consistent with the results of Koposov et al. (2015).
3.3. Structural properties and luminosity
We re-determine structural parameters for Eri II with the same maximum likelihood technique utilized for most of the other Local Group (LG) dwarfs (Martin et al. 2008; Sand et al. 2012). RGB stars were included in our structural analysis; we did not explicitly include the HB or potential younger stellar population, although any true younger stellar population would inevitably have RGB stars that would also be included. We did not mask the central star cluster for our structural analysis, although a separate calculation with the star cluster masked out led to structural parameters within 1- of the original. The free parameters of our exponential profile plus constant background fit were: central position, position angle, ellipticity, and background surface density (results are reported in Table 1). Uncertainties were determined by bootstrap resampling the data 1000 times, recalculating the structural parameters for each resample.
Eri II’s surface brightness profile is well fit by an exponential with pc, and its ellipticity is high (), similar to other faint MW satellites (Sand et al. 2012). The central surface brightness is derived from the total luminosity (see below), and the ellipticity, and it is mag/arcsec2. While most of the derived parameters are in line with the discovery results, our is higher by a factor of : deep follow-up photometric studies often lead to increased values with respect to shallower datasets (e.g. Crnojević et al. 2014a).
Given the likely presence of two subpopulations, we derive the absolute magnitude of Eri II as follows. We derive the completeness-corrected and field-subtracted luminosity for each subpopulation by summing the flux of stars in a magnitude range where the corresponding isochrones do not overlap within the observational errors ( for the intermediate-age population and for the older population). The luminosity is computed within and then multiplied by two. We extrapolate the total luminosity given by each component starting from the fraction of light contributed in the selected magnitude ranges, as estimated from theoretical luminosity functions from Dotter et al. (2008). These are constructed with a Salpeter initial mass function, one for a 10 Gyr, [Fe/H] population and the other for a 3 Gyr, [Fe/H] population. The luminosities associated with the subpopulations are and : the intermediate-age population contributes of Eri II’s light, and only a few percent of its stellar mass. The total absolute magnitude for Eri II is (the -band magnitude was obtained using the Jester et al. 2005 transformations), which is between the values reported by Bechtol et al. (2015) and Koposov et al. (2015). In case the stars brighter than the old subgiant branch had a BS component, the absolute magnitude of Eri II would not significantly change, given their small number.
3.4. HI gas content
To constrain the HI content of Eri II, we obtained position-switched HI observations (AGBT-16A-186; PI: Spekkens) on the Robert C. Byrd Green Bank Telescope (GBT) on 2016 Feb 23. In the range and – encompassing possible HI recessional velocities of MW satellites that do not overlap with the MW HI emission itself along the Eri II line of sight – the GBT spectrum has an rms noise mJy at a spectral resolution of . We do not find any HI emission in this velocity range within the GBT beam at this frequency. Combining this non-detection with the distance and luminosity values derived above, a putative HI counterpart has a 5, HI mass upper limit of out to , and therefore ; this constraint is a factor of 7 more stringent than that derived by Westmeier et al. (2015) using HIPASS data. Eri II is therefore extremely gas-poor, similar to other dwarf spheroidal galaxies in the Local Volume (Grcevich & Putman 2009; Spekkens et al. 2014).
3.5. The central star cluster
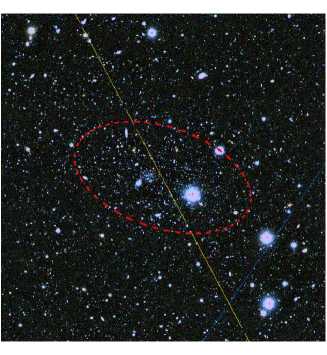
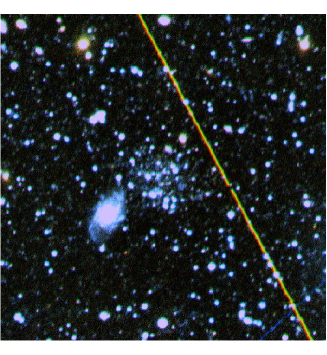
A dense collection of stars near Eri II’s center stand out from the overall diffuse nature of the dwarf (Fig. 4; see also Koposov et al. 2015). This likely star cluster makes Eri II, at mag, by far the least luminous dwarf galaxy to host such an object. The position of the cluster is nearly at the calculated center of Eri II ( pc off-center in projection), and within its uncertainties (see Tab. 1). Small offsets between centrally-located clusters and the exact center of their parent dwarf galaxy are commonly observed (e.g., Georgiev et al. 2009), so we plausibly consider this as a candidate nuclear star cluster, more specifically the only one known within such a faint galaxy.
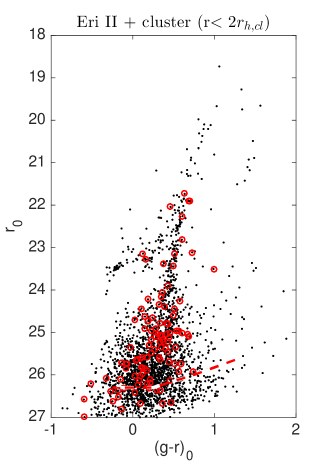
In Fig. 4, we overlay on Eri II’s CMD the stars contained within twice the of its cluster (see below). The center of the cluster was computed iteratively as the average of the stellar positions within circles of decreasing radius. Since the cluster is only partially resolved, its CMD is poorly populated, but still consistent with Eri II’s CMD. To test this, we randomly draw 1000 sub-CMDs with the same number of sources as in the cluster from Eri II’s CMD: the results resemble the cluster’s CMD, and of the realizations also lack a BHB. We compute the cluster’s properties via integrated photometry, assuming a circular radius (the cluster is visually round). The surface brightness profile for the cluster is derived after masking bright stars and background galaxies, and is then fit with a Sersic profile (best-fit values are reported in Tab. 1). The absolute magnitude is derived by integrating the best-fit Sersic profile and is at the distance of Eri II, which contributes to of its host’s luminosity. We discuss the properties of the cluster in the next section.
| Parameter | Eri II | Cluster |
|---|---|---|
| RA (h:m:s) | 03:44:20.1” | 03:44:22.2” |
| Dec (d:m:s) | :32:01.7” | :31:59.2” |
| (mag) | – | |
| D (kpc) | – | |
| – | ||
| PA (N to E; o) | – | |
| (arcmin) | ||
| (pc) | ||
| (Sersic index) | ||
| (mag/arcsec2) | ||
| (mag) | ||
| (mag) | ||
| () | – |
4. Discussion and conclusions
We have presented deep Magellan/Megacam photometric follow-up observations of Eri II, and derived improved distance, structural properties, and luminosity measurements. At a distance of kpc, Eri II is just beyond the estimated MW virial radius, where most dwarfs show signs of neutral gas/recent star formation. However, Eri II is not currently forming stars (based on the lack of a blue main sequence), unlike the two gas-rich dwarfs found at a similar Galactocentric distance, Leo T (; e.g., Weisz et al. 2012) and Phoenix (; e.g., Battaglia et al. 2012). Our follow-up GBT observations reveal that Eri II is extremely gas-poor. This suggests that it is not on first infall and may have already interacted with the MW. The stellar distribution shows no signs of disruption down to the current photometric depth, disfavoring tidal interactions. Rather, the stellar and gas properties of Eri II are consistent with a ram pressure stripping scenario in which its gas reservoir was swept away by the MW’s coronal gas during a previous pericentric passage (e.g., Gatto et al. 2013).
At , Eri II is the faintest dwarf galaxy known to host a stellar cluster, consistent with being at the center of its host. Compared to the LG’s globular clusters, Eri II’s cluster would be one of the faintest objects at its value, and its absolute magnitude and place it in a similar parameter space to the least luminous and most compact MW ultra-faint dwarfs. With pc, it can be regarded as an “extended” cluster: these are only observed at large galactocentric distances in M31, or in dwarf galaxies like NGC 6822 and Scl-dE1 (see Da Costa et al. 2009; Mackey et al. 2010). Such objects are believed to survive only within weak tidal fields (e.g., Hurley & Mackey 2010).
Is Eri II’s cluster a survivor? We compute its half-mass relaxation time based on our derived luminosity, assuming a mass-to-light ratio of , and obtain Gyr (e.g., Da Costa et al. 2009). Since the timescale for evaporation due to two-body relaxation is on the order of times this quantity, internal processes must not be relevant for our object, and the weak tidal field of Eri II likely does not contribute to a possible tidal truncation. A disruption could happen in presence of strong external tidal forces, however the lack of tidal features in Eri II and its large Galactocentric distance make this an unrealistic possibility.
Nuclear star clusters in dwarf galaxies likely form via inspiral due to dynamical friction, rather than being born in situ (see, e.g., den Brok et al. 2014), even though this interpretation is far from definitive. Around the MW and M31 only a handful of satellites host clusters, the faintest being Fornax () and And I (; McConnachie 2012), but none of these seem to be a nuclear star cluster. In Fornax, the presence of a globular cluster system and the lack of a nuclear cluster suggest that the dynamical friction timescale is prolonged by the existence of a cored, rather than cuspy, dark matter profile (Goerdt et al. 2006). Beyond the LG, a few dwarfs as faint as host candidate globular clusters (Da Costa et al. 2009; Georgiev et al. 2009); however, a deep study of the Fornax galaxy cluster found no galaxies with (out of a sample of ) with nuclear star clusters (Muñoz et al. 2015). Clearly, the cluster in Eri II is a rare event: this will be key to investigate the formation of clusters in such faint galaxies, and the modeling of its dynamical friction timescales may help constrain Eri II’s dark matter profile.
Why, finally, are there no other dwarfs fainter than with confirmed clusters? Zaritsky et al. (2016) suggest a scenario where at least a fraction of the outer halo Galactic clusters may in fact reside in extremely low stellar density subhalos (like Eri II), which have so far gone undetected. This uncharted territory certainly deserves further exploration and detailed modeling.
Acknowledgements
We thank the anonymous referee for their thoughtful suggestions, and Tom Maccarone for useful discussions. DJS acknowledges financial support from NSF grant AST-1412504; DZ acknowledges support from NSF AST-1311326; BW acknowledges support from NSF AST-1151462. This paper uses data products produced by the OIR Telescope Data Center, supported by the Smithsonian Astrophysical Observatory. The National Radio Astronomy operates the GBT, and is a facility of the NSF operated under cooperative agreement by Associated Universities, Inc.
References
- Battaglia et al. (2012) Battaglia, G., Rejkuba, M., Tolstoy, E., Irwin, M. J., & Beccari, G. 2012, MNRAS, 424, 1113
- Bechtol et al. (2015) Bechtol, K., Drlica-Wagner, A., Balbinot, E., et al. 2015, ApJ, 807, 50
- Belokurov et al. (2014) Belokurov, V., Irwin, M. J., Koposov, S. E., et al. 2014, MNRAS, 441, 2124
- Bernard et al. (2014) Bernard, E. J., Ferguson, A. M. N., Schlafly, E. F., et al. 2014, MNRAS, 442, 2999
- Bressan et al. (2012) Bressan, A., Marigo, P., Girardi, L., et al. 2012, MNRAS, 427, 127
- Brown et al. (2014) Brown, T. M., Tumlinson, J., Geha, M., et al. 2014, ApJ, 796, 91
- Crnojević et al. (2014a) Crnojević, D., Ferguson, A. M. N., Irwin, M. J., et al. 2014a, MNRAS, 445, 3862
- Crnojević et al. (2014b) Crnojević, D., Sand, D. J., Caldwell, N., et al. 2014b, ApJ, 795, L35
- Crnojević et al. (2016) Crnojević, D., Sand, D. J., Spekkens, K., et al. 2016, ApJ, 823, 19
- Da Costa et al. (2009) Da Costa, G. S., Grebel, E. K., Jerjen, H., Rejkuba, M., & Sharina, M. E. 2009, AJ, 137, 4361
- de Jong et al. (2008) de Jong, J. T. A., Harris, J., Coleman, M. G., et al. 2008, ApJ, 680, 1112
- Deason et al. (2015) Deason, A. J., Belokurov, V., & Weisz, D. R. 2015, MNRAS, 448, L77
- den Brok et al. (2014) den Brok, M., Peletier, R. F., Seth, A., et al. 2014, MNRAS, 445, 2385
- di Cecco et al. (2010) di Cecco, A., Becucci, R., Bono, G., et al. 2010, PASP, 122, 991
- Dotter et al. (2008) Dotter, A., Chaboyer, B., Jevremović, D., et al. 2008, ApJS, 178, 89
- Drlica-Wagner et al. (2015) Drlica-Wagner, A., Bechtol, K., Rykoff, E. S., et al. 2015, ApJ, 813, 109
- Gatto et al. (2013) Gatto, A., Fraternali, F., Read, J. I., et al. 2013, MNRAS, 433, 2749
- Georgiev et al. (2009) Georgiev, I. Y., Hilker, M., Puzia, T. H., Goudfrooij, P., & Baumgardt, H. 2009, MNRAS, 396, 1075
- Goerdt et al. (2006) Goerdt, T., Moore, B., Read, J. I., Stadel, J., & Zemp, M. 2006, MNRAS, 368, 1073
- Grcevich & Putman (2009) Grcevich, J., & Putman, M. E. 2009, ApJ, 696, 385
- Harris (2010) Harris, W. E. 2010, ArXiv e-prints, arXiv:1012.3224
- Henden et al. (2012) Henden, A. A., Levine, S. E., Terrell, D., Smith, T. C., & Welch, D. 2012, Journal of the American Association of Variable Star Observers (JAAVSO), 40, 430
- Hurley & Mackey (2010) Hurley, J. R., & Mackey, A. D. 2010, MNRAS, 408, 2353
- Jester et al. (2005) Jester, S., Schneider, D. P., Richards, G. T., et al. 2005, AJ, 130, 873
- Kim & Jerjen (2015) Kim, D., & Jerjen, H. 2015, ApJ, 808, L39
- Kim et al. (2015) Kim, D., Jerjen, H., Mackey, D., Da Costa, G. S., & Milone, A. P. 2015, ApJ, 804, L44
- Klypin et al. (2002) Klypin, A., Zhao, H., & Somerville, R. S. 2002, ApJ, 573, 597
- Koposov et al. (2015) Koposov, S. E., Belokurov, V., Torrealba, G., & Evans, N. W. 2015, ApJ, 805, 130
- Laevens et al. (2015a) Laevens, B. P. M., Martin, N. F., Ibata, R. A., et al. 2015a, ApJ, 802, L18
- Laevens et al. (2015b) Laevens, B. P. M., Martin, N. F., Bernard, E. J., et al. 2015b, ApJ, 813, 44
- Mackey et al. (2010) Mackey, A. D., Huxor, A. P., Ferguson, A. M. N., et al. 2010, ApJ, 717, L11
- Martin et al. (2008) Martin, N. F., de Jong, J. T. A., & Rix, H.-W. 2008, ApJ, 684, 1075
- Martin et al. (2015) Martin, N. F., Nidever, D. L., Besla, G., et al. 2015, ApJ, 804, L5
- McConnachie (2012) McConnachie, A. W. 2012, AJ, 144, 4
- McLeod et al. (2015) McLeod, B., Geary, J., Conroy, M., et al. 2015, PASP, 127, 366
- Muñoz et al. (2015) Muñoz, R. P., Eigenthaler, P., Puzia, T. H., et al. 2015, ApJ, 813, L15
- Ryan-Weber et al. (2008) Ryan-Weber, E. V., Begum, A., Oosterloo, T., et al. 2008, MNRAS, 384, 535
- Salaris & Cassisi (2005) Salaris, M., & Cassisi, S. 2005, Evolution of Stars and Stellar Populations, ed. Salaris, M. & Cassisi, S.
- Sand et al. (2010) Sand, D. J., Seth, A., Olszewski, E. W., et al. 2010, ApJ, 718, 530
- Sand et al. (2012) Sand, D. J., Strader, J., Willman, B., et al. 2012, ApJ, 756, 79
- Santana et al. (2013) Santana, F. A., Muñoz, R. R., Geha, M., et al. 2013, ApJ, 774, 106
- Schlafly & Finkbeiner (2011) Schlafly, E. F., & Finkbeiner, D. P. 2011, ApJ, 737, 103
- Schlegel et al. (1998) Schlegel, D. J., Finkbeiner, D. P., & Davis, M. 1998, ApJ, 500, 525
- Spekkens et al. (2014) Spekkens, K., Urbancic, N., Mason, B. S., Willman, B., & Aguirre, J. E. 2014, ApJ, 795, L5
- Stetson (1994) Stetson, P. B. 1994, PASP, 106, 250
- Tonry et al. (2012) Tonry, J. L., Stubbs, C. W., Lykke, K. R., et al. 2012, ApJ, 750, 99
- Torrealba et al. (2016) Torrealba, G., Koposov, S. E., Belokurov, V., & Irwin, M. 2016, MNRAS, in press
- Weisz et al. (2012) Weisz, D. R., Zucker, D. B., Dolphin, A. E., et al. 2012, ApJ, 748, 88
- Weisz et al. (2015) Weisz, D. R., Koposov, S. E., Dolphin, A. E., et al. 2015, ArXiv e-prints, arXiv:1510.08533
- Westmeier et al. (2015) Westmeier, T., Staveley-Smith, L., Calabretta, M., et al. 2015, MNRAS, 453, 338
- Zaritsky et al. (2016) Zaritsky, D., Crnojević, D., & Sand, D. J. 2016, ApJL, in press