Broadband Observations of High Redshift Blazars
Abstract
We present a multi-wavelength study of four high redshift blazars, S5 0014+81 (), CGRaBS J0225+1846 (), BZQ J1430+4205 (), and 3FGL J1656.23303 (), using the quasi-simultaneous data from Swift, NuSTAR, and Fermi-Large Area Telescope (LAT) and also the archival XMM-Newton observations. Other than 3FGL J1656.23303, none of the sources were known as -ray emitters and our analysis of 7.5 years of LAT data reveals the first time detection of the statistically significant -ray emission from CGRaBS J0225+1846. We generate the broadband spectral energy distributions (SED) of all the objects, centering at the epoch of NuSTAR observations and reproduce them using a one zone leptonic emission model. The opticalUV emission in all the objects can be explained by the radiation from the accretion disk, whereas, X-ray to -ray window of the SEDs are found to be dominated by the inverse Compton scattering off the broad line region photons. All of them host billion solar mass black holes. Comparing the accretion disk luminosity and the jet power of these sources with a large sample of blazars, we find them to occupy high disk luminosity-jet power regime. We also investigate the X-ray spectral properties of the sources in detail with a major focus on studying the causes of soft X-ray deficit, a feature generally seen in high redshift radio-loud quasars. We summarize that this feature could be explained based on the intrinsic curvature in the jet emission rather than due to external effects predicted in the earlier studies, such as host galaxy and/or warm absorption.
1 Introduction
Blazars constitutes a special class of radio-loud active galactic nuclei (AGN) in which the relativistic plasma shoots out from the central core of the galaxy, in the form of jets, towards the line of sight to the observer. The flux enhancement due to special relativity and their peculiar orientation (or so called relativistic beaming) makes blazars visible even at high redshifts (2) and thus they can be used to explore the young Universe. Blazars are classified as flat spectrum radio quasars (FSRQs) and BL Lac objects based on the rest-frame equivalent width (EW) of their broad optical emission lines, with FSRQs having EW5Å. Among blazars, FSRQs are known upto 5 (e.g., Romani et al., 2004).
The broadband spectral energy distribution (SED) of blazars exhibits a typical double hump structure that is generally explained in terms of synchrotron (covering from radio to UVX-rays) and inverse Compton (IC, contributing from X-rays to -rays) emission from a single population of energetic electrons present in the jet (e.g., Ghisellini et al., 1998). It has been found that with increasing luminosity the SED peaks shift to lower frequencies (Fossati et al., 1998). The shift of the synchrotron peak to lower energies leaves the accretion disk radiation (the big blue bump) naked and is observed in the optical-UV SEDs of many FSRQs (see, e.g., Sbarrato et al., 2013a). On the other hand, the shift of the high energy peak from GeV to MeV band makes the high redshift blazars brighter at hard X-rays than in the -ray band and this suggests that hard X-ray telescopes are better instruments to constrain the non-thermal jet properties of high redshift blazars (Ghisellini et al., 2010). Thanks to the excellent sensitivity of recently launched hard X-ray focusing telescope Nuclear Spectroscopic Telescope Array (NuSTAR; Harrison et al., 2013), it is now possible to explore the rising part of the Compton component of high redshift FSRQs in detail. Furthermore, the recently released Pass 8 data from Fermi-Large Area Telescope (Fermi-LAT) has an increased sensitivity at low energies (Atwood et al., 2013) which is important for high redshift objects. Though weak in the -ray window of the SED, a significant -ray detection from high redshift FSRQs will further constrain the location of the IC peak and thus a more accurate measurement of their physical properties.
In many high redshift quasars (and also in blazars) a spectral flattening at soft X-ray energies have been noticed ( keV, see, e.g., Eitan & Behar, 2013, and references therein). Earlier, it was attributed to the presence of absorbing material in the source environment, however, the low level of optical-UV extinction observed in a number of sources is inconsistent with this interpretation. A hypothesis of the presence of a ‘warm absorber’ was also proposed to explain the observed soft X-ray dip (e.g., Worsley et al., 2004a, b). Based on Swift/GRB data, Behar et al. (2011) proposed a diffuse intergalactic medium dominated absorption scenario. However, this feature is more frequently observed in radio-loud quasars than radio-quiet objects (e.g., Eitan & Behar, 2013) and thus requires a connection between X-ray absorption and jet linked activities. More recently, it has been argued that the observed X-ray flattening could be due to low-energy roll-off of the external Compton (EC) process (e.g., Ghisellini et al., 2007; Tavecchio et al., 2007; Foschini, 2009).
Here we present the results of a multi-wavelength study of the four high redshift FSRQs, namely, S5 0014+81 (hereafter J0014+81; ), CGRaBS J0225+1846 (hereafter J0225+1846; ), BZQ J1430+4205 (hereafter J1430+4205; ), and 3FGL J1656.23303 (hereafter J16563303; ). Our primary goal is to study the broadband physical properties of these high redshift blazars with a major focus on their X-ray characteristics. All of them have been observed from NuSTAR along with the simultaneous monitoring from Swift (Gehrels et al., 2004), thus providing a unique opportunity to study their 0.379 keV X-ray properties. It should be noted that the objects J0014+81 and J0225+1846 have recently been studied by Sbarrato et al. (2015) using the same data set. Our findings are similar to them but we also include the recent XMM-Newton and Fermi-LAT observations and place more emphasis on the X-ray spectral properties. In Section 2, we briefly report the basic information about all the four blazars. Section 3 is devoted to the adopted data reduction procedures and the obtained results are presented in Section 4. We discuss our findings in Section 5 and conclude in Section 6. We use a CDM cosmology with the Hubble constant km s-1 Mpc-1, , and .
2 General Physical Properties
Kuehr et al. (1981) first reported the discovery of J0014+81 and subsequently noted it as an optically luminous quasar (Kuhr et al., 1983). Very long baseline interferometry observations reveals the marginal detection of superluminal patterns (Piner et al., 2012) and also its optical radiation is not polarized (Wills et al., 2011). Ghisellini et al. (2009) derived its central black hole mass to be as high as 4 1010 , however, later it was found to be significantly overestimated (Sbarrato et al., 2015). J0014+81 is included in 70 months Swift-Burst Alert Telescope (BAT) hard X-ray catalog (Baumgartner et al., 2013) and was observed by NuSTAR on 2014 December 18 and 2015 January 23.
J0225+1846 was discovered as a flat spectrum radio bright object by Lawrence et al. ( mJy; 1983). Subsequently, it was identified as a high redshift blazar in the ROSAT Bright Survey (Schwope et al., 2000). Its is a hard X-ray bright source and is included in the 70 months Swift-BAT catalog. It was observed by NuSTAR on 2014 December 24 and 2015 January 18 along with the simultaneous monitoring from Swift. Moreover, two 100 ksec observations were done using XMM-Newton (Jansen et al., 2001) in 2013 January. This source is not present in any -ray catalogs but was postulated as a candidate -ray emitting blazar by Healey et al. (2008).
At a redshift of 4.72, J1430+4205 is a radio-loud ( mJy; Helmboldt et al., 2007) and an extremely X-ray luminous blazar (e.g., Fabian et al., 1997, 1998; Hook & McMahon, 1998). Fabian et al. (1999) reported the detection of a significant radio and X-ray flux variability from this source and postulated the presence of billion solar mass black hole at the center. Later, XMM-Newton observations confirmed the presence of soft X-ray flattening in the X-ray spectrum of this object (Worsley et al., 2004a), a feature typically observed in many high redshift radio-loud quasars (e.g., Page et al., 2005). J1430+4205 was monitored by NuSTAR on 2014 July 14, thereby making it the second most distant source observed by NuSTAR after B2 1023+25 (; Sbarrato et al., 2013b).
The source J16563303 was discovered with the Swift BAT during its first year of survey operation (Okajima et al., 2006). This object lies close to the galactic plane (galactic latitude 6∘.3). Using the Swift X-ray Telescope (XRT; Burrows et al., 2005) observations, Tueller et al. (2006) suggested it to be an extragalactic source. Later, a detailed multi-wavelength study of this source was done by Masetti et al. (2008) with a major focus on its optical spectroscopic properties. They confirmed the extragalactic nature of J16563303 and concluded it to be a high redshift blazar at . It is included in the recently released third catalog of Fermi-LAT detected sources (3FGL; Acero et al., 2015). It did not appear in the clean sample of the third catalog of Fermi-LAT detected AGNs (3LAC; Ackermann et al., 2015) because of its close proximity to the galactic plane. This source was simultaneously observed by NuSTAR and Swift on 2015 September 27.
3 Multiwavelength observations and Data Reduction
3.1 Fermi-Large Area Telescope Observations
Three out of four sources studied here, J0014+81, J0225+1846, and J1430+4205, are not present in any -ray catalogs. Therefore, by utilizing the availability of recently released Pass 8 data from Fermi-LAT, we not only study the -ray properties of the known -ray emitter J16563303 but also search for the possible detection of remaining three sources in the LAT energy range. We consider the first 89 months of Fermi-LAT data (MJD 5468357391 or 2008 August 4 to 2016 January 4) and follow the standard procedure as described in the online documentation111http://fermi.gsfc.nasa.gov/ssc/data/analysis/documentation/. In the energy range of 0.1300 GeV, we select only events belonging to SOURCE class (corresponding to evclass=128) and use a relational filter “DATAQUAL0”, && “LATCONFIG==1” to select good time intervals. To avoid the contamination from Earth limb -rays, we reject all the events with zenith angle larger than 90∘. We define the region of interest (ROI) as a circle of 15∘ radius centered at the target source to perform the likelihood fitting. All the objects lying within the ROI and present in 3FGL catalog are considered and the spectral parameters of those lying within 10∘ are left free to vary during the fitting. The parameters of remaining sources are fixed to the 3FGL catalog values. We use a binned likelihood method and compute the significance of the -ray signal by means of the maximum likelihood (ML) test statistic TS = 2) where represents the likelihood function, between models with and without a point source at the position of the source (Mattox et al., 1996). To search for the presence of additional faint objects that could be present in the data but not in 3FGL catalog, we generate the residual TS maps, after performing the first round of likelihood fitting. If present, these newly detected objects are then modeled with a power law model and another round of fitting is performed. We generate another residual TS map to ascertain that no sources are left to model. We then removed all the sources having TS25 to perform further temporal and spectral studies. To generate both light curve and spectrum, the source is considered to be detected if TS9. For bins with TS9 and or , where is the error estimate in the flux , we calculate 2 upper limit. In this work, all the errors associated with the LAT data analysis are 1 statistical uncertainties, unless specified.
3.2 NuSTAR Observations
The blazar J0014+81 was monitored two times by NuSTAR each on 2014 December 21 (obs ID 60001098002) and 2015 January 23 (obs ID 60001098004) for a net exposure of 36.4 ksec and 31 ksec, respectively. J0225+1846 was also observed twice, each on 2014 December 24 (obs ID 60001101002) and 2015 January 18 (obs ID 60001101004) for net exposure times of 32.0 and 37.5 ksec, respectively. J1430+4205 was monitored on 2014 July 14 (obs ID 60001103002) for 49.2 ksec, whereas, J16563303 was observed by NuSTAR on 2015 September 27 (obs ID 60160657002) for a net exposure time of 21.1 ksec.
The downloaded data sets for Focal Plane Module A (FPMA) and Focal Plane Module B (FPMB) are analyzed using the NuSTAR Data Analysis Software (NUSTARDAS) version 1.5.1. The task nupipeline is used to clean and calibrate the events data files using standard filtering criteria and NuSTAR CALDB updated on 2015 October 8. Source and background spectra, along with the ancillary and response matrix files, are generated using the task nuproducts. To generate the source spectrum, we select the source region as a circle of 30′′ radius centered at the target source. Background spectrum is extracted from a circular region of 70′′ on the same chip, free from source contamination. We bin the source spectrum to have a signal-to-noise ratio of 6, and oversample the spectra by a factor of 3.
3.3 XMM-Newton Observations
J0014+81 was observed with XMM-Newton on 2001 August 23, for a net exposure of 42.9 ksec (obs ID 0112620201). J0225+1846 was observed three times, once in 2003 (July 25, obs ID 0150180101) and twice in 2013 (January 13 and 15, obs IDs 0690900101 and 0690900201), for exposures of 22.2, 108.0, and 96.7 ksec, respectively. J1430+4205 was also observed three times, on 2002 December 09 (obs ID 0111260101), 2003 January 17 (obs ID 0111260701), and 2005 June 05 (obs ID 0212480701) for exposures of 18.9, 14.6 and 19.7 ksec. Finally, J1656-3303 was observed on 2009 September 11 (obs ID 0601741401) for net exposure of 22.6 ksec.
We use the XMM-Newton Science Analysis Software (SAS) version 15.0.0 to reduce the data. We use the rgsproc task to reduce the RGS spectra and the epproc task to produce the EPIC-pn event files, which we then filter for high background using evselect. We extract source spectra from 30′′ circular regions, and background spectra from 60′′ circular regions on the same chip, avoiding contaminating sources. The spectra are binned using specgroup to a signal-to-noise ratio of 6, after background subtraction, and to oversample the data by a factor of 3.
3.4 Swift Observations
Swift observations were carried out in conjunction with NuSTAR monitoring for all four blazars. It observed J0014+81 on 2014 December 21 (obs ID 00080003001, net exposure 6.5 ksec) and 2015 January 23 (obs ID 00080003002, net exposure 6.6 ksec). The source J0225+1846 was monitored on 2014 December 24 (obs ID 00080243001, net exposure 4.9 ksec) and 2015 January 18 (obs ID 00080243002, net exposure 5.1 ksec). Swift observed J1430+4205 on 2014 July 13 (obs ID 00080752002, net exposure 7.5 ksec) and J16563303 on 2015 September 27 (obs ID 00081202001, net exposure 6.8 ksec).
Swift-XRT observations of all the sources were carried out using the most sensitive photon counting mode (standard grade selection 012). The event files are calibrated and cleaned with the task xrtpipeline and using latest calibration files. Calibrated and cleaned event files are summed using xselect and the resultant summed event files are used to extract energy spectrum. We select the source region as a circle of 55′′ radius, whereas, events for the background spectra are extracted from an annular ring with inner and outer radii of 110′′ and 210′′, respectively, both centered at the position of the source of interest. We combine the exposure maps using the tool ximage which takes into account for CCD defects and PSF losses and generate the ancillary response files using xrtmkarf. The source spectra are binned to have a signal-to-noise ratio of 6.
The Swift UltraViolet Optical Telescope (UVOT; Roming et al., 2005) has observed the sources of interest in all the six filters (, , , 1, 2, and 2). To improve the signal to noise ratio, we add the UVOT snapshots using the tool uvotimsum. The source counts are extracted from a circular region of 5′′ centered at the source of interest, while background is selected as a circle of 30′′ radius from a nearby source-free region. The task uvotsource is used to extract the magnitudes which are then corrected for Galactic reddening (Schlafly & Finkbeiner, 2011). The de-absorbed magnitudes are converted to flux units using the zero point and calibrations of Breeveld et al. (2011).
4 Results
4.1 Gamma-ray Properties
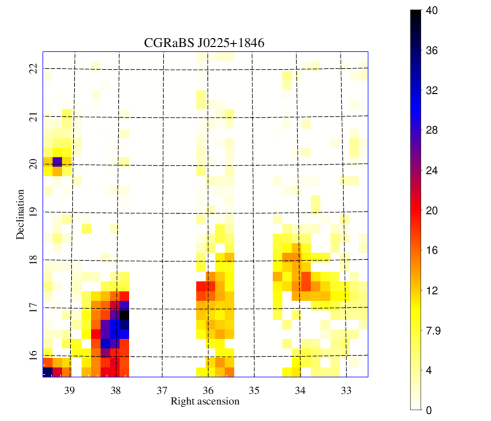
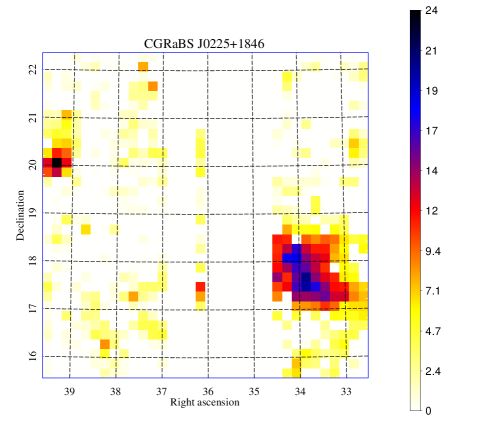
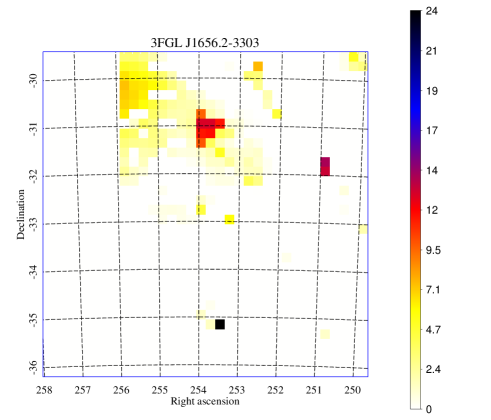
None of the blazars under consideration, except J16563303, are present in any -ray catalogs. Therefore, using the good quality Pass 8 LAT data, which is more sensitive at low energies, we search for possible -ray signal from all the four sources. This is done by performing an average analysis of 7.5 years of LAT data. Other than J16563303, we find a statistically significant -ray emission from J0225+1846 (TS188, 13 detection). To ensure that the observed -ray emission is associated with target blazars and not with any other unmodeled objects lying close to the sources of interest, we generate their residual TS maps and show them in Figure 1. As can be seen, the residual TS map of J0225+1846 suggests for the presence of few unmodeled sources (with TS25) and we properly consider them in the analysis. The residual TS map of the same field, after taking unmodeled objects into account, verifies that no other sources (with TS25) are left to model. The -ray spatial location of J0225+1846 is optimized using the tool gtfindsrc and derived as R.A., decl. = 36∘.177, 18∘.859 (J2000) with a 95% error circle radius of 0∘.21 degrees. We cross check in NRAO VLA Sky Survey (Condon et al., 1998) for the presence of additional radio sources within the 95% contour and found a total of 10 sources with J0225+1846 being the brightest ( mJy). Then, we search in the NASA/IPAC Extragalactic Database222http://ned.ipac.caltech.edu/ for multi-wavelength counterparts of these radio sources and find no information for any objects other than J0225+1846. This indicates the close association of J0225+1846 with the -ray emitter. Furthermore, the TS map of J16563303 does not reveal any unmodeled sources and therefore the model used during the analysis is an accurate representation of the observed -rays, with no new -ray point source being present. Apart from these, LAT data analysis of J0014+81 and J1430+4205 resulted in TS = 1.47 and 5.62, respectively. This suggests the non-detection of J0014+81 and only a marginal 2 detection of J1430+4205 in the -ray band. Two models, a power law (, where is the photon index) and a logParabola (, where is the photon index at , is the curvature index, and is pivot energy fixed at 300 MeV) are applied to the -ray spectra of J0225+1846 and J16563303. The results of the average LAT data analysis are presented in Table 1.
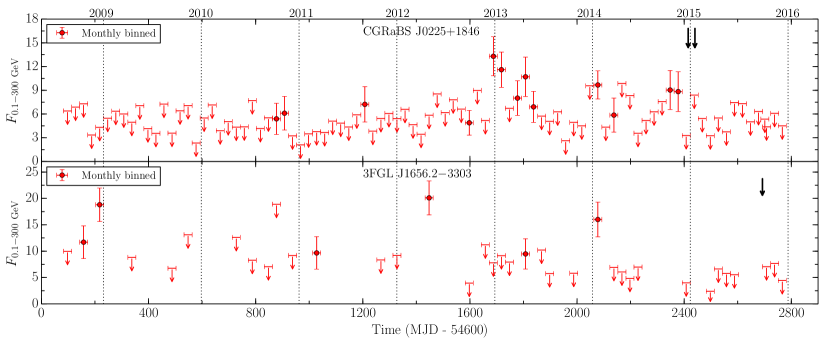
We also study the -ray temporal behavior of J0225+1846 and J16563303. This is done by generating monthly binned -ray light curves which we show in Figure 2. Both of them are faint in -rays and only a moderate brightening of J0225+1846 is seen around the beginning of 2013. On the other hand, J16563303 is occasionally detected by LAT without any flaring activity.
4.2 X-ray Properties
We fit the NuSTAR (379 keV), Swift-XRT (0.310 keV), and XMM-Newton (0.310 keV for EPIC-pn and 0.52 keV for RGS) spectra using xspec (Arnaud, 1996) version 12.9.0j. In all cases we include Galactic absorption, taken from the online tool of Willingale et al. (2013), of cm-2 for J0014+81, cm-2 for J0225+1486, cm-2 for J1430+4205, and cm-2 for J1656-3303. We use wilm abundances (Wilms et al., 2000) and vern cross sections (Verner et al., 1996).
4.2.1 Broad-band 0.379 keV spectra
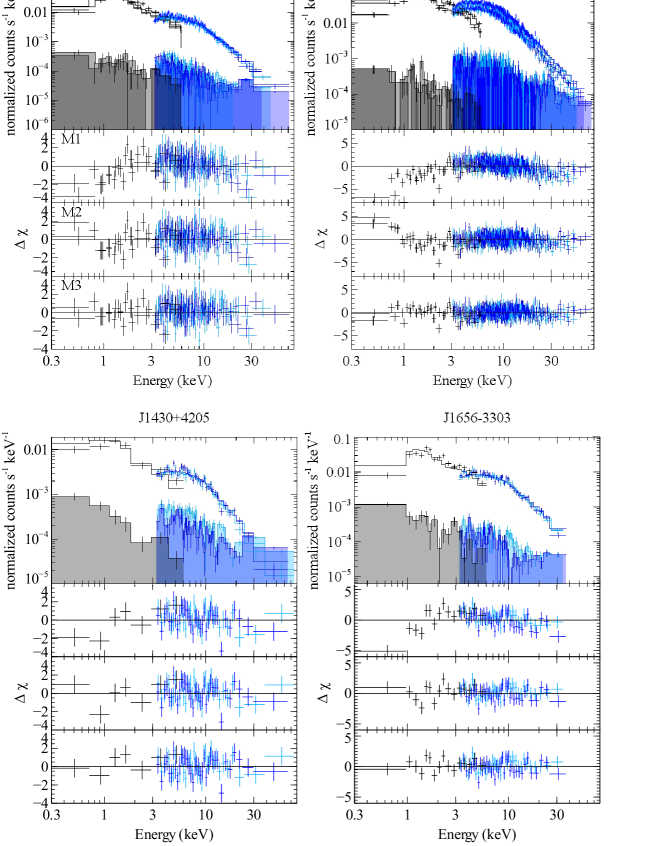
The most useful spectra for determining the nature of the change in slope in the X-ray band are the simultaneous Swift-XRT and NuSTAR spectra, which cover the energy range from –79 keV. We fit the same three models to each spectrum: a powerlaw absorbed by Galactic absorption only (M1, tbabs * powerlaw in xspec); a powerlaw absorbed by Galactic absorption and absorption intrinsic to the source (M2, tbabs * ztbabs * powerlaw); and a broken power-law, absorbed by Galactic absorption only (M3, tbabs * bknpower). These correspond to a spectrum with no curvature, a spectrum where the curvature is due to absorption of the source by the host galaxy, and a spectrum where the curvature is intrinsic. Two of the sources (J0014+81 and J0225+1846) were observed twice with NuSTAR and Swift. In the case of J0014+81 the two spectra are indistinguishable, so we fit them simultaneously with the same model. For J0225+1846 the observations are further apart and show significant spectral evolution. We, therefore, fit them simultaneously but allow the model parameters to vary between the two observations.
The best fit parameters for each model and object are given in Table 2 and the fit residuals are shown in Figure 3. In each case, the quality of the fit improves from M1–M3, with the absorbed power-law preferred over the unabsorbed power-law, and the broken power-law better still. The improvement in from switching from M2 to M3 is marginal for J0014+81, J1430+4205 and J1656-3303, so we check the significance using an F-test. We find chance probabilities of 0.0003, 0.011 and 0.008, respectively (in all cases, the improvement obtained by switching from M1 to M2 or M3 is significant at ).
We also consider the effect of ionized absorption (warm absorber) models. We replace the neutral absorber in M2 with an ionized absorber (modelled using an xstar grid), and re-fit the data for each source. This improves the fit significantly relative to the neutral absorber only in J0225+1846 (), with a column density of , and ionization of (the spectral variability between the two observations is mostly in the power-law).
4.2.2 XMM-Newton
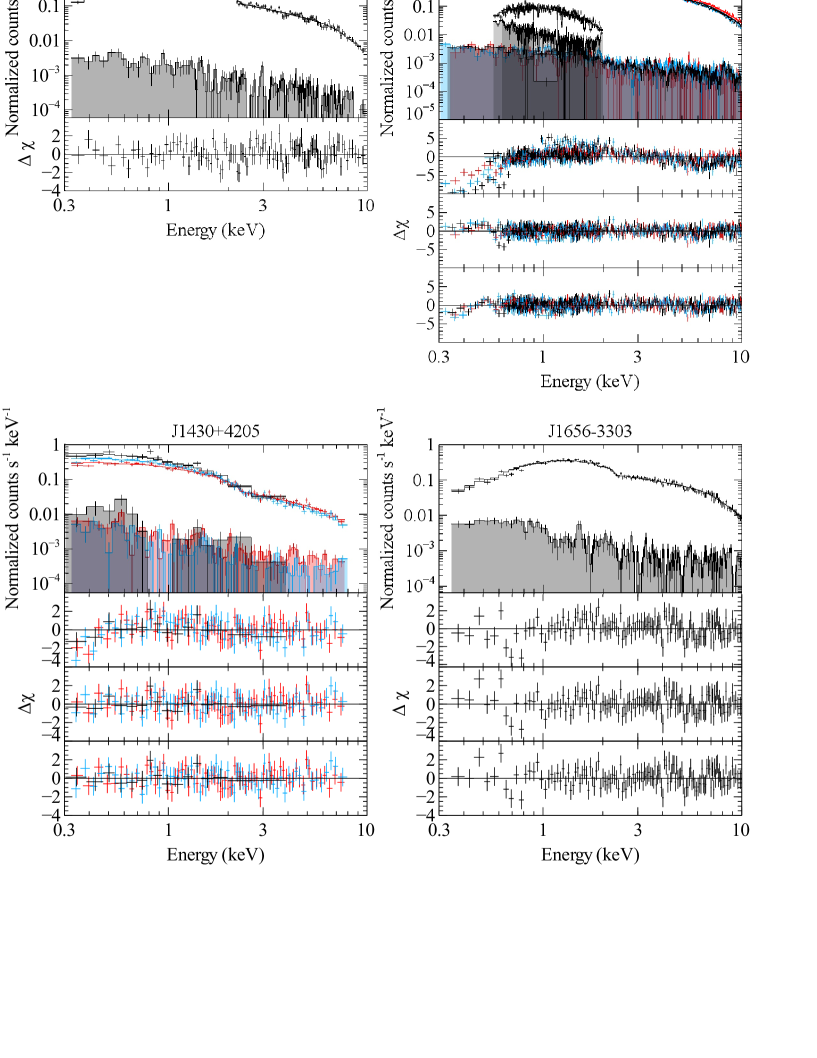
We next fit the XMM-Newton data for each object. We fit the EPIC-pn spectrum for each source, fitting simultaneously but allowing parameters to vary independently when there are multiple spectra. For J0225+1846, there are also high-resolution RGS spectra, which we include in the fit with model parameters tied to those of the corresponding EPIC-pn spectrum. For this fit we use the higher resolution tbnew (Wilms et al., 2000).
As these observations are not taken simultaneously with a hard X-ray instrument the energy band is significantly narrower, making it harder to detect spectral curvature. As such, additional curvature is not significantly detected in one source, J0014+81. This spectrum is well fit with a simple power-law model (M1, ) and the fit is not significantly improved by either additional absorption or a spectral break.
The other three sources show evidence of spectral curvature, with a significant improvement in the fit from M1 to M2 or M3. There is only a significant improvement from M2 to M3 in the case of J16563303 (p=0.004). For J0225+1486 the improvement is marginal (p=0.1) and for J1430+4205 the fit is slightly worse with M3 than M2, although not significantly so. The data and residuals to each model are shown in Figure 4 and the parameters are given in Table 3.
4.3 Spectral Energy Distributions
4.3.1 Model Setup
We use a simple one zone synchrotron and inverse Compton emission model fully described in Ghisellini & Tavecchio (2009) and here we discuss it in brief. We assume the emission region is a sphere of radius , located at a distance from the central black hole, and moving with a bulk Lorentz factor . The emitting region is filled with relativistic electrons having a smooth broken power law energy distribution of the following type
| (1) |
The size of the emission region is constrained by assuming it to cover entire jet cross-section with semi opening angle of the jet as 0.1 rad. The magnetic field is considered as tangled and uniform in the emission region. We consider several sources of thermal radiation externally to the jet: (i) the direct radiation from the accretion disk; (ii) the X-ray corona sandwiching the accretion disk, reprocessing a fraction of the accretion disk luminosity (), and having a cut-off power law spectrum (); (iii) the broad line region (BLR), assumed to reprocess a fraction of from a spherical shell located at a distance cm, where is the disk luminosity in units of 1045 erg s-1; (iv) and the IR emission from a dusty torus located at a distance cm and re-emit a fraction of the accretion luminosity. The spectra of both the BLR and the torus are assumed to be a blackbody peaking at the rest-frame frequency of Lyman- line (e.g., Tavecchio & Ghisellini, 2008) and , respectively, where is the characteristic temperature of the torus. In the comoving frame, we appropriately evaluate the radiative energy densities of these components and used them to derive the EC spectrum, and then transform into observer frame. We estimate the power that the jet carries in the form of magnetic field (), radiation (), relativistic electrons (), and cold protons (). The last quantity, i.e., the kinetic jet power, is derived by assuming equal number density of protons and relativistic electrons (e.g., Celotti & Ghisellini, 2008).
The flux produced by the accretion disk is estimated by assuming a standard Shakura & Sunyaev (1973) disk having a multi-temperature radial profile as follows (Frank et al., 2002)
| (2) |
where is the Schwarzschild radius and is the accretion efficiency. This is used to reproduce the thermal radiation (the big blue bump) observed at optical-UV energies and it constrains both and the central black hole mass of the source. There are only two parameters to be fitted, the accretion rate and the black hole mass, once we assume a typical value of the accretion efficiency (%). The former can be derived from the intrinsic accretion disk luminosity with being an observable parameter (provided the peak of the big blue bump is visible in the SED). This leaves only black hole mass as a free parameter and can be calculated from the optical-UV SED fitting.
4.3.2 SED Modeling Results
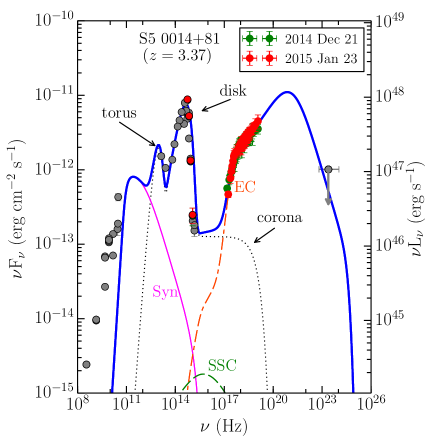
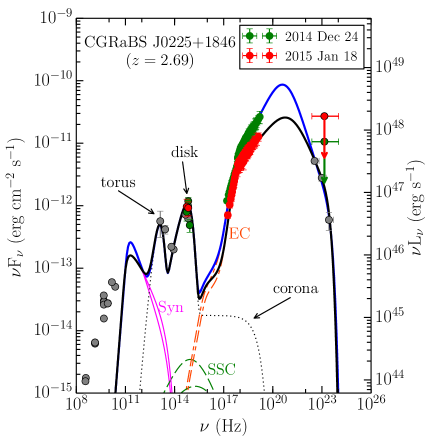
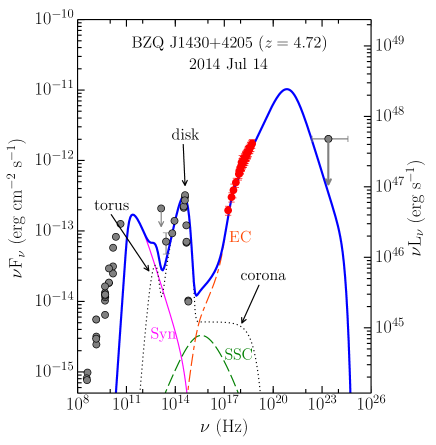
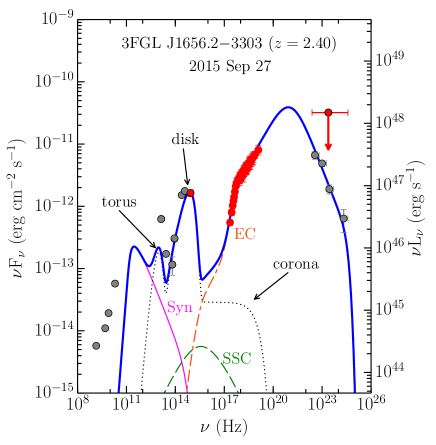
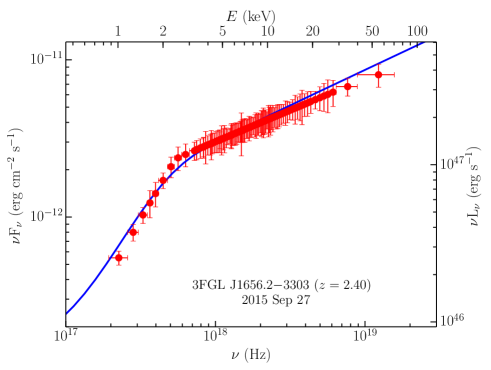
The broadband SEDs of all the four blazars are generated using quasi-simultaneous data from Swift, NuSTAR, and Fermi-LAT. None of the sources are detected by LAT even at 3 level in the month of NuSTAR observations and therefore we calculate their respective 2 upper limits. The generated SEDs are reproduced by the model presented in Section 4.3.1. For modeling of the SEDs, we adopt the following assumptions: the spectral shape of the X-ray corona emission is assumed to be flat ( = 1) and the cut-off energy is fixed at 150 keV (Ghisellini & Tavecchio, 2009). Fractions of the accretion disk luminosity re-emitted by the X-ray corona, the BLR, and the dusty torus are considered as , , and , respectively. The results of the SED generation and modeling are presented in Figure 5 and the associated modeling parameters are given in Table 4 and 5.
5 Discussion
A study of the high redshift blazars offers a unique opportunity to understand the physical properties of jetted sources at the extreme end of the accretion disk luminosity and the jet power. Since blazars emit a major fraction of their bolometric luminosity in the form of high energy X-ray and -ray radiation, it is important to have a good quality sensitive monitoring at these energies. In this regard, the observations from the facilities like Fermi-LAT, NuSTAR, and XMM-Newton are crucial to learn the radiative processes powering the jet of these distant sources.
5.1 Gamma-ray Emission
The high redshift blazars are, in general, weak in the -ray band because of the -correction effect (for increasing redshifts) and also due to intrinsic shift of the IC peak at lower frequencies as their bolometric luminosity increases (e.g., Ghisellini et al., 1998). Three out of four sources studied here were never detected in the -ray band, thus supporting the above hypothesis. However, thanks to the recently released Pass 8 data from Fermi-LAT, which is more sensitive at lower energies and thus important for high redshift objects, it is now possible to search distant blazars in the -ray band and constrain their SEDs in a far better way than in the past. We search for the detection of significant -ray emission from all the four high redshift blazars studied in this work (including J16563303 which is included in 3FGL catalog) and report J0225+1846 as a newly detected -ray emitter at 13 significance. This is the first report of the discovery of the -ray emission from this object and confirms the prediction of Healey et al. (2008). We also find a marginal 2 evidence for the detection of J1430+4205 at -ray energies. Moreover, we search for temporal flux variations among J0225+1846 and J16563303 and find the former to exhibit a low amplitude -ray flare around the beginning of the year 2013 (see Figure 2). This source has also shown hints of spectral curvature in its 7.5 years average -ray spectrum.
5.2 Soft X-ray Flattening
A flattening of the soft X-ray spectrum is observed in all the four blazars considered in this study. In fact, this feature is observed in several high redshift quasars (e.g., Eitan & Behar, 2013) and, in earlier studies, it was attributed to the presence of absorbing material intrinsic to the source environment (e.g., Fabian et al., 2001a, b). However, a low level of reddening observed at optical-UV energies does not support the above hypothesis. This is because, in some cases, the column densities derived from the X-ray spectral fitting reaches as high as cm-2 (Fabian et al., 2001a) and accordingly the reddening in the optical-UV band would be large (), which is against the observations. An alternative solution, so called ‘warm absorber’, was proposed by invoking an extreme gas-to-dust ratio, probably because of the high ionization state of the objects (e.g., Fabian et al., 2001a). On the other hand, the recent work by Tavecchio et al. (2007) (see also, Ghisellini et al., 2007; Foschini, 2009) suggests the soft X-ray flattening to be originated from the jet emission.
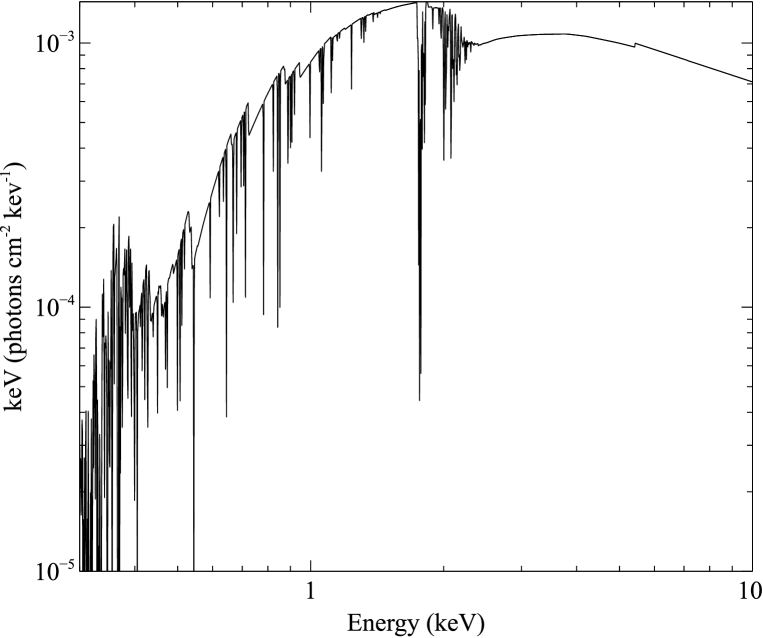
Switching M2 to use an ionized absorber (modeled with an xstar grid) offers an improved fit to the XRT/NuSTAR spectrum of J0225+1846, although still not as good as the fit with M3 (the broken power-law). Additionally, this model requires an extremely high column density ( cm-2) to account for the observed curvature in this spectrum. The combination of ionization and high column density predicts very strong iron absorption lines around 6–7 keV in the rest frame, redshifted to just below the NuSTAR band (see Figure 6). The strength of these features is such that they would be easily detected by the more sensitive EPIC-pn spectrum or the high resolution RGS spectrum in the case of J0225+1846.
More generally, there is a large disagreement between the column densities measured from the broad-band XRT/NuSTAR spectra and the XMM-Newton spectra. The column densities from the broad-band spectra are consistently several times larger (over 10 times in the case of J16563303). If the spectral curvature is caused by absorption, these values should be the same, or at least there should not be a consistent trend if the absorption is variable. However, if the spectral curvature is more gradual and intrinsic to the source, then we would expect exactly this trend, as more curvature is found in the broad-band spectra and thus a higher column is needed to fit the data. A similar trend is observed with the broken power-law model (M3), where the break energy is lower in the XMM-Newton spectra and the power-law indices are lower. This is exactly as expected from fitting such a model to a smooth curve.
While it is always possible that the absorbing column to each source has changed between the XMM-Newton and NuSTAR observations, it is extremely unlikely that all four sources would change in the same manner. When combined with the better fits to the broad-band spectra found using the broken power-law model, this is very strong evidence that the spectral curvature is not caused by absorption, but is instead an intrinsic part of the blazar X-ray spectrum, thus confirming the results obtained in earlier studies (Ghisellini et al., 2007; Tavecchio et al., 2007; Foschini, 2009).
5.3 Jet Emission and the Soft X-ray Deficit
The broadband SEDs of all the four blazars can be well reproduced using a simple one zone leptonic emission model (Figure 5). Following the blazar sequence, their synchrotron peak lies at sub-mm or at self-absorbed frequencies and this shifting leaves the accretion disk spectrum visible at optical-UV energies. By modeling the optical-UV spectrum with a standard accretion disk model, we constrained both the black hole masses and the accretion luminosities in all the four sources. All the objects are found to host more than a billion solar mass black holes at their centers with the central black hole mass of J0014+81 is estimated as 10 billion solar mass, thus making it one of the most massive black holes ever found in radio-loud quasars beyond redshift . For a consistency check, we compare the black hole masses obtained from SED modeling approach with that from single epoch optical spectroscopic line information. Varshalovich et al. (1987) reported the following relation using the optical spectroscopy of J0014+81.
| (3) |
Following Ghisellini & Tavecchio (2009), we find the BLR radius as 1 parsec (see Table 4). This suggests which is similar to that obtained from accretion disk modeling. For J1430+4205, we use C iv line and continuum parameters from the Sloan Digital Sky Survey data archive and adopt the empirical relations of Shen et al. (2011). This gives the central black hole mass as 1.710 which agrees within a factor of two to that derived by SED modeling approach. We consider the published C iv line parameters from Masetti et al. (2008) and the derived black hole mass of J16563303 is 6.3 10 which reasonably matches within a factor of three to that obtained from modeling. On the other hand, we could not get any spectroscopic line information in literature for J0225+1846. Furthermore, the accretion disk is also found to be extremely luminous in all the sources with erg s-1. The level of synchrotron emission is constrained from the archival radio data and is kept low enough so as not to overproduce the observed IR-optical-UV SED. Another deciding factor is that we needed enough injected electron power to reproduce the high energy X-ray to -ray SED via IC mechanism. Furthermore, in all the sources, the 0.379 keV X-ray spectra are very hard and the associated -ray spectra are steeply falling, as expected from high redshift blazars. We interpret the entire X-ray to -ray SED as a result of EC mechanism with the BLR as a primary reservoir of the seed photons. This sets the location of the emission region within the BLR in all the four objects, a feature generally seen in many high redshift FSRQs (e.g., Ghisellini et al., 2010). We constrain the spectral indices of the underlying electron population by reproducing the X-ray spectra and also by keeping into consideration the upper limits observed at LAT energies. Moreover, though not used for modeling, the long time average Fermi-LAT spectra assist us in having an idea about the typical shape of the falling part of the EC process.
In our sample of four blazars, two of them, J0014+81 and J0225+1846, were contemporaneously observed by NuSTAR and Swift in 2014 December and 2015 January. This, more than one episodes of monitoring, enables us to study the possible variations in their SEDs. As can be seen in Figure 5, the SED of J0014+81 does not show any variation between these two epochs and, in fact, is similar to archival observations. On the other hand, J0225+1846 became faint in 2015 January compared to 2014 December. It should be noted that the slopes of the falling EC spectrum in both the activities states are primarily decided by the Fermi-LAT upper limits (and with NuSTAR observations which controls the EC peak), but we also keep in mind its typical -ray spectral shape as revealed by long time average LAT spectrum (Figure 5). An interesting observation is the detection of low value of the -ray flux upper limit at the time of the high X-ray state (2014 December, see also, Figure 2), which makes the falling EC spectrum to be steeper (Figure 5). In 2015 January observation, on the other hand, J0225+1846 was in a relatively low X-ray state but the obtained upper limit indicates it to be slightly brighter in -rays, thus making the EC spectrum flatter at -ray energies. Now, on comparing these two SEDs and also noting that the NuSTAR spectrum is harder in brighter state, we find that during the high activity phase, the EC peak shifted to lower frequencies, in accordance with the traditional blazar sequence.
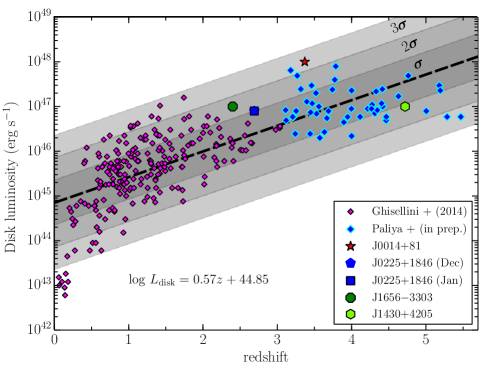
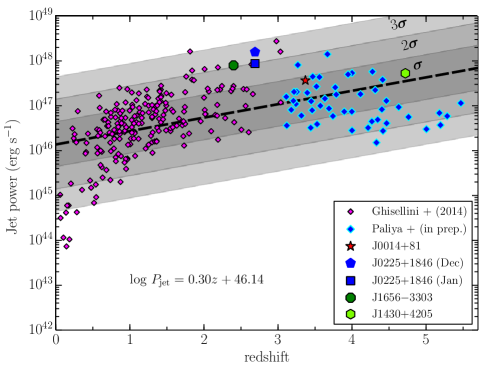
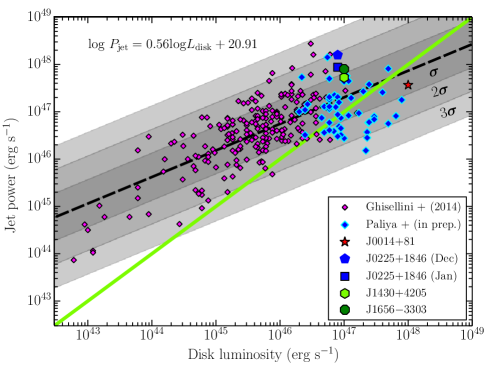
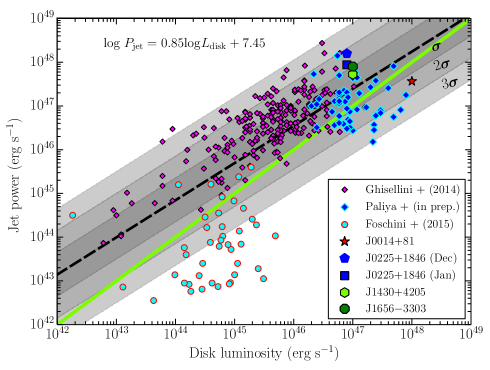
It is interesting to compare the physical properties of these four high redshift blazars with other blazars at similar redshifts and also with comparatively nearby objects. The main motivation here is to search for any possible trend or evolution of the physical parameters, such as the and total jet power () over cosmic history of time and also to check the relative position of the four sources studied here. With this in mind, we collect and values of all the 226 objects studied by Ghisellini et al. (2014), covering up to redshift 3.04. For higher redshift objects, we choose those sources from BZCAT (Massaro et al., 2015) that have 3.04, exhibit a hard X-ray spectrum (X-ray photon index 1.7,see, e.g., Saez et al., 2011), and are highly radio-loud333The selection of the sources from BZCAT is the part of our ongoing investigation of the physical properties of high redshift quasars and the details of the analysis will be presented in a forthcoming publication. (radio-loudness factor 100, e.g., Kellermann et al., 1989). We then perform the broadband SED modeling of all these objects using the same leptonic emission model. We plot the variation of and with respect to the redshift and show them in the top panels of Figure 7. We also present a plot between and in the bottom left panel of Figure 7. Moreover, we over plot all the four sources considered in this work (including both the activity states of J0225+1846). We find a positive correlation between and with redshift, respectively, and also between themselves (Figure 7). This is not unexpected because at higher redshifts, only the most powerful objects are visible. However, there are few points worth noticing. First, increases upto a redshift of 33.5 and after that it appears to saturate around 1047 erg s-1. Second, the similar behavior is visible in versus redshift plot, where beyond redshift 4, tend to deviate more towards the lower power from the best linear fit. A comparison of the slopes obtained from the best linear fitting of and versus redshift indicates that does not increases at the same rate as . In fact, the visual inspection suggests a relatively decrease in for 3 objects. These findings are further confirmed in versus plot, where slope of the obtained linear fit (0.56 0.03) is steeper than that derived by Ghisellini et al. (2014). As can be seen in Figure 7, the change of slopes has occurred due to high redshift (3) blazars to occupy high and relatively low regime. In other words, though is true for relatively low redshift blazars (Ghisellini et al., 2014) but the same may not hold for blazars beyond redshift 3 or 4. However, we caution that a strong claim cannot be made because of two reasons: (i) blazars beyond redshift 4 are primarily discovered in IR-optical surveys (e.g., Yi et al., 2014) and thus are relatively bright in the optical band, implying more luminous accretion disk, even though having moderate power jets, and (ii) it is difficult to precisely measure the jet power in blazars beyond redshift 3 due to lack of good quality high energy X-ray and -ray observations. None of the sources, beyond redshift 3.04, are present in 3FGL catalog and only few of them are having sensitive X-ray data from facilities like NuSTAR. This could be the reason of the observed large scatter in for blazars beyond redshift 3. Observations from NuSTAR are crucial to confirm/reject the trend seen in Figure 7. On a different note, it is also of great interest to consider another class of AGN with powerful relativistic jets, the radio-loud narrow line Seyfert 1 (RL-NLSy1) galaxies. The detection of significant -ray emission from some of these RL-NLSy1 galaxies have confirmed the idea that these sources too host powerful relativistic jets similar to blazars (see, e.g., Foschini, 2012, for a review). We collect the and information for a sample of RL-NLSy1 galaxies studied by Foschini et al. (2015) and plot them along with the known blazars in the bottom right panel of Figure 7. As can be seen, the RL-NLSy1 galaxies do not follow the correlation seen among blazars and occupy a distinct region where there jet power is considerably lesser than blazars and the disk luminosity is comparable to low jet power blazars. These objects are known to have a high accretion rate (e.g., Zhou et al., 2006) but host a relatively low power jet, possibly due to harboring low mass black holes444However, once normalized by the black holes mass, the jet powers of RL-NLSy1 galaxies are consistent with blazars, indicating the scalability of the jet (Foschini et al., 2015).. Considering the four sources studied here, we find them to occupy a place in versus plot where their jet power exceeds the accretion luminosities, except for J0014+81. Furthermore, in the redshift evolution diagram, they appear to follow the common trend with no major exception.
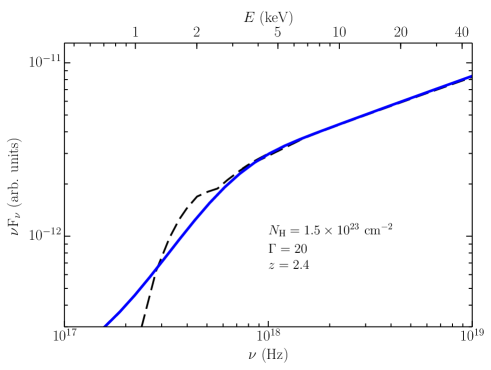
The soft X-ray deficit observed in many jetted sources can also be reproduced by the intrinsic curvature of the EC emission from the jet (see, e.g., Ghisellini et al., 2007; Tavecchio et al., 2007; Sambruna et al., 2007; Tavecchio & Ghisellini, 2008; Foschini, 2009). In fact, the SED model used to reproduce the broadband spectrum of a high redshift blazar do predicts a smooth flattening of the X-ray spectrum below few keV, although the accurate measurement of the shape and the location of the break depends on the SED parameters and also on the ambient photon distribution (e.g., Tavecchio et al., 2007). Below the break, the EC slope reflects the shape of the seed photon distribution ( for a blackbody distribution). To emphasize more, we plot an absorbed power law spectrum with redshifted column density cm-2 and an EC spectrum, for a source located at a redshift of 2.4 and moving with , in Figure 8. As discussed above, a break in the EC spectrum is visible at a frequency of , where is the peak frequency of the ambient photon field providing seed photons for IC scattering. Assuming BLR photon field as a predominant source of seed photons () and fixing the minimum energy of the underlying electron population to , we find that the break frequency depends only on the bulk Lorentz factor. The shapes of both the spectra are quite similar down to 12 keV (which will be lower for higher redshift objects), as can be seen in Figure 8. Below this energy, EC asymptotically follows a spectrum (reflecting the slope of the ambient photons), while intrinsically absorbed power law drops exponentially. Now, to compare these theoretical arguments with the observations, we plot the zoomed version of the X-ray part of the modeled SED of J16563303 in Figure 8. Both the models, discussed above, can reasonably fit the data. However, based on our study (see Section 5.2), the hypothesis of host galaxy/warm absorption can be rejected. This leaves the presence of intrinsic curvature in the jet emission as the most plausible explanation of the soft X-ray deficit in the high redshift blazars and confirms the results of the earlier studies (e.g., Ghisellini et al., 2007; Tavecchio et al., 2007; Foschini, 2009).
6 Summary
In this paper, we study the broadband physical properties of four high redshift blazars namely, J0014+81, J0225+1846, J1430+4205, and J16563303. We summarize our findings below.
-
1.
A statistically significant -ray emission has been detected from J0225+1846, confirming earlier predictions of this object as a -ray emitter.
-
2.
The broadband SEDs of all the four blazars are typical of their high redshift counterparts with optical-UV emission is dominated by the accretion disk radiation and high energy X-ray to -ray spectra are dominated by jet emission processes.
-
3.
All the sources are found to host more than a billion solar mass black holes at their centers and their accretion disk luminosity exceeds 1046 erg s-1. Moreover, they occupy the high end of the - correlation.
-
4.
A detailed investigation of the joint XRT/NuSTAR spectral fitting (and also RGS spectral fitting of J0225+1846) favors the jet based origin of the observed soft X-ray flattening in high redshift blazars rather than due to external effects, such as host galaxy absorption and/or warm absorber.
-
5.
Overall, the blazars beyond redshift 3 are tend to deviate from the known one-to-one accretion-jet correlation, however, further observations from facilities, e.g., NuSTAR, are necessary to confirm/reject this hypothesis.
References
- Acero et al. (2015) Acero, F., Ackermann, M., Ajello, M., et al. 2015, ApJS, 218, 23
- Ackermann et al. (2015) Ackermann, M., Ajello, M., Atwood, W. B., et al. 2015, ApJ, 810, 14
- Arnaud (1996) Arnaud, K. A. 1996, in Astronomical Society of the Pacific Conference Series, Vol. 101, Astronomical Data Analysis Software and Systems V, ed. G. H. Jacoby & J. Barnes, 17
- Atwood et al. (2013) Atwood, W., Albert, A., Baldini, L., et al. 2013, arXiv:1303.3514, arXiv:1303.3514
- Baumgartner et al. (2013) Baumgartner, W. H., Tueller, J., Markwardt, C. B., et al. 2013, ApJS, 207, 19
- Behar et al. (2011) Behar, E., Dado, S., Dar, A., & Laor, A. 2011, ApJ, 734, 26
- Breeveld et al. (2011) Breeveld, A. A., Landsman, W., Holland, S. T., et al. 2011, in American Institute of Physics Conference Series, Vol. 1358, American Institute of Physics Conference Series, ed. J. E. McEnery, J. L. Racusin, & N. Gehrels, 373–376
- Burrows et al. (2005) Burrows, D. N., Hill, J. E., Nousek, J. A., et al. 2005, Space Sci. Rev., 120, 165
- Celotti & Ghisellini (2008) Celotti, A., & Ghisellini, G. 2008, MNRAS, 385, 283
- Condon et al. (1998) Condon, J. J., Cotton, W. D., Greisen, E. W., et al. 1998, AJ, 115, 1693
- Eitan & Behar (2013) Eitan, A., & Behar, E. 2013, ApJ, 774, 29
- Fabian et al. (1997) Fabian, A. C., Brandt, W. N., McMahon, R. G., & Hook, I. M. 1997, MNRAS, 291, L5
- Fabian et al. (2001a) Fabian, A. C., Celotti, A., Iwasawa, K., & Ghisellini, G. 2001a, MNRAS, 324, 628
- Fabian et al. (2001b) Fabian, A. C., Celotti, A., Iwasawa, K., et al. 2001b, MNRAS, 323, 373
- Fabian et al. (1999) Fabian, A. C., Celotti, A., Pooley, G., et al. 1999, MNRAS, 308, L6
- Fabian et al. (1998) Fabian, A. C., Iwasawa, K., McMahon, R. G., et al. 1998, MNRAS, 295, L25
- Foschini (2009) Foschini, L. 2009, Advances in Space Research, 43, 1036
- Foschini (2012) Foschini, L. 2012, in Proceedings of Nuclei of Seyfert galaxies and QSOs - Central engine & conditions of star formation (Seyfert 2012). 6-8 November, 2012., 10
- Foschini et al. (2015) Foschini, L., Berton, M., Caccianiga, A., et al. 2015, A&A, 575, A13
- Fossati et al. (1998) Fossati, G., Maraschi, L., Celotti, A., Comastri, A., & Ghisellini, G. 1998, MNRAS, 299, 433
- Frank et al. (2002) Frank, J., King, A., & Raine, D. J. 2002, Accretion Power in Astrophysics, by Juhan Frank and Andrew King and Derek Raine, pp. 398. ISBN 0521620538. Cambridge, UK: Cambridge University Press, February 2002
- Gehrels et al. (2004) Gehrels, N., Chincarini, G., Giommi, P., et al. 2004, ApJ, 611, 1005
- Ghisellini et al. (1998) Ghisellini, G., Celotti, A., Fossati, G., Maraschi, L., & Comastri, A. 1998, MNRAS, 301, 451
- Ghisellini et al. (2007) Ghisellini, G., Foschini, L., Tavecchio, F., & Pian, E. 2007, MNRAS, 382, L82
- Ghisellini et al. (2009) Ghisellini, G., Foschini, L., Volonteri, M., et al. 2009, MNRAS, 399, L24
- Ghisellini & Tavecchio (2009) Ghisellini, G., & Tavecchio, F. 2009, MNRAS, 397, 985
- Ghisellini et al. (2014) Ghisellini, G., Tavecchio, F., Maraschi, L., Celotti, A., & Sbarrato, T. 2014, Nature, 515, 376
- Ghisellini et al. (2010) Ghisellini, G., Della Ceca, R., Volonteri, M., et al. 2010, MNRAS, 405, 387
- Harrison et al. (2013) Harrison, F. A., Craig, W. W., Christensen, F. E., et al. 2013, ApJ, 770, 103
- Healey et al. (2008) Healey, S. E., Romani, R. W., Cotter, G., et al. 2008, ApJS, 175, 97
- Helmboldt et al. (2007) Helmboldt, J. F., Taylor, G. B., Tremblay, S., et al. 2007, ApJ, 658, 203
- Hook & McMahon (1998) Hook, I. M., & McMahon, R. G. 1998, MNRAS, 294, L7
- Jansen et al. (2001) Jansen, F., Lumb, D., Altieri, B., et al. 2001, A&A, 365, L1
- Kellermann et al. (1989) Kellermann, K. I., Sramek, R., Schmidt, M., Shaffer, D. B., & Green, R. 1989, AJ, 98, 1195
- Kuehr et al. (1981) Kuehr, H., Pauliny-Toth, I. I. K., Witzel, A., & Schmidt, J. 1981, AJ, 86, 854
- Kuhr et al. (1983) Kuhr, H., Liebert, J. W., Strittmatter, P. A., Schmidt, G. D., & Mackay, C. 1983, ApJ, 275, L33
- Lawrence et al. (1983) Lawrence, C. R., Bennett, C. L., Garcia-Barreto, J. A., Greenfield, P. E., & Burke, B. F. 1983, ApJS, 51, 67
- Masetti et al. (2008) Masetti, N., Mason, E., Landi, R., et al. 2008, A&A, 480, 715
- Massaro et al. (2015) Massaro, E., Maselli, A., Leto, C., et al. 2015, Ap&SS, 357, 75
- Mattox et al. (1996) Mattox, J. R., Bertsch, D. L., Chiang, J., et al. 1996, ApJ, 461, 396
- Okajima et al. (2006) Okajima, T., Tueller, J., Markwardt, C., et al. 2006, The Astronomer’s Telegram, 799, 1
- Page et al. (2005) Page, K. L., Reeves, J. N., O’Brien, P. T., & Turner, M. J. L. 2005, MNRAS, 364, 195
- Piner et al. (2012) Piner, B. G., Pushkarev, A. B., Kovalev, Y. Y., et al. 2012, ApJ, 758, 84
- Romani et al. (2004) Romani, R. W., Sowards-Emmerd, D., Greenhill, L., & Michelson, P. 2004, ApJ, 610, L9
- Roming et al. (2005) Roming, P. W. A., Kennedy, T. E., Mason, K. O., et al. 2005, Space Sci. Rev., 120, 95
- Saez et al. (2011) Saez, C., Brandt, W. N., Shemmer, O., et al. 2011, ApJ, 738, 53
- Sambruna et al. (2007) Sambruna, R. M., Tavecchio, F., Ghisellini, G., et al. 2007, ApJ, 669, 884
- Sbarrato et al. (2013a) Sbarrato, T., Ghisellini, G., Nardini, M., et al. 2013a, MNRAS, 433, 2182
- Sbarrato et al. (2013b) Sbarrato, T., Tagliaferri, G., Ghisellini, G., et al. 2013b, ApJ, 777, 147
- Sbarrato et al. (2015) Sbarrato, T., Ghisellini, G., Tagliaferri, G., et al. 2015, arXiv:1510.08849, arXiv:1510.08849
- Schlafly & Finkbeiner (2011) Schlafly, E. F., & Finkbeiner, D. P. 2011, ApJ, 737, 103
- Schwope et al. (2000) Schwope, A., Hasinger, G., Lehmann, I., et al. 2000, Astronomische Nachrichten, 321, 1
- Shakura & Sunyaev (1973) Shakura, N. I., & Sunyaev, R. A. 1973, A&A, 24, 337
- Shen et al. (2011) Shen, Y., Richards, G. T., Strauss, M. A., et al. 2011, ApJS, 194, 45
- Tavecchio & Ghisellini (2008) Tavecchio, F., & Ghisellini, G. 2008, MNRAS, 386, 945
- Tavecchio et al. (2007) Tavecchio, F., Maraschi, L., Ghisellini, G., et al. 2007, ApJ, 665, 980
- Tueller et al. (2006) Tueller, J., Markwardt, C., Ajello, M., et al. 2006, The Astronomer’s Telegram, 835, 1
- Varshalovich et al. (1987) Varshalovich, D. A., Levshakov, S. A., Nazarov, E. A., Spiridonova, O. I., & Fomenko, A. F. 1987, Soviet Ast., 31, 136
- Verner et al. (1996) Verner, D. A., Ferland, G. J., Korista, K. T., & Yakovlev, D. G. 1996, ApJ, 465, 487
- Willingale et al. (2013) Willingale, R., Starling, R. L. C., Beardmore, A. P., Tanvir, N. R., & O’Brien, P. T. 2013, MNRAS, 431, 394
- Wills et al. (2011) Wills, B. J., Wills, D., & Breger, M. 2011, ApJS, 194, 19
- Wilms et al. (2000) Wilms, J., Allen, A., & McCray, R. 2000, ApJ, 542, 914
- Worsley et al. (2004a) Worsley, M. A., Fabian, A. C., Celotti, A., & Iwasawa, K. 2004a, MNRAS, 350, L67
- Worsley et al. (2004b) Worsley, M. A., Fabian, A. C., Turner, A. K., Celotti, A., & Iwasawa, K. 2004b, MNRAS, 350, 207
- Yi et al. (2014) Yi, W.-M., Wang, F., Wu, X.-B., et al. 2014, ApJ, 795, L29
- Zhou et al. (2006) Zhou, H., Wang, T., Yuan, W., et al. 2006, ApJS, 166, 128
| Name | Model | TS | TScurve | |||
|---|---|---|---|---|---|---|
| [1] | [2] | [3] | [4] | [5] | [6] | [7] |
| J0014+81 | PL | 0.15 (UL) | — | 1.47 | ||
| LP | — | — | — | — | — | |
| J0225+1846 | PL | 2.65 0.21 | 2.99 0.09 | 188.43 | ||
| LP | 2.49 0.25 | 2.86 0.14 | 0.45 0.21 | 195.51 | 9.82 | |
| J1430+4205 | PL | 0.42 (UL) | — | 5.62 | ||
| LP | — | — | — | — | — | |
| J16563303 | PL | 4.37 0.32 | 2.87 0.07 | 207.21 | ||
| LP | 4.37 0.31 | 2.87 0.06 | 0.00 0.00 | 207.21 | 0.00 |
| Source | Model | d.o.f. | ||||
| J0014+81 | M1 | 1.19/206 | ||||
| M2 | 1.03/205 | |||||
| M3 | 0.97/204 | |||||
| J0225+1846 | ||||||
| (60001101002) | M1 | 1.84/667 | ||||
| M2 | 1.15/675 | |||||
| M3 | 1.03/673 | |||||
| (60001101004) | M1 | 1.84/6671 | ||||
| M2 | 1.15/6751 | |||||
| M3 | 1.03/6731 | |||||
| J1430+4205 | M1 | 1.20/78 | ||||
| M2 | 1.10/77 | |||||
| M3 | 1.03/76 | |||||
| J16563303 | M1 | 1.63/95 | ||||
| M2 | 1.03/94 | |||||
| M3 | 0.97/93 |
1The values are identical for the two observations of J0225+1486 because the spectra are fit simultaneously.
| Source | Model | d.o.f. | ||||
|---|---|---|---|---|---|---|
| J0014+81 | M1 | 0.97/116 | ||||
| J0225+1846 | ||||||
| (0150180101) | M1 | 3.29/1062 | ||||
| M2 | 1.12/1059 | |||||
| M3 | 1.12/1056 | |||||
| (0690900101) | M1 | 3.29/10621 | ||||
| M2 | 1.12/10591 | |||||
| M3 | 1.12/10561 | |||||
| (0690900201) | M1 | 3.29/10621 | ||||
| M2 | 1.12/10591 | |||||
| M3 | 1.12/10561 | |||||
| J1430+4205 | ||||||
| (0111260101) | M1 | 1.06/150 | ||||
| M2 | 0.80/147 | |||||
| M3 | 0.82/144 | |||||
| (0111260701) | M1 | 1.06/1501 | ||||
| M2 | 0.80/1471 | |||||
| M3 | 0.82/1441 | |||||
| (0212480701) | M1 | 1.06/1501 | ||||
| M2 | 0.80/1471 | |||||
| M3 | 0.82/1441 | |||||
| J16563303 | M1 | 1.08/130 | ||||
| M2 | 0.99/129 | |||||
| M3 | 0.94/128 |
1The values are identical for the three observations of J0225+1486 and J1430+4205 because the spectra are fit simultaneously. Additionally, for J0225+1486 source we include the RGS data and use tbnew instead of tbabs.
| Name | Date | ||||||||||||
|---|---|---|---|---|---|---|---|---|---|---|---|---|---|
| [1] | [2] | [3] | [4] | [5] | [6] | [7] | [8] | [9] | [10] | [11] | [12] | [13] | [14] |
| J0014+81 | 2014 Dec 21 | 10.04 | 48.0 | 2.3 | 4.5 | 2.2 | 0.001 | 10 | 116 | 5000 | 0.89 | 1.02 | 500 |
| J0225+1846 | 2014 Dec 24 | 9.40 | 46.9 | 1.9 | 4.7 | 1.0 | 0.023 | 16 | 46 | 1000 | 0.26 | 0.29 | 580 |
| 2015 Jan 18 | 9.40 | 46.9 | 2.3 | 4.3 | 1.0 | 0.015 | 14 | 71 | 1000 | 0.26 | 0.29 | 580 | |
| J1430+4205 | 2014 Jul 14 | 9.54 | 47.0 | 1.9 | 4.5 | 1.6 | 0.022 | 14 | 79 | 3500 | 0.20 | 0.31 | 400 |
| J16563303 | 2015 Sep 27 | 9.30 | 47.0 | 2.3 | 4.4 | 1.0 | 0.051 | 14 | 68 | 3500 | 0.15 | 0.32 | 400 |
| Name | Date | ||||
|---|---|---|---|---|---|
| [1] | [2] | [3] | [4] | [5] | [6] |
| J0014+81 | 2014 Dec 21 | 47.13 | 45.92 | 44.72 | 47.35 |
| J0225+1846 | 2014 Dec 24 | 45.80 | 46.76 | 45.57 | 48.18 |
| 2015 Jan 18 | 45.68 | 46.21 | 45.26 | 47.93 | |
| J1430+4205 | 2014 Jul 14 | 45.86 | 46.30 | 45.20 | 47.70 |
| J16563303 | 2015 Sep 27 | 45.21 | 46.21 | 45.32 | 47.89 |