Missing energy signature from invisible decays of dark photons at the CERN SPS
Abstract
The dark photon () production through the mixing with the bremsstrahlung photon from the electron scattering off nuclei can be accompanied by the dominant invisible decay into dark-sector particles. In this work we discuss the missing energy signature of this process in the experiment NA64 aiming at the search for decays with a high-energy electron beam at the CERN SPS. We show the distinctive distributions of variables that can be used to distinguish the signal from background. The results of the detailed simulation of the detector response for the events with and without emission are presented. The efficiency of the signal event selection is estimated. It is used to evaluate the sensitivity of the experiment and show that it allows to probe the still unexplored area of the mixing strength and masses up to GeV. The results obtained are compared with the results from other calculations. In the case of the signal observation, a possibility of extraction of the parameters and by using the shape of the missing energy spectrum is discussed.
pacs:
14.80.-j, 12.60.-i, 13.20.Cz, 13.35.HbI Introduction and motivation
The origin of dark matter is a great puzzle in the cosmology and particle physics. In recent years, various phenomenological models assumed the existence of a light vector boson, the ”dark photon” , with a mass GeV resulting from a spontaneously broken new gauge symmetry . The couples to the standard model (SM) particles only through the kinetic mixing of dark charge with hypercharge, parametrized by the mixing strength Okun:1982xi ; Galison:1983pa ; Holdom:1985ag . The kinetically mixes with the photon and couples primarily to the electromagnetic current with a strength , where is the electromagnetic coupling. The phenomenology of , motivated by potential astrophysical signals of dark matter ArkaniHamed:2008qn , as well as the 3.6 discrepancy between the the SM prediction and measurements of the muon anomalous magnetic dipole moment g-2 Bennett:2006fi has been studied in many theoretical and experimental works ArkaniHamed:2008qn ; Bjorken:2009mm ; Essig:2013lka ; fayet ; gk ; Pospelov:2008zw .
If the is the lightest particle in the dark sector, it will decay dominantly into ordinary particles, e.g. . However, if there are lighter dark sector states, would decay predominantly into such particles resulting in the decay. This will occur assuming that , where is the coupling constant of the gauge interaction with light dark matter particles. Such , which is nearly ”invisible”, provides new possibilities to explain various anomalies including the muon g-2 problem and is a subject of different experimental constraints Izaguirre:2014bca ; Diamond:2013oda ; Davoudiasl:2014kua ; Batell:2014mga and new experimental searches. Interestingly, that the muon (g-2) anomaly gk ; fayet ; Pospelov:2008zw can be explained by the existence of a sub-GeV with the couplings . Such couplings naturally arise from the loop effects of particles that are charged under both the standard model (SM) and dark hypercharge interactions Holdom:1985ag .
One possible way to search for the invisible is based on production and detection sub-GeV dark matter in accelerator experiments. The s produced in a high intensity beam dump experiment, decay in flight and produce other dark matter particles which can be detected through the scattering of electrons in the detector target Izaguirre:2014bca ; Diamond:2013oda ; Batell:2009di ; deNiverville:2011it ; Dharmapalan:2012xp . The signal event rate depends on the couplings to the dark and visible sectors, and respectively and scaled by . Another approach considered in this work and proposed in Refs.Gninenko:2013rka ; Andreas:2013lya , is based on the detection of the large missing energy, carried away by the energetic produced in the interactions of high-energy electrons in the active beam dump target, see also Izaguirre:2014bca . The advantage of the second type of experiments is that their sensitivity is roughly proportional to the mixing squared, , associated with the production in the primary reaction and its subsequent prompt invisible decay, while in the former case it is proportional to , one coming from the production in the beam dump and another from the cross section of the dark matter particle interactions in the active detector.

In this work we discuss the fixed-target experiment NA64 at the CERN SPS Gninenko:2013rka ; Andreas:2013lya aiming at the search for decays with a 100 GeV electron beam. Different background sources that could mimic the signal in this experiment were studied in detail in Refs.Gninenko:2013rka ; Andreas:2013lya , see also Izaguirre:2014bca . It has been shown that for the mixing and masses GeV the proposed search is expected to be background free at the level per incident electron. Here, we focus mainly on the production rate, experimental signature of the decays, and sensitivity of the experiment. Our goal is two-fold. First, in light of recent disagreements in the literature on the question of the yield computations Izaguirre:2014bca , we revisit here the calculations of Ref.Gninenko:2013rka ; Andreas:2013lya . We seek to clarify the apparent disagreements about the numerical factors in the analytic expressions for the yield computations. Obtaining a reliable theoretical prediction for the yieldis essential for the proper interpretation of the obtained experimental results in terms of the possible observation of the signal or obtaining a robust exclusion limits in the parameter space.
Second, we attempt to provide an estimate of the experimental uncertainties associated with the signal calculation required for the sensitivity estimate. While the study of Ref.Izaguirre:2014bca included some theoretical uncertainties associated with the modeling and experimental data used as input for the calculation, no estimate of the errors and factors related to the concrete experimental setup configuration was given. We discuss additional experimental inputs that would be useful to improve the reliability of the calculated sensitivity of the experiment. We extend the analysis of Ref.Andreas:2013lya by simulating the full detector response and taking into account the realistic production and detection efficiency for signal events. Finally, the feasibility of reconstruction of the signal parameters such as the mass and the mixing strength of the from the observed shape of the spectrum has been studied for the values and 200 MeV and .
The remainder of our treatment of these issues is organized as follows. Section II outlines the theoretical setup for the production in electron- nuclei scattering, observables that are analyzed and the signal simulation. The results of the detector response simulation are reported in Section III. Section IV is dedicated to the discussion of the missing energy signature of the signal events yield. The results of the detailed detector response simulation and some background issues are reported in Section V and Section VI, respectively. In Section VII the expected sensitivity of the search is discussed and compared with the existing calculations obtained by Izaguirre et al. in Izaguirre:2014bca . We conclude the article with a short summary in Section VIII.
II The production and spectra
The Lagrangian of the SM is extended by the dark sector in the following way:
| (1) |
where is massive vector field of spontaneously broken gauge group, and is parameter of photon-paraphoton kinetic mixing. Here, we consider as an example the Dirac spinor fields which are treated as Dark Matter fermions coupled to by dark portal coupling constant . The mixing term results in the interaction:
| (2) |
of dark photons with the ordinary matter. The decay rates of and are given by
| (3) |
We suppose that dark matter invisible decay mode is predominant, i.e. . This means that the lepton decay channel is suppresed, .
We consider the high-energy electron beam absorption in the active target as a source of s. In this case dark photons can be produced in the bremsstrahlung off nuclei due to the mixing (see Fig. 1) and subsequently decay invisibly ():
| (4) |
The -production cross section in this process was calculated Bjorken:2009mm in the Weizsäcker-Williams (WW) approximation Tsai:1986tx , namely
| (5) |
where is the energy of incoming electron, is the energy of , , is the angle in the lab frame between the emitted and the incoming electron, is the atomic number of nucleus ( for lead). The function which determines the virtuality of intermediate electron has the following form:
| (6) |
The effective flux of photons, is defined as follows:
| (7) |
where , , , and is the sum of elastic and inelastic electric form factor (for details see e.g. Ref. Bjorken:2009mm and references therein). In the numerical integration (7) we neglect - and -dependences of .
Several additional remarks should be made. First, the approximation of collinear emission is justified for the benchmark points, GeV and GeV, when (see Ref. Bjorken:2009mm for details). Second, one can perform the cross-section (5) integration over and ,
| (8) |
where is the infrared (IR) cut-off of the cross-section, which regulates either soft intermediate electron singularity or validation of WW approximation Bjorken:2009mm .
In order to determine the acceptance of the experiment we perform the signal Monte Carlo simulation. We simulate the electromagnetic shower development in the ECAL (See, Section V) with GEANT4 using the following steps
-
(i)
calculate the total and differential cross-sections of the bremsstrahlung production (5) as a function of the electron energy ,
-
(ii)
at each step of an electron propagation in the lead converters of the ECAL, the emission of the is randomly generated,
-
(iii)
if the emission is accepted, then we generate values of , , and the azimuthal angle ,
-
(iv)
finally, the 4-momentum of the recoil electron is calculated.
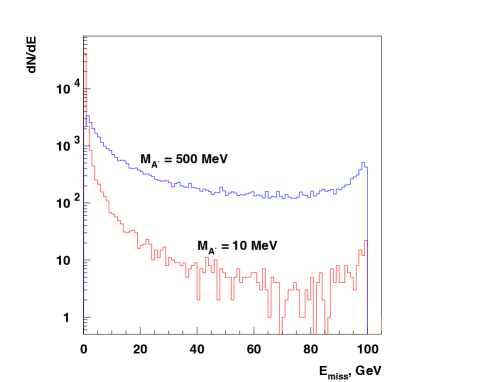
In Fig. 2 an example of the energy distributions calculated for masses MeV and MeV are shown. Note that these distributions represent also the missing energy spectra in the detector.
III The detector
The production is a rare event. For the interesting parameter range it is expected to occur with a rate with respect to the ordinary photon production rate. Hence, its observation represents a challenge for the detector design and performance.
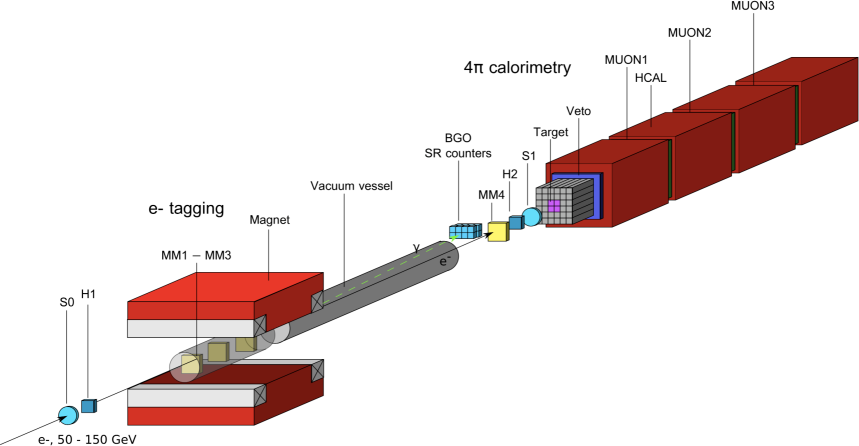
The experimental setup specifically designed to search for the production in the reaction (4) of high-energy electron scattering off nuclei in a high density target is schematically shown in Fig. 3. The experiment employs the upgraded H4 electron beam line at the CERN SPS described in details in Ref.beam . The beam is designed to transport the electrons with the maximal intensity per SPS spill in the momentum range between 50 and 150 GeV/c that could be produced by the primary proton beam of 450 GeV/c with the intensity up to a few 1012 protons on target. The electrons are produced by protons impinging on a primary beryllium target and transported to the detector inside the evacuated beam-line tuned to an adjustable beam momentum. The hadron contamination in the electron beam is and the size of the beam at the detector position is of the order of a few cm2.
The detector shown in Fig. 3 utilizes upstream magnetic spectrometers (MS) consisting of dipole magnets and a low-material-budget tracker, which is a set of Micromegas chambers , MM1-MM4, allowing the reconstruction and precise measurements of momenta for incident electrons Banerjee:2015eno . It also uses the scintillating counters S0, S1 and hodoscopes H1 and H2 to define the primary beam, and the active target , which is the central part of the high-efficiency hodoscopic electromagnetic calorimeter (ECAL) used for the accurate measurement of the the recoil electron energy from the reaction (4). Downstream the target the detector is equipped with high-efficiency forward veto counter V, and a massive, completely hermetic hadronic calorimeter (HCAL). Three straw-tubes chambers, MUON1-MUON3, located between the HCAL modules are used for the final-state muon(s) identification. The modules serve as a dump to completely absorb and detect the energy of hadronic secondaries produced in the electron interactions in the target. In order to suppress backgrounds caused by the detection inefficiency the HCAL must be longitudinally completely hermetic Gninenko:2013rka ; Andreas:2013lya . To enhance its hermeticity, the HCAL thickness is chosen to be (nuclear interaction lengths). The 15 m long vacuum vessel between the magnet and the ECAL is installed to avoid absorption of the synchrotron radiation photons detected at the downstream end of the vessel by the array of BGO crystals for the effective tagging of the incoming beam electrons Gninenko:2013rka .

IV missing energy signature of signal events
The method of the search is the following Gninenko:2013rka . The reaction (4) typically occurs in the first few radiation length () of the ECAL. The part of the primary beam energy is deposited in the ECAL, while the remaining fraction is transmitted by the decay particles through the rest of the detector. As the s are very weekly interacting particles, they penetrate the ECAL, veto V and the HCAL without interactions resulting in the missing energy signature in the detector, see Fig. 3. The occurrence of decays would appear as an excess of events with single e-m showers in the ECAL, and zero energy deposition in the rest of the detector, above those expected from the background sources. The signal candidate events have the signature:
| (9) |
and should satisfy the following selection criteria:
-
(i)
The momentum of the incoming particle track should correspond to the beam momentum.
-
(ii)
The starting point of the (e-m) shower in the ECAL should be localized within a few first s.
-
(iii)
The lateral and longitudinal shape of the shower in the ECAL is consistent with the one expected for the signal shower. The fraction of the total energy deposition in the ECAL is . where is the benchmark electron beam energy, GeV. This implies the selection condition for the recoil electron GeV. Therefore, the missing energy should be .
-
(iv)
No energy deposition in the V and HCAL.
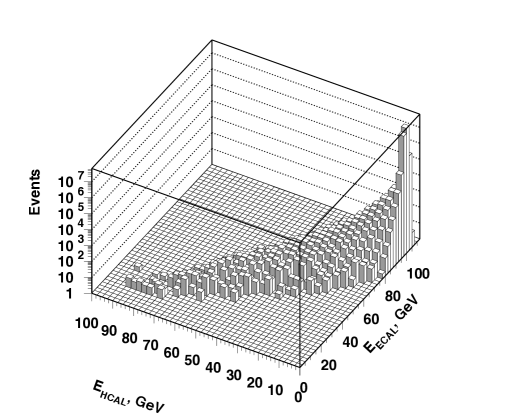
In Fig. 4 the expected distributions of events in the (;) plane from the SM interactions induced by the 100 GeV ’s in the ECAL target (left plot) and from the same reactions plus the emission in the process (4)(right plot). The only event selection criterium used is the requirement of no simultaneous signals in the muon counters MUON2 and MUON3 and energy deposition in the last two downstream HCAL modules. Such signature give evidence for the presence of minimum ionizing particles (MIP), presumably muons, in the final state which typically originate from the decays in-flight resulting in the missing energy in the event due to emission of neutrinos. One can see that the experimental signature of the production in the reaction (4) is an event with the missing energy from the region and . The typical values for the ECAL and HCAL threshold energies are expected to be GeV, i.e. GeV, and GeV, respectively. The events in this region are supposed to be from the reaction (4) as a large fraction of the primary beam energy is carried away by the , those spectrum shown in Fig. 4 for MeV, and mixing strength . For the ECAL, the value of is defined by the shape of the low energy tail of the ECAL response function to the monochromatic electron beam. This tail is mostly due to i) the longitudinal fluctuations of the e-m shower development and corresponding leak energy, and ii) electroproduction of hadrons by primary electrons in the target. The value is defined mostly by the noise level of the HCAL electronics, energy leak from the ECAL, and pileup events, see Section V.
The distributions shown in Fig. 4 are obtained with simulated with GEANT4 events. Due to the small coupling strength of the the reaction (4) occurs typically with the rate per the incoming electron interaction. To study the SM distribution and background (see Section V) at this level would require the simulation of a very large number of events resulting in a prohibitively large amount of computation time. Consequently, only of the required statistics for the SM reactions were simulated.
V The ECAL response to the signal events
The use of the ECAL is twofold. On the one hand, it serves as an active target to measure the total energy deposition in the beam dump. On the other hand, it has longitudinal and lateral granularity allowing additional suppression of the hadronic background by studying the shower shape. Simulations performed with GEANT4 show that by using the electromagnetic and hadronic shower profiles in the calorimeters, both lateral and longitudinal, it is possible to further improve the rejection by a factor of 5-10. Longitudinally the ECAL is subdivided in two parts: preshower and absorption part. The preshower has 4 radiation lengths of lead and plays an important role in the hadron background rejection obtainable with the ECAL. Hadron rejection is ultimately limited by such processes as charge exchange () where most of the energy of the charged pion goes to one or more neutral pions. The s immediately decays into photons starting a cascade shower which is indistinguishable from the electron-initiated shower. Thus, charge exchange interactions of the beam pions occurring near the front of the ECAL array and accompanied by a poor detection of the rest of the final state cannot be separated from the reaction (4) Gninenko:2013rka . The additional suppression of such processes can be provided by using the lead as the calorimeter passive material (it has a smaller number of interaction lengths per radiation length) by the requirement of the early development of the shower.
The events are supposed to be reconstructed in the ECAL as electromagnetic showers. Therefore, the question arises to what extend the properties of the electromagnetic shower in the ECAL from the reaction (4) are identical to the properties of the ordinary shower induced by an electron with the same energy deposition in the ECAL. For example, one could suggest that the emission of a high-energy could make the residual electromagnetic shower development slightly asymmetric resulting in modification of the lateral shower profile exceeding the ordinary shower fluctuations. This could change the selection efficiency of the cuts iii) of Section IV. To answer this question we have compared the lateral and longitudinal electromagnetic shower profiles in the ECAL for ordinary and signal electromagnetic showers induced by the reaction (4). In this study the shashlik ECAL used in simulations has the following characteristics:
-
(i)
It is a matrix of 6x6 cells, each with dimensions mm3.
-
(ii)
Each cell is (1.50 mm Pb + 1.50 mm Sc) x 150 layers or 40 radiation length ().
-
(iii)
Each cell is longitudinally subdivided into two parts: preshower section (PS) of 4 and the main ECAL of 36 .
-
(iv)
The simulated energy resolution is
V.1 Longitudinal shower development
One of the sources of background is expected from hadron interactions in the ECAL that could mimic the signal Gninenko:2013rka . The electron-hadron separation in this case can be improved if we measure the electromagnetic shower development at an early stage by using the ECAL preshower section. Then the question arises how identical are the longitudinal development of showers induced by the signal reaction (4) and by an ordinary electron and how the applied hadron rejection cuts affect the signal efficiency. In this section, we take a step toward answering this question. We examine the qualitative features associated with the longitudinal distributions of deposited energy by showers induced by pions, electrons and signal events, and assess to what extent these features are affected by dark-photon emission for the signal events.
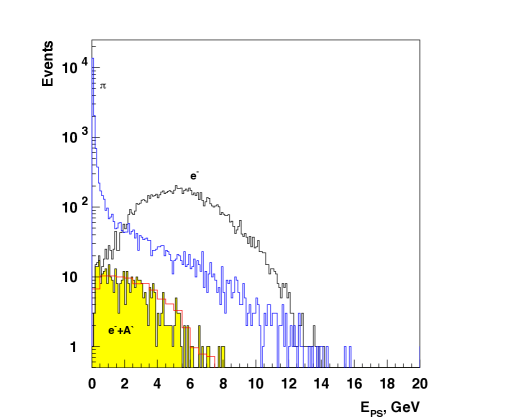
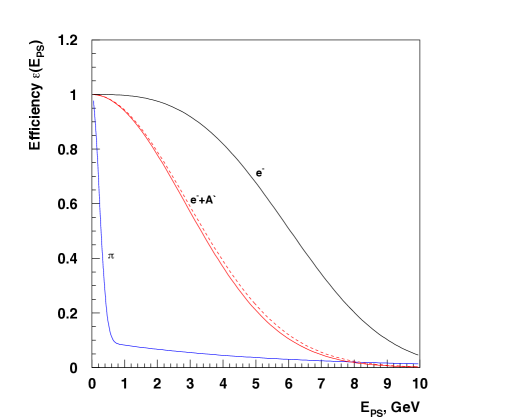
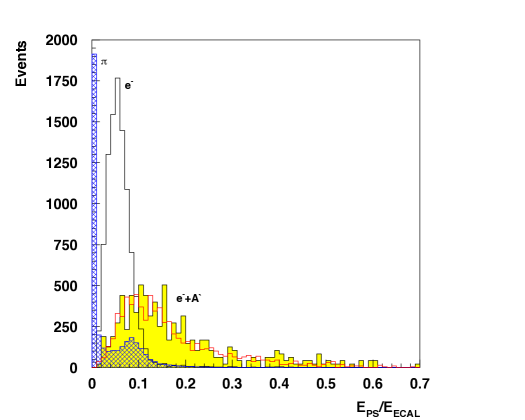
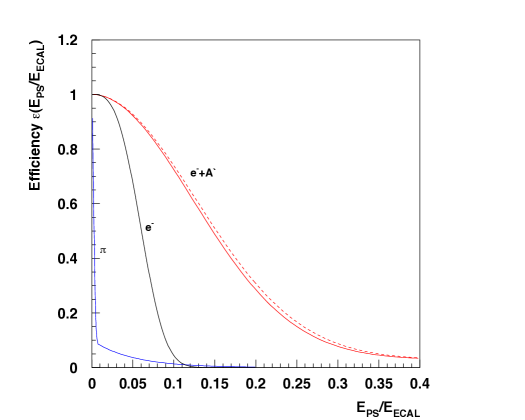
We use variable - the ratio of the energy deposit in the PS to the total energy deposit - to evaluate the pion rejection factors at given electron and signal efficiencies. The distribution of energy deposited in PS and the ratios for 100 GeV showers induced by the pions, electrons, and signal events is shown in the lhs of Fig. 5 and Fig. 6, respectively. The electron, pion and signal efficiencies as functions of the threshold on the and values are shown in the rhs of Fig. 5 and Fig. 6, respectively. For the signal events the calculations are performed for . One can see that for the case the fluctuations of the ratio are significantly large then for the electron case: the value ranges from 0 to , while for the electron induced events it is in the region . By comparing spectra, one can also see that distributions for signal events are weakly dependent on the mass. Interestingly, for the same threshold on the value, the electron efficiency is higher than the signal one, as shown in Fig. 5. In order to keep the threshold should be GeV. However, for the same threshold , the situation is opposite, and the signal efficiency is higher compared to the electron one, , as shown in Fig. 6. This is because the emission of the with the energy is typically occurs in the early stages of the electromagnetic shower development. After the emission, the residual shower has much lower energy than the primary electron energy, and thus is also shorter in length. Therefore, larger fraction of its energy is deposited in the first PS part of the ECAL.
V.2 Lateral shower development
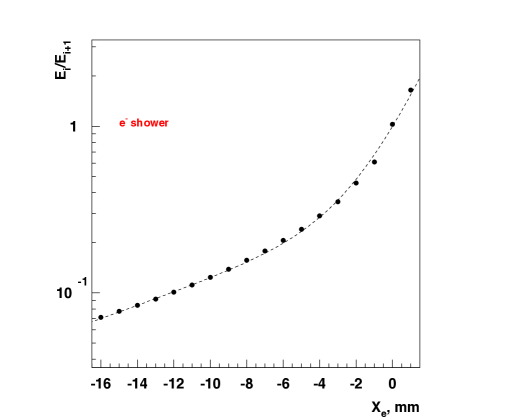
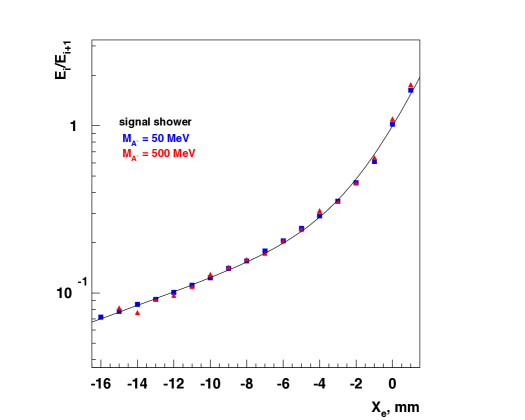
Fig. 7 shows the simulated dependence of the average ratio of energies deposited in two adjacent counters on the electron coordinate for both electron and signal showers for masses and 500 MeV. The coordinate mm corresponds to the centre of the (i+ 1)th cell of the ECAL, while is the boundary between the ith and (i + 1)th cells. With the obtained dependence of the ratio on one can define the shower profile , which is the energy release as a function of the distance from the shower axis well described by two exponential functions:
| (10) |
The fit shown in Fig. 7 results in mm, mm and for electron and mm, mm ( mm, mm) and () for signal evens with (500) MeV, which are in good agreement with each other for both mass values.
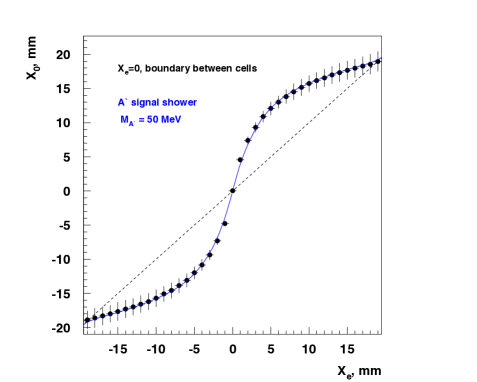
The simplest method to determine the coordinates of high energy photons and electrons in a granular calorimeter is to measure the ”center of gravity” of the electromagnetic shower induced by them Akopdzhanov:1976pr :
| (11) |
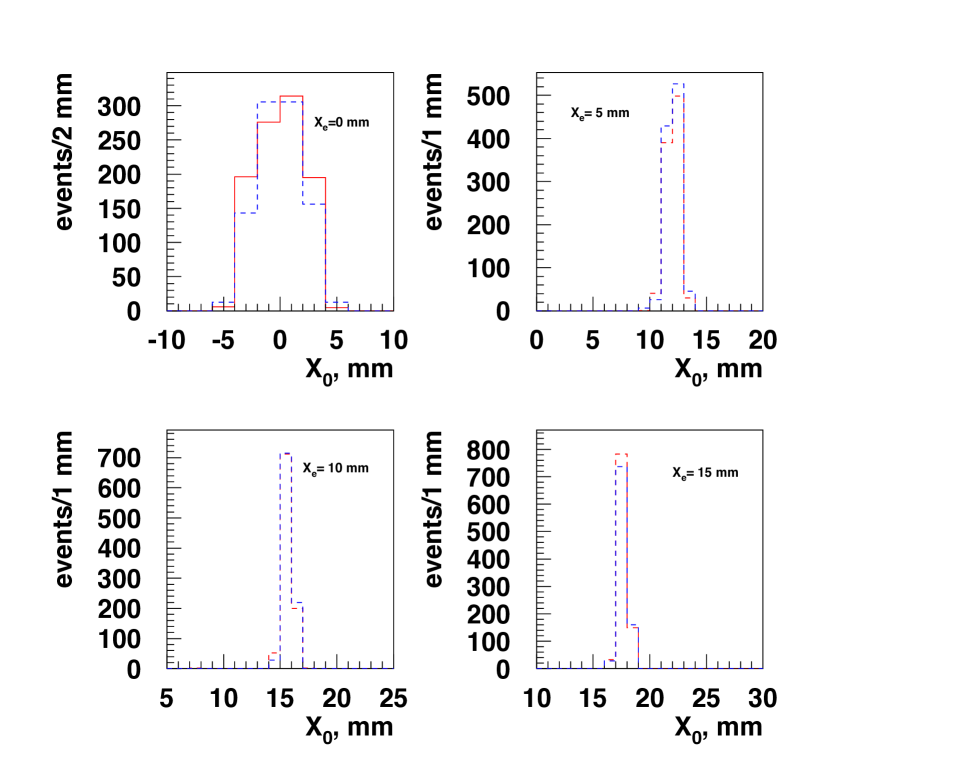
where is the half-width of the ECAL cell. In Fig. 8 the calculated with Eqs.(10,11) coordinates of the shower centre-of-gravity at different positions of the true coordinate of incoming electrons are shown. The position for this case corresponds to the cell centre. Dots show the reconstructed values for , the error bars represent uncertainties () in the coordinate reconstruction. The reconstructed -coordinate of the signal e-m showers for both cases shown in Fig. 9 are shifted with respect to the true coordinate of the primary electron . The distributions are found to be very similar to each other. For example, they are practically identical for the beam positioned at the boundary between the cells, where the difference due to transverse shower fluctuations is expected to be most significant. The deviation from linearity is due to the two-exponential shape of the e-m shower profile in the ECAL calculated with Eq.(10) for pure electron and signal events. One can see that both dependences are very similar. This nonlinearity can be corrected with technique described e.g. in Ref.Akopdzhanov:1976pr ; Davydov:1976vm . From Fig. 9 we conclude that the shape selection efficiency for signal events with given X,Y cuts will not differ from the efficiency for pure electrons with the same energy deposition in ECAL.
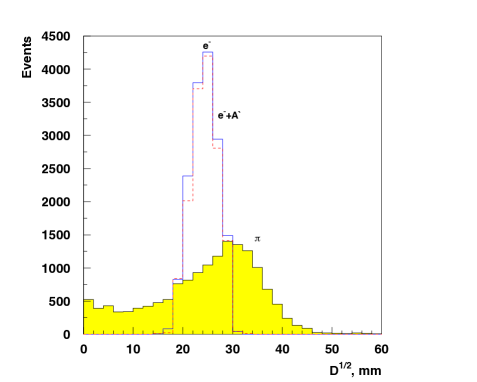
As discussed previously, simulations of the energy response to hadrons show that there is a non-zero probability that the observed energy deposition, e.g. of a pion is consistent with that of an electron. The lateral shower shape information can also be used to reduce the probability of primary electron misidentification. As a characteristic for the shower width in the ECAL we have used its dispersion , which can be defined as Davydov:1976vm :
| (12) |
where are the coordinates of the center of the ith cell. The simulated distribution of the -value, representing the ”effective radius” of showers induced in the ECAL by the 100 GeV electron, pions and signal events for the with mass 200 MeV is shown in Fig. 10. As one can see from the figure, electron and signal showers in the ECAL are practically identical, but differ essentially in their widths from hadronic showers. By introducing criterium to select the showers by their dispersion allows one to suppress hadron detection by an additional factor , which is weakly depends on the mass.
Finally, the main conclusion of this study is that while the properties of electromagnetic showers induced by the signal and ordinary electrons are practically identical for the lateral shower development, the use of selection cuts on longitudinal shower development in the ECAL results in significant corrections for the signal efficiency.
| Selection cut | Expected efficiency |
|---|---|
| Preshower 0.03 | |
| 0.5 | |
| ECAL X,Y matching | |
| rejection, ECAL shower shape | |
| VETO energy MeV | |
| HCAL energy GeV | |
| Total efficiency, |
V.3 The Veto and HCAL response to signal events
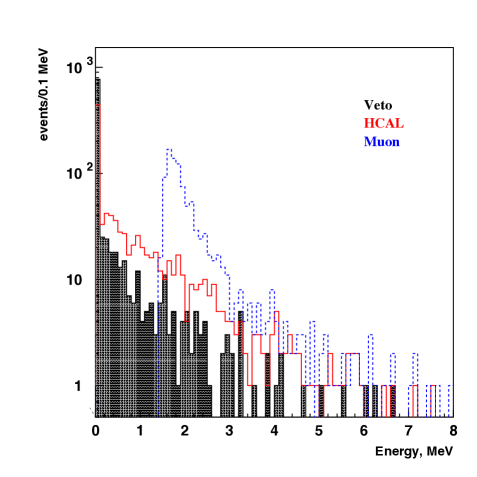
One of the main variables defining the sensitivity of the experiment is the effective width of the signal event distribution, shown in Fig. 4, along the -axis. The spread of the energy deposition of signal events in the HCAL is defined by the energy leak from the shower tail due to fluctuations the longitudinal shower development and also by the admixture of the pule-up events. The hadronic calorimeter is a set of four modules. Each module is a matrix of 3x3 cells. Each cell is a sandwich of alternating layers of steel and scintillator plates with thicknesses of 25 mm and 4 mm, respectively, and with a lateral size of mm2. Each cell consists of 48 such layers and has a total thickness of . The amount of the leak energy from the ECAL to the HCAL depends on the primary beam energy. The thickness of the ECAL was chosen using the full shower simulation to minimize the amount of energy that leak into the Veto and HCAL. The purpose was to reduce it down to the level MeV (the PED width of the HCAL electronics). In Fig. 11 the spectrum of the leak energy is shown.
VI Background
The background reactions resulting in the signature of Eq.(9) can be classified as being due to physical- and beam-related sources. The discussions of these backgrounds are given in Refs. Gninenko:2013rka ; Andreas:2013lya . In this Section we consider several additional background sources not studied in Refs. Gninenko:2013rka ; Andreas:2013lya and show that their level is below the expected sensitivity of the experiment.
-
•
One possible source of background is caused by the large transverse fluctuations of hadronic showers from the reaction
(13) induced by electrons in the ECAL. In such events all secondary long-lived neutral particles (such as neutrons and/or ’s) could be produced in the target at a large angle, punch through the HCAL without depositing energy and escape the detector through the lateral surface resulting in the fake signal event. Note that background from events with a leading neutral(s) is strongly suppressed by the HCAL thickness of in the forward direction.
The probability for the reaction (13) to occur can be estimated as
(14) where are, respectively, the fraction of the reaction (13) per incoming beam electron, probability for production of energetic particles at large angle, the probability for these particles to escape the HCAL without interactions. From the NA64 test run the fraction of events with a pure neutral hadronic final state in the reaction of 100 GeV electron scattering in the ECAL target is found to be per beam electron na64 . The value can be estimated as a probability for two neutrals with the total energy GeV-the threshold for in the experiment- to escape HCAL by crossing at least each, under assumption that both are produced at an angle of . This gives .
Because the cross section of the reaction (13) is difficult to simulate, in order to estimate this background we use the results of the NOMAD experiment which studied large transverse fluctuations of hadronic showers induced by pions nomad1 ; nomad2 . In these measurements the probability to observe in an ECAL matrix a cluster with the energy greater than a given fraction of the incoming pion with GeV, and at a distance from the beam axis has been measured. For example, the probability to find a separated cluster with the energy at a distance 30 cm (or ) from the beam axis was found to be per incoming pion. The measurements also show that the probability drops very quickly with increasing of the beam energy, (), or . E.g. for the same and , the above value is higher by a factor for 6 GeV pions. Neglecting this and also the difference in development of hadronic showers induced by pions and electrons, we may consider the value as an upper limit on the probability for the production of large angle neutrals with energy GeV at the beam energy GeV. Taking this into account results in a conservative estimate for this background to be at the level per incoming electron. Note, that the requirement to have two large angle neutrals carrying the total hadronic energy GeV in the reaction (13), not GeV as discussed previously, would significantly suppress background further. One may also consider more natural production angles smaller that . But in this case, the neutrals should pass without interaction longer distance in the HCAL and the probability decreases quickly as . For example, if neutrals escape the first HCAL module just at its far end, the . Combining this with the probability results in -value from Eq.(14) already very small, .
Finally, we note that the presented estimate gives an illustrative order of magnitude for the background level from the large transverse fluctuations of hadronic showers produced in the reaction (13) and may be further improved either by more detailed simulations of the experimental setup, or by direct measurements similar to the NOMAD ones.
-
•
Another background can be due the electroproduction of di-muon pairs:
(15) when the incident electron produces in the ECAL target a high-energy bremsstrahlung photon, which subsequently converts into a pair in the field of the Pb nucleus. This process could mimic the signal either i) due to muons decay in flight inside the ECAL target into state, or ii) if the muons escape detection in the V and HCAL modules due to fluctuations of the energy (number of photoelectrons) deposited in these detectors. For the case i) the relatively long muon lifetime results in a small probability to decay inside the ECAL. Assuming decay length of cm, a high suppression factor for this background source is calculated. Taking into account the additional suppression factor of due to the cross-section of the reaction (15) makes this background negligible. For the case ii) the background is suppressed by the high-efficiency veto system V+HCAL. The V is a cm thick high-sensitivity scintillator arrays with a light yield of photoelectrons per 1 MeV of deposited energy. The simulated distribution of energy deposited by muons in the V counter is shown in Fig. 11. It is also assumed that the veto inefficiency for a single muon detection is, conservatively, for the threshold MeV ( photoelectrons). The number of photoelectrons produced by a MIP crossing the single module is in the range 150-200 photoelectrons. All these factors lead to the expectation for this background to be at the level at least assuming 20-30 photoelectron threshold in the HCAL for two-MIP events.
-
•
The statistical limit on the sensitivity of the NA64 experiment is set by the number of accumulated events which depend on the beam intensity. The intensity is limited by the ECAL signal duration ( ns) resulting in a maximally allowed electron counting rate of s in order to avoid significant loss of the signal efficiency due to the pileup effect. To evade this limitation, one could implement a -pileup removal algorithm to allow for high-efficiency reconstruction of the signal shape and energy in high electron pileup environments, and run the experiment at the electron beam rate a few .
In addition, a random superposition of uncorrelated low-energy, 50 - 70 GeV, electron and 100 GeV pion (or muon) events occurring during the detector gate-time could results in the following fake signal. The low energy electron emits an amount of synchrotron radiation energy which could still be above the detection threshold and then is deflected by the magnet so it does not hit the ECAL, see Fig. 3. While the accompanying (or ) decays in-flight in front of the ECAL into the () state with the decay electron energy less then the beam energy, thus resulting in the signal signature of Eq.(9).
This background sources is related to the low-energy tail in the energy distribution of beam electrons. This tail is caused by the beam electron interactions with a passive material, such e.g. as entrance windows of the vacuum lines, residual gas, etc. in the upstream part of the beam line. Another source of low energy electrons is due to the or decays in flight. Taking into account that the fraction of such electrons with energy GeV in the 100 GeV electron beam could be as large as , the time resolution of the and events is of the order of ns, the fraction of () in the beam is (), and the probability of the decay is ( for ) results in the level of this background to be less than () for ’s (’s) per electron for the beam intensity s.
VII Expected results
In this section we consider two possible outcomes of the experiment: A) observation of an excess of signal events associated with the reaction (4), B) no excess of signal events is observed.
VII.1 Extraction of the parameters and using the missing energy spectrum.
For the case of signal observation we performed a pseudo-experiment aiming at the study of the possibility of extraction of the parameters and . As an example, we consider values for the mass and 200 MeV MeV and mixing strength . Two possibilities were considered.
For the case of the signal events observation it would be possible to determine a band of allowed values in the two-dimensional plot (). This could be done as follows. The observed number of signal events passing the selection cuts is distributed according to Poisson statistics
| (16) |
where is the average number of signal events from the target. The depends in particular on , - the total number of electrons on target, and is given by
| (17) |
where is density of Pb target, is the Avogadro’s number, is the Pb atomic mass, and is the overall signal selection efficiency, see Table 1. The integration in Eq. (17) is performed over the missing energy spectrum in the ECAL target, see Fig.2. The equation Eq.(17) can by approximated by the form
| (18) |
where parameter weakly depends on . For example, for masses and 200 MeV, the values are 1.34 and 1.12, resulting in the yield (20 MeV) and (200 MeV)= 30 events, respectively, for , and .
If the Poisson distribution is approximated by the Normal distribution. Hence, for given values, the number of signal events at ”one-sigma” confidence level is given by
| (19) |
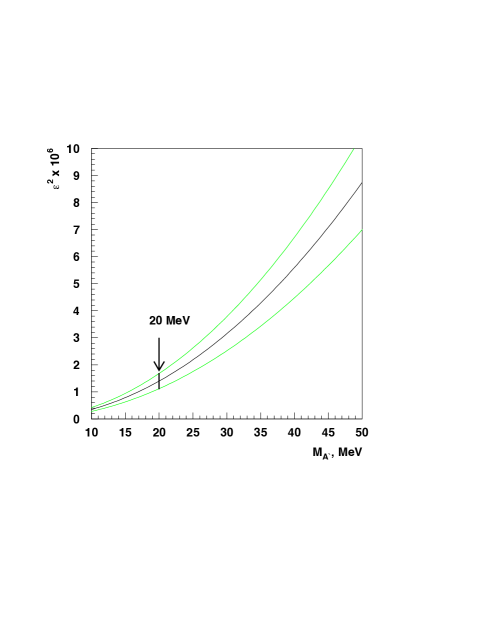
Using the expression (18) for the parameter and inequality (19), one can estimate from the data the ratio . An example of such estimate for , MeV, and is shown in Fig. 12. In this case one can expect to observe signal events.
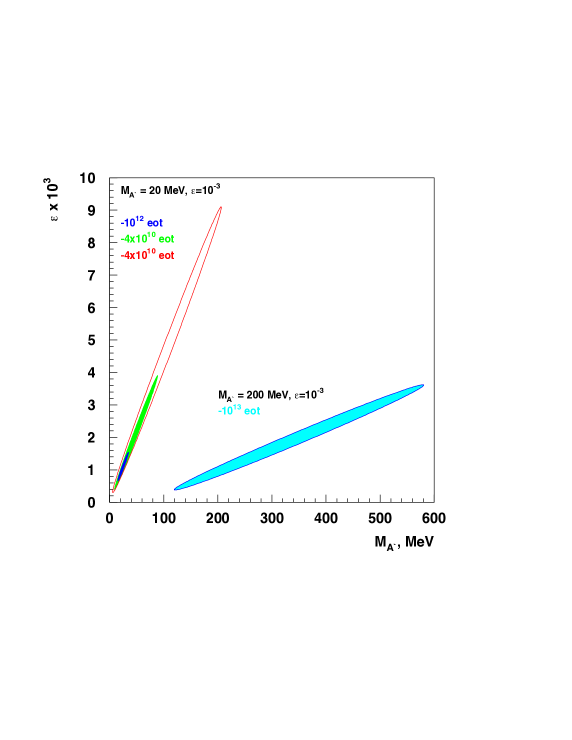
For the case of , MeV and larger number of the signal events observation, , it should be possible to perform the more precise measurement of the correlated parameters and . This measurement is based on Eq.(8) and the dependence of the shape of the missing energy spectrum on , which is, as shown in Fig. 2, most significant in the region . In this study, we assume that the shape in this region is determined only by statistical errors. Two intervals of missing energy and were considered for comparison.
Then, the following steps are made. On a grid of different and parameters for each point we performed comparison of the distribution from ”observed” number of events with the simulated spectra. The Kolmogorov and tests, used for the shape compatibility check, give rather similar results. The allowed regions with probabilities (p-values) expressed in terms of the corresponding numbers of standard deviations were finally obtained. In Figure 13 examples of the one standard deviation ”ellipse” contours for the best fit parameters for the different thresholds on and numbers of accumulated eot is shown. The best fit parameters are found to be MeV and for the collected electrons, which corresponds to a few months of running. Note, that for higher masses MeV, the precision in determining of the parameters and for the given value of drops quickly with increasing of the mass .
| , MeV | ||||||
|---|---|---|---|---|---|---|
| | | | | | | |
| 2 | ||||||
| 10 | ||||||
| 50 | ||||||
| 500 | ||||||
VII.2 Expected sensitivity
In this section we consider expected bounds on dark photon parameter space based on the GEANT4 MC simulation of the yields in the NA64 experiment. We define the acceptance of the detector as the ratio of signal events with the missing energy to the total number of events with a dark photon emitted in the target. All bounds are calculated under assumption that no background events are observed for the given number of accumulated eot.
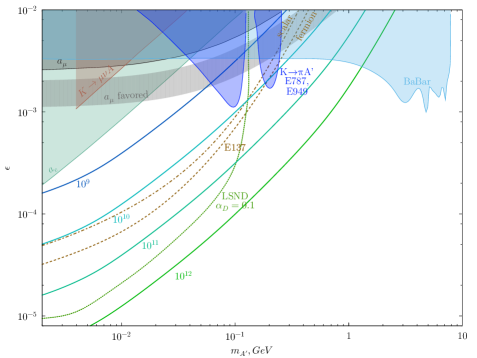
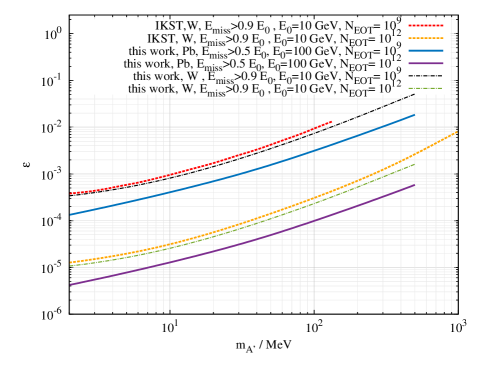
Using Eq.(17) and the relation , where is the 90 upper limit for the number of signal events without background, , one can determine the expected bounds on parameter space, which are shown in Fig. 14. The bounds are obtained for the total number of electrons on target , and and the electron beam energy GeV. We assume that the s decays dominantly to the invisible final state. In Fig. 15 and Table II we show detailed comparison of the expected sensitivity for the invisible decay search in our experiment calculated in this work with the one evaluated by Izaguirre et al. in Ref.Izaguirre:2014bca for the case of the W-Sc ECAL and eot. The comparison is made for the case of the same type of the ECAL (the W-Sc sandwich calorimeter Gninenko:2013rka ; Andreas:2013lya ) , the beam energy GeV, the missing energy range and for and eot. Our results for the case of the Pb-Sc (shashlik) ECAL, the beam energy GeV, the missing energy and eot are also shown for comparison. For the former case, the expected bounds for tungsten ECAL are in agreement with IKST limits within 10 %. In Tab. 2 we show the expected limits on mixing at 90 % CL for the relevant benchmark masses and ECAL energy thresholds. For the second case, one can see that the sensitivity is two times better than for the former one. This is mainly due to the extension of the allowed missing energy region from to for signal events.
VIII Summary
In this Section, we briefly outline the main improvements achieved in this article with respect to our previous work, as well as the recent work carried out by another group. We have studied the missing energy signature of the production of sub-GeV dark photons in the process of high-energy electron scattering off nuclei in the experiment NA64 aiming at the search for decays at the CERN SPS. We have shown the distinctive distributions of these events that serve to distinguish the signal from background. The results of the detailed simulations of the detector response and efficiencies to the signal events are presented. The comparison of the lateral shower profiles for the electron and signal events in the ECAL show that they are identical with high accuracy. No significant difference is found. While the longitudinal development of the electron and signal induced showers in the ECAL is quite different. Thus a special attention is required to the selection of a threshold for the energy deposited in the preshower to keep the signal efficiency as high as possible.
Using these results we evaluate the expected sensitivity of the experiment and show that it potentially allows to probe the still unexplored area of the mixing strength and masses GeV. The results obtained are found to be in agreement with the results of Ref.Izaguirre:2014bca obtained for the same experimental setup and selection criteria. For a realistic study of the expected sensitivity of the experiment we have improved on two points: we employed the production into the GEANT4 simulation package, and performed the full simulation of the detector response to the signal events. We re-checked the results of Ref.Izaguirre:2014bca where the yield was carefully derived, and improved it further by taking into account the simulation of the realistic detector configuration, the detector response and the corresponding efficiencies. We believe that the error of the estimates of the experiment sensitivity obtained in in those two works is unlikely exceed 10%, which could be attributed to the uncertainty of the yield. Taking as a banchmark the and 200 MeV and values we have determined these parameters by fitting Monte Carlo simulated distributions. The best fit parameters are found to be MeV and for the accumulated eot. We also determined the contours in the () parameter space and demonstrated that in the case of signal observation estimated sensitivity of the search allows to determine its parameters with precision which strongly depends on the number of accumulated eot.
Acknowledgments
We would like to thank members of the NA64 Collaboration for the numerous discussions, and, in particular R. Dusaev and B. Vasillishin for their help. We are grateful to the authors of Ref.Izaguirre:2014bca for letting us now their results prior the publication, and in particular to P. Schuster for useful comments. The work of D.K. on simulations of signal events has been supported by the RSCF grant 14-12-01430.
References
- (1) L. B. Okun, “Limits Of Electrodynamics: Paraphotons?,” Sov. Phys. JETP 56 (1982) 502 [Zh. Eksp. Teor. Fiz. 83 (1982) 892].
- (2) P. Galison and A. Manohar, “Two s or not two s ?”, Phys. Lett. B 136 (1984) 279.
- (3) B. Holdom, “Two U(1)’s and Epsilon Charge Shifts,” Phys. Lett. B 166, 196 (1986).
- (4) N. Arkani-Hamed, D. P. Finkbeiner, T. R. Slatyer and N. Weiner, “A Theory of Dark Matter,” Phys. Rev. D 79 (2009) 015014.
- (5) G. W. Bennett et al. [Muon g-2 Collaboration], “Final Report of the Muon E821 Anomalous Magnetic Moment Measurement at BNL,” Phys. Rev. D 73 (2006) 072003.
- (6) J. D. Bjorken, R. Essig, P. Schuster and N. Toro, “New Fixed-Target Experiments to Search for Dark Gauge Forces,” Phys. Rev. D 80, 075018 (2009)
- (7) R. Essig et al., “Working Group Report: New Light Weakly Coupled Particles”, arXiv:1311.0029 [hep-ph].
- (8) S.N.Gninenko and N.V.Krasnikov, Phys. Lett. B 513, 119 (2001).
- (9) P.Fayet, Phys. Rev. D 75, 115017 (2007).
- (10) M. Pospelov, “Secluded U(1) below the weak scale,” Phys. Rev. D 80 (2009) 095002
- (11) E. Izaguirre, G. Krnjaic, P. Schuster and N. Toro, “Testing GeV-Scale Dark Matter with Fixed-Target Missing Momentum Experiments,” Phys. Rev. D 91, no. 9, 094026 (2015).
- (12) M. D. Diamond and P. Schuster, “Searching for Light Dark Matter with the SLAC Millicharge Experiment,” Phys. Rev. Lett. 111 (2013) 22, 221803.
- (13) H. Davoudiasl, H. S. Lee and W. J. Marciano, “Muon , rare kaon decays, and parity violation from dark bosons,” Phys. Rev. D 89 (2014) 9, 095006.
- (14) B. Batell, R. Essig and Z. Surujon, “Strong Constraints on Sub-GeV Dark Sectors from SLAC Beam Dump E137,” Phys. Rev. Lett. 113 (2014) 17, 171802.
- (15) B. Batell, M. Pospelov and A. Ritz, “Exploring Portals to a Hidden Sector Through Fixed Targets,” Phys. Rev. D 80 (2009) 095024.
- (16) P. deNiverville, M. Pospelov and A. Ritz, “Observing a light dark matter beam with neutrino experiments,” Phys. Rev. D 84 (2011) 075020
- (17) R. Dharmapalan et al. [MiniBooNE Collaboration], “Low Mass WIMP Searches with a Neutrino Experiment: A Proposal for Further MiniBooNE Running,” arXiv:1211.2258 [hep-ex].
- (18) S. N. Gninenko, “Search for MeV dark photons in a light-shining-through-walls experiment at CERN,” Phys. Rev. D 89 (2014) 7, 075008
- (19) S. Andreas et al., “Proposal for an Experiment to Search for Light Dark Matter at the SPS,” arXiv:1312.3309 [hep-ex].
- (20) Y. S. Tsai, “Axion Bremsstrahlung By An Electron Beam,” Phys. Rev. D 34, 1326 (1986).
- (21) See, for example, http://sba.web.cern.ch/sba/
- (22) D. Banerjee, P. Crivelli and A. Rubbia, “Beam Purity for Light Dark Matter Search in Beam Dump Experiments,” Adv. High Energy Phys. 2015 (2015) 105730.
- (23) G. A. Akopdzhanov et al., “Determination of Photon Coordinates in Hodoscope Cherenkov Spectrometer,” Nucl. Instrum. Meth. 140 (1977) 441.
- (24) V. A. Davydov, A. V. Inyakin, V. A. Kachanov, R. N. Krasnokutsky, Y. V. Mikhailov, Y. D. Prokoshkin and R. S. Shuvalov, “Particle Identification in Hodoscope Cherenkov Spectrometer,” Nucl. Instrum. Meth. 145 (1977) 267.
- (25) NA64 Collaboration. To be published.
- (26) D.Autiero et al. ”A study of the transverse fluctuations of hadronic showers in the NOMAD electromagnetic calorimeter”, Nucl. Instrum. Meth. A 411 (1998) 285;
- (27) S.N. Gninenko ”A study of the transverse fluctuations of hadronic showers in the NOMAD electromagnetic calorimeter” Nucl. Instrum. Meth. A 409 (1998), 583.
- (28) B. Aubert et al. [BaBar Collaboration], “Search for Invisible Decays of a Light Scalar in Radiative Transitions A0,” arXiv:0808.0017 [hep-ex].
- (29) A. V. Artamonov et al. [BNL-E949 Collaboration], “Study of the decay in the momentum region -MeV/c,” Phys. Rev. D 79 (2009) 092004.
- (30) H. S. Lee, “Muon anomaly and dark leptonic gauge boson,” Phys. Rev. D 90 (2014) 9, 091702.
- (31) M. Raggi and V. Kozhuharov, ”Results and perspectives in dark photon physics”, Riv. Nuovo Cim. 38 449, (2015).