Mössbauer parameters of Fe-related defects in group-IV semiconductors: first principles calculations
Abstract
We employ a combination of pseudopotential and all-electron density functional calculations, to relate the structure of defects in supercells to the isomer shifts and quadrupole splittings observed in Mössbauer spectroscopy experiments. The methodology is comprehensively reviewed and applied to the technologically relevant case of iron-related defects in silicon, and to other group-IV hosts to a lesser degree. Investigated defects include interstitial and substitutional iron, iron-boron pairs, iron-vacancy and iron-divacancy. We find that in general, agreement between the calculations and Mössbauer data is within a 10% error bar. Nonetheless, we show that the methodology can be used to make accurate assignments, including to separate peaks of similar defects in slightly different environments.
I Introduction
The ubiquitous nature of iron in silicon feedstock, in the Si melt and in as-grown Si crystals, combined with its high diffusivity and its strong carrier recombination power (particularly in p-type Si), make Fe one of the most feared contaminants in electronic- and solar-grade silicon. In fact, the concentration of atomically dispersed Fe in solar-Si must be kept below a tolerance threshold of only cm-3 to ensure minority carrier lifetimes s.Istratov et al. (2006) This is achieved by storing Fe impurities away from active regions in the form of less harmful precipitates with up to several m in diameter, which in turn poses the latent threat of particle dissolution.Buonassisi et al. (2005) For further details on the subject of iron in silicon the reader is directed to the seminal reviews of Istratov, Hieslmair and Weber.Istratov et al. (1999, 2000)
When dissolved in a Si crystal, Fe atoms occur mostly as interstitial impurities () occupying tetrahedral interstitial sites. This defect is relatively well understood, and spectroscopic signals obtained through electron paramagnetic resonance (EPR), electron-nuclear double resonance,Woodbury and Ludwig (1960); Sieverts et al. (1983); Greulich-Weber et al. (1984) deep-level transient spectroscopy (DLTS),Feichtinger et al. (1978); Wünstel and Wagner (1982) emission channeling,Wahl et al. (2005); Silva et al. (2013) and Mössbauer spectroscopy (MS)Gunnlaugsson et al. (2003a); Yoshida et al. (2006) have been reported extensively. Interstitial Fe in Si becomes mobile above room-temperature. In p-type material it diffuses as a positively charged ion, being readily trapped by negatively charged acceptors to form Fe-acceptor pairs.Macdonald et al. (2005) Two types of iron-acceptor pairs have been reported, namely one with trigonal symmetry and another with orthorhombic symmetry, corresponding to stable and metastable configurations, respectively.Ludwig and Woodbury (1962); Gehlhoff et al. (1988); Spaeth et al. (1998); Istratov et al. (1999) Based on the fully reversible reaction, Zoth and BergholzZoth and Bergholz (1990) proposed a method to quickly estimate the total concentration of Fei in Si samples with a sensitivity of cm-3, conferring significant technological relevance to Fe-acceptor pairs.
While it is consensual that iron impurities occupy interstitial sites under equilibrium conditions, there is convincing evidence for the existence of substantial concentrations of substitutional Fe (Fes) provided by emission channelingWahl et al. (2005); Silva et al. (2013) and Mössbauer spectroscopy.Gilles et al. (1990); Langouche (1992); Weyer et al. (1997, 1999); Yoshida et al. (2002, 2003) However, and despite many attempts, powerful techniques like EPR or DLTS have not detected a signal that can be unambiguously assigned to Fes. This is rather puzzling, as theory predicts Fes to be a paramagnetic deep acceptor in the negative charge state.Estreicher et al. (2008) Since channeling measurements invariably involve implantation of radioactive probe ions (followed by thermal anneals), it seems clear that the presence of Fes could result from the interaction between Fei and vacancies. The same argument can be applied to Mössbauer experiments, where Si vacancies produced either by high-temperature annealing/quenching or by the implantation of precursor isotopes (e.g. 57Mn+ ), could interact with Fei, ending up with Fes defects. However, Mössbauer experiments where Fe was simply introduced by vacuum-deposition of an Fe layer on the surface of samples which were not heat treated, apparently shows a strong Fes-related signal at room temperature, presumably without a deliberate introduction of vacancies.Yoshida et al. (2007)
These observations are rather intriguing, particularly considering that Neutron Activation Analysis (NAA) indicates that the total amount of Fe closely matches that measured by EPR,Weber and Riotte (1980) assigned to the spin-1 state of neutral Fei. In these experiments Fe was introduced by evaporation, followed by in-diffusion at 900ºC-1200ºC and quenching to minimize Fe-precipitation. Furthermore, the site-independent enthalpy of formation per iron atom in Si obtained from NAA ( eV) compares well with the same quantity measured by EPR ( eV), which is only sensitive to Fei. Such agreement provides compelling evidence that, under thermal equilibrium, the vast majority of isolated Fe impurities occupy interstitial sites.
Theoretical modeling, namely electronic structure calculations based on density functional theory, is a powerful way of studying defects and their electronics. The (apparent) contradictions described above call for clarification, particularly in regard to the Mössbauer parameters of Fe-related defects in Si, as well as the equilibrium concentration of Fes (relative to that of Fei). Mössbauer spectroscopy is based on the recoilless emission and absorption of -radiation from and by the nuclei of bound atoms.Yoshida and Langouche (2013) In the absence of a magnetic field at the nucleus, the relevant interactions are electric monopolar and quadrupolar, which are quantified by the Isomer Shift (IS or ) and the Quadrupole Splitting (QS or ) respectively.Greenwood and Gibb (1971); Gütlich (2012); Yoshida and Langouche (2013) In essence, these two parameters are sensitive to the magnitude of the contact electron density and to the non-sphericity of the density surrounding the Mössbauer nucleus (57Fe in this case).
Motivated by the impact of Fe and its complexes on Si based technology, 57Fe MS has been used to study the location, diffusivity and electronic activity of elemental Fe impurities.Langouche (1992); Istratov et al. (1999); Kobayashi et al. (2000); Weyer (2000) A summary of experimental and calculated IS values for Fei and Fes defects in Si and other group IV semiconductors is presented in Table 1. Consistent agreement between theoretical and experimental values of has enabled the identification of Fei and Fes defects in Si, where mm/s and mm/s.Gunnlaugsson et al. (2002a, 2003a); Yoshida et al. (2006) In Ge, the picture also appears to be well established, with experiments and theory suggesting mm/s and a small, albeit positive mm/s.Gunnlaugsson et al. (2003b) In diamond, and despite good agreement between the calculated value and the mm/s resonance assigned to Fei, calculations for Fes severely underestimate the experimental result by a factor ranging between 5 and 10. Finally, in SiC there are two possible sites for Fei and Fes defects. The interstitial impurity can have Si or C first neighbors ( Fei,Si or Fei,C respectively), while substitutional Fe can replace Si or C atoms (FeSi or FeC respectively). While the agreement between theory and experiments is reasonable, only a single resonance has been reported for substitutional Fe, although two peaks are theoretically predicted. Interestingly, the overall trend of the MS peaks in Si, Ge, Diamond and SiC,Gunnlaugsson et al. (2003b); Weyer et al. (2004); Bharuth-Ram et al. (2008) is characterized by a linear increase of and with the distance between Fe and its first neighbors, as depicted in Figure 2 of Ref. Gunnlaugsson et al., 2006a.
| Fei | Fes | |||||||||
|---|---|---|---|---|---|---|---|---|---|---|
| Exp. | Calc. | Exp. | Calc. | |||||||
| C | 0.22111Ref. Weyer et al., 2004 | 0.22222Ref. Bharuth-Ram et al., 1998 | 0.91111Ref. Weyer et al., 2004 | 0.19-0.09222Ref. Bharuth-Ram et al., 1998 | ||||||
| SiC | (Fei,Si/FeC) | 0.67333Ref. Bharuth-Ram et al., 2008 | 0.49444Corresponding to 6H-SiC Ref. Elzain et al., 2014 | NA | 0.55444Corresponding to 6H-SiC Ref. Elzain et al., 2014 | |||||
| (Fei,C/FeSi) | 0.33333Ref. Bharuth-Ram et al., 2008 | 0.27444Corresponding to 6H-SiC Ref. Elzain et al., 2014 | 0.23333Ref. Bharuth-Ram et al., 2008 | 0.24444Corresponding to 6H-SiC Ref. Elzain et al., 2014 | ||||||
| Si | 0.76/0.77555Varies with doping, cf. Ref. Gunnlaugsson et al., 2003a | 0.72666Ref. Abreu et al., 2014 | 0.04555Varies with doping, cf. Ref. Gunnlaugsson et al., 2003a | 0.06666Ref. Abreu et al., 2014 | ||||||
| 0.808777Ref. Yoshida et al., 2006 | 0.89888Ref. Kübler et al., 1993 | 0.043777Ref. Yoshida et al., 2006 | 0.13888Ref. Kübler et al., 1993 | |||||||
| Ge | 0.80999Ref. Gunnlaugsson et al., 2003b | 0.78888Ref. Kübler et al., 1993 | 0.059999Ref. Gunnlaugsson et al., 2003b | 0.08888Ref. Kübler et al., 1993 | ||||||
The electronic activity of and defects in Si has been studied using MS by varying the type and concentration of dopants in the samples.Gunnlaugsson et al. (2002b, 2003a); Yoshida et al. (2007) However, conflicting MS parameters have been reported for some elemental Fe defects in Si. The ISOLDE consortium reported a mm/s peak which is effectively independent of the dopant type and concentration, and was therefore assigned to the neutral charge state of substitutional iron (Fe). From the same experiments, neutral and positively charged defects were assigned to resonances at mm/s and mm/s in n-type and p-type material, respectively.Gunnlaugsson et al. (2002b, 2003a) More recently, and for the same defects, Yoshida and his group reported IS values of mm/s, mm/s and mm/s.Yoshida et al. (2007, 2016)
Other defects were tentatively assigned using MS, namely a quadrupole-split doublet labeled FeN with mm/s and mm/s, assigned to an iron-vacancy (FeiV) pair,Gunnlaugsson et al. (2003a) and another doublet labeled which has been associated to Fe in regions damaged by the ion-implantation process, with mm/s and mm/s.Gunnlaugsson et al. (2002a)
Ab-initio calculations of Mössbauer parameters have played an important role in the interpretation and validation of experimental data. For the particular case of defects in semiconductors, these calculations have been hampered by the fact that solid state effects can only be accounted for if defects are embedded in a sufficiently large supercell or cluster. Owing to the computational effort involved, few attempts to calculate the IS and QS of defects were made,Kübler et al. (1993); Bharuth-Ram et al. (1998) which invariably implied several limitations and approximations like the use of small supercells, a local or semi-local approach to the electronic exchange-correlation interactions, or a non-relativistic treatment of core states. However, state-state-of-the-art calculations employing (linearized) augmented plane-wave methods (eventually complemented by local orbitals), can account for relativistic core and valence states, as well as anisotropy effects in the core potentials. Encouraging results have been recently reported, including the calculation of and in SiC,Elzain et al. (2014) and for more elaborate Fe-related defects in Si such as Fe-vacancy and Fe-interstitial complexes.Abreu et al. (2014) The aim of this work is to review the methodology used to calculate Mössbauer parameters from first-principles, and to apply the protocol to a set of relevant Fe defects in Si. In Section II we describe the methodology used to calculate formation energies, electronic levels, contact densities and electric field gradients. We then proceed to calculate the Mössbauer calibration constants (Section II.5). In Sections III and IV we report the results obtained for Fe defects in Si and other group-IV semiconductors, namely formation energies, electronic levels and Mössbauer parameters, followed by our conclusions in Section V.
II Theoretical method
All calculations were carried out within density functional theory,Hohenberg and Kohn (1964); Kohn and Sham (1965) adopting the generalized gradient approximation to the exchange-correlation potential among electrons as proposed by Perdew, Burke and Ernzerhof (PBE).Perdew et al. (1996, 1997) Mössbauer spectroscopy probes the shape of the electron density at nuclear sites, depending on both core and valence states. This means that the calculation of the Mössbauer parameters requires an accurate description of the coupling between core and valence states, and therefore involves solving an all-electron problem. To this end, contact densities (averaged within the nuclear volume) and electric field gradients (EFG) were calculated using the full-potential all-electron code, employing a basis of augmented plane-waves plus local orbitals (APW+lo).elk On the other hand, for the purpose of describing the geometry and chemistry of Fe defects, core electrons can be safely frozen and considered as if they were bound to free atoms. In this case, ground state structures of supercells with and without defects, their respective energies and defect levels were obtained using the planewave codeKresse and Hafner (1993, 1994); Kresse and Furthmüller (1996); Kresse and Furthm’́uller (1996) with core states treated within the projector augmented-wave (PAW) method.Blöchl (1994); Kresse and Joubert (1999) Supercell structures obtained within the PAW method were subsequently plugged into the all-electron code, in order to extract and values for the Fe defects.
The band structures were sampled over -centered grids of -points along the , and reciprocal lattice vectors, or MP- in abbreviated form.Monkhorst and Pack (1976) The grids employed for each case are reported throughout the text, alongside a description of the corresponding system.
II.1 PAW calculations
For these calculations, PAW potentials (constructed with a specific valence configuration) for , , , and were considered. Kohn-Sham valence states were expanded in plane-waves with kinetic energies up to eV. The electronic spin treatment was collinear and allowed to relax. Atomic coordinates were relaxed using either a conjugate-gradient method or a quasi-Newton algorithm, until the maximum force acting on atoms was not larger than eV/Å.
Iron-related point defects were inserted into 64- and 216-atom supercells with a simple cubic lattice. Unless otherwise specified, isomer shifts and quadrupole splittings were calculated for Fe defects in the smaller supercells, while other defect properties (formation energies, electrical levels, transformation barriers) were calculated using the larger supercells. The lattice parameters were those that minimized the energy of bulk primitive cells, namely Å, Å, Å and Å, for diamond, Si, Ge and 3C-SiC (cubic polytype), respectively. As expected from the use of the PBE functional, these figures overestimate (by less than 1%, except for Ge where the deviation is about 2%) the corresponding experimental lattice parameters of 3.5668 Å, 5.4310 Å, 5.6579 Å and 4.3596 Å.Madelung (1996) For the case of Fe defects in Si-rich SiGe alloys, the host consisted of a Si supercell with one substitutional Ge atom. The lattice parameter Å was scaled linearly between and assuming a Vegard alloying regime. The band structure of all defective supercells was integrated by using MP- -point grids, totaling 8 reducible points. For all group-IV semiconductor primitive cells we employed MP- -point grids.
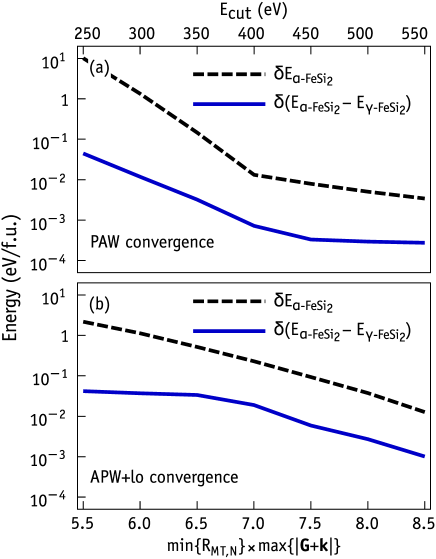
Total energies and energy differences were tested as a function of and -point sampling in order to ensure that the latter converged within 1 meV. For the sake of example, the dashed line depicted in Figure 1(a) represents the variation of the total energy per formula unit (in eV/f.u.) of -FeSi2 as a function of the plane-wave cut-off energy. Specifically, it represents , where is the energy of crystalline -FeSi2 as a function of . Also in the same figure, the solid line shows the variation of the energy difference (in eV/f.u.) between the -FeSi2 and -FeSi2 phases as a function of , with respect to analogous calculations with eV. While the total energy converges within 10 meV around eV, the energy difference is at least one order of magnitude more accurate for the same value of . The Brillouin zone (BZ) integration for the and phases of FeSi2 was carried out on MP- and MP- grids of k-points, respectively.
II.2 APW+lo calculations
The contact densities and EFG tensors for Fe nuclei were calculated using the APW+lo method.Madsen et al. (2001); Singh and Nordstrom (2006) We addressed the all-electron problem self-consistently within density functional theory. Core states were treated relativistically by solving the spherical Dirac equation, while valence states were expanded in APW functions subject to the full potential. The APWs are dual-representation functions that divide the cell volume into two regions, namely a muffin-tin (MT) region comprising non-overlapping spheres with radius centered at each nuclear coordinate , and an interstitial (I) region which is basically elsewhere in the volume of the periodic cell. Electronic states , where and denote spin and band index, are then expanded using a basis of augmented plane waves,
| (1) |
Each partial wave function enclosed by the MT sphere results from the product of a spherical harmonic and the -th energy derivative of the radial solution to the Schrödinger equation for the free atom , , with and being the usual angular and magnetic moment quantum numbers. In this work we considered contributions of APWs with . Each radial function’s derivative depends parametrically on a linearization energy , and is a function of a local coordinate with origin at the -th nucleus. The coefficients are chosen such that each partial wave function matches a plane wave counterpart at the MT/I boundary, where and are a reciprocal lattice vector and a wave vector within the first BZ (special -point), respectively. Note that according to this definition, the Linearized APW (LAPW) schemeAndersen (1975) is readily available by considering only and its first energy derivative in the partial wave expansion. For each calculation the basis was specified by the condition , and the muffin-tin radii for Fe, C, Si, Ge, F, Br and Ti set to 1.11 Å, 0.95 Å, 1.11 Å, 1.27 Å, 0.95 Å, 1.27 Å, and 1.27 Å, respectively.
Further basis flexibility was conferred to the APWs by adding a set of -dependent local orbitals centered on each nucleus,
| (2) |
where the coefficients are determined by normalization and requiring that functions (and eventually their radial derivatives) vanish at the MT boundary. All basis functions and linearization energies were those provided by the official ELK distribution. The potential (and the electron density) also employed a dual representation. Within the MT region is was expanded using lattice harmonics with angular momentum , while across the interstitial region it was expanded in stars of planewaves whose kinetic energies were limited at keV.
Looking at Figure 1(b) it is clear that for a particular basis specification, and analogously to the PAW calculations, energy differences are about one order of magnitude better converged than the total energies. The figure also shows that under production conditions () the energy differences converge within a few meV. The -phase of FeSi2 is metastable with respect to the -phase by eV/f.u. These figures are in agreement with eV/f.u. reported from previous all-electron LAPW calculations.Moroni et al. (1999) Other convergence tests showed that total energies and energy differences varied by less than 2 meV and 0.3 meV with respect to more demanding conditions in describing the potential using and keV.
II.3 Calculation of isomer shifts and quadrupole splittings
For any point far from the nucleus, the potential due to a nuclear charge density can be represented by a multipolar expansion . Each of the resulting terms interacts with the electronic charge density, adding energy terms to the total energy.Greenwood and Gibb (1971) Since the electric monopole term does not account for the finite nature of the nucleus, this method can not describe the electronic contact density and its contribution to . Relativistic and perturbative methods have been employed to solve this problem, where was described by an equivalent uniformly charged sphere of radius .Bodmer (1953) Accordingly, by treating the corresponding potential as a perturbation to , a first order energy correction
| (3) |
is introduced, where is the atomic number, and is the electron contact density due to -electrons. Assuming that the change in the nuclear radius upon a transition is , the corresponding shift in the transition energy isBodmer (1953); Shirley (1964)
| (4) |
Now, if we consider that is unaltered by the surrounding electron density, i.e. that and depend on only, becomes purely dependent on , i.e. on the chemical environment of the nucleus. The isomer shift is defined as the relative difference between values of for two distinct chemical environments, such thatAngeli (2004)
| (5) | |||||
| (6) |
where is the relative contact density between the absorber and source isomers used in velocity-scanning experiments, and is a proportionality factor known as the IS calibration constant. As is a relative quantity, a reference material must be chosen for which . For the 14.4 keV transition in that is usually -Fe (a ferromagnet with body centered cubic structure), and hence . Thus, provided that is known, isomer shifts may be readily estimated from calculated values of and . Details of the calculation of are reported in Section II.5.
The calculation of the contact density involves integrating the electron density within a sphere of radius , here assumed to be,Angeli (2004)
| (7) |
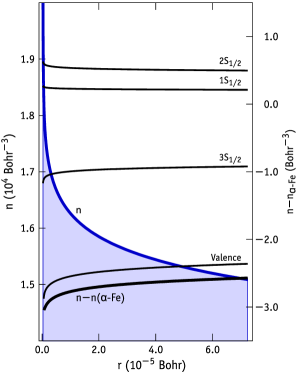
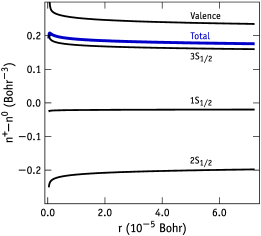
with fm, fm and fm, and is the atomic mass number. For 57Fe this gives fm ( Bohr). For the sake of example, let us briefly describe the calculation of the relative contact density in Equation 6. Figure 2 depicts the radial electron density centered on a neutral Fe impurity located at a tetrahedral interstitial site in a 64-Si atom supercell. The horizontal axis spans the integration limits used to evaluate all contact densities reported in this paper. The thick curve at the bottom represents the relative density on the Fei impurity with respect to -Fe. These correspond to contact densities Bohr-3 and Bohr-3, indicating a more diffuse density on the Fe impurity in Si with Bohr-3. It is interesting to note that by changing the environment of an Fe atom from metallic -Fe to a tetrahedral interstitial site in Si, most changes in the contact density come from the high-energy states, namely and valence.
It is noted that experimental IS values include a second order Doppler contribution as , which within the harmonic approximation takes the form of , where is the time-averaged kinetic energy of the resonant nucleus with oscillating mass and is the speed of light in the vacuum. At high temperatures, from the equipartition principle, for both absorber and source ( being the Boltzmann constant), and to first order they mutually cancel in Eq. 6. On the other hand, at low temperatures is approximately the zero-point energy of the resonant atom. We may estimate the impact of neglecting the Doppler contribution to relative IS shifts of Fe defects in Si by looking at the highest vibrational frequencies in the phonon density of states. For the source (-Fe), the highest allowed phonon frequency is about THz ( meV).Mauger et al. (2014) Although zero-point motion energies for Fe defects in Si are not available, we make use of the highest phonon frequency in -FeSi2, i.e., THz ( meV),ichi Tani et al. (2010) which is the most stable phase for iron disilicide. Accordingly, for a vibrating 57Fe nucleus in both materials, the difference between Doppler contributions is only about 0.03 mm/s.
For a state with nuclear spin the nuclear charge density is aspherical and the expansion of includes a quadrupolar term , usually denoted , which interacts electrostatically with the local EFG.Greenwood and Gibb (1971) The EFG is a traceless tensor, , so, by adopting the convention whereby , the asymmetry parameter
| (8) |
and are sufficient to describe in the principal axis system. As for the excited state in the keV transition in , the quadrupolar interaction results in a doublet with separation given by the quadrupole splittingGreenwood and Gibb (1971)
| (9) |
where is often termed the effective electric field gradient, . The sign of the experimental quadrupole splitting cannot always be determined, although it is possible to do so in some cases, e.g. by further splitting the doublet via a magnetic interaction or by considering the relative intensities of the lines as a function of the orientation of the crystalline sample.Reuther and Behr (2002) Equation 9 allows us to estimate quadrupole splittings from calculated values, provided that we know the nuclear quadrupole moment for the 57Fe nucleus. Although this has been previously calculated as b (Barn units) from first-principles,Dufek et al. (1995); Wdowik and Ruebenbauer (2007) we reproduce the calibration procedure in Section II.5 below.
II.4 Formation energy of Fe defects in SiC
Formation energies of defects were all calculated within the PAW method according to the usual approach,Northrup and Zhang (1993)
| (10) |
where charge neutrality is assumed, and is the total energy of a supercell with atoms of species whose chemical potential . Here is the Gibbs free energy of an ensemble of atoms in some standard phase containing elements. Calculating is quite straightforward for a defect in a homopolar semiconductor. For instance, in the case of an iron impurity in Si, is readily calculated from the energy per atom in a pristine Si unit cell, while can be estimated from the energy per Fe atom in -FeSi2 as where is the energy per primitive cell of the disilicide comprising 8 FeSi2 formula units. The result will effectively give us the formation energy of the Fe impurity in thermodynamic equilibrium with a source/sink of Fe in the form of -FeSi2.
For a compound semiconductor like SiC the above formalism becomes more elaborate as and can vary within certain limits. For instance, assuming that the standard phases of Si and C are crystalline silicon and diamond with respective chemical potentials and , we have and , otherwise the SiC crystal would not be stable and would separate into its elemental phases. On the other hand we have
| (11) |
where is the energy per formula unit in the SiC crystal and is the heat of formation of SiC. Hence, we can arrive at
| (12) | |||||
| (13) |
with and , where the lower and upper limits of account for a SiC crystal grown under Si-rich conditions () or C-rich conditions (). Finally, to obtain we simply use Eq. 11 along with values for , and calculated from bulk cells with their respective equilibrium lattice parameters. This gives eV, which compares fairly well with the experimental value of eV.Haynes (2014)
II.5 Electrical Levels
Electrical levels were calculated using the marker method.Resende et al. (1999) This approach is based on a comparison between electron affinities () or ionization energies () of a particular defect under scrutiny, with analogous ’s and ’s calculated for a reference system (referred to as marker). Accordingly, a donor level with respect to the valence band top is then obtained as
| (14) | |||||
where the values are calculated from total energies for specific charge states, , for the examined defect () and marker (), and finally the term between curly brackets is an experimental quantity and refers to the donor level of the marker with respect to . Analogously, for acceptor levels we have,
| (15) | |||||
where electron affinities are calculated as
Provided that there is a similarity in the shape and localization between donor (or acceptor) states of the examined defect and marker, this method is claimed to mitigate well known difficulties in the calculation of defect levels through error cancelation. The errors essentially derive from the non-exact treatment of the electronic exchange-correlation, and from finite-size effects due to insufficiently large supercell, like electronic dispersion, elastic strain or long-ranged electrostatic interactions across a lattice of charged defects.Shaw et al. (2007) In the calculation of the levels of Fe related defects in Si, we adopted the interstitial Ti impurity as a marker defect. Like most defects scrutinized below, Ti is an interstitial metallic impurity, and has levels measured at eV, eV and eV.Mathiot and Hocine (1989) A handicap of the marker method is precisely its dependence on a particular measurement. Since the assignment of the Ti levels was recently questioned,Kolkovsky et al. (2012); Scheffler et al. (2015) we double checked the results using interstitial and substitutional copper marker levels, namely , and at eV, eV and eV, respectively.Brotherton et al. (1985); Istratov et al. (1997); Yarykin and Weber (2011)Mössbauer calibration constants
The IS calibration constant () and the nuclear quadrupole moment () for the 14.4 keV transition of 57Fe were obtained by fitting experimental values of the IS () and the QS ( ) to calculated values of and , through the respective linear relationships expressed in Eqs. 6 and 9. To this end, we chose a collection of Fe-related compounds that cover a wide range of and values. Since we are interested in the calculation of Mössbauer parameters of Fe defects in Si, several iron silicides were included in that collection. We found that considering crystalline structures with their respective relaxed (theoretical) lattice constants, resulted in considerable scattering in the linear plots. This is perhaps due to the rather distinct bonding character among the materials considered, which leads to non-systematic errors from the exchange-correlation treatment. Hence, in line with Refs. Dufek et al., 1995 and Wdowik and Ruebenbauer, 2007, crystalline structures with experimental lattice constants were used for the calculation of and .
| Crystal | Space Group | Unit cell | Site | () | (mm/s) | () | (mm/s) | ||
|---|---|---|---|---|---|---|---|---|---|
| -Fe | Acet et al. (1994); Mori et al. (2009) | ||||||||
| TiFe | Thompson et al. (1989) | Mielczarek and Winfree (1975) | |||||||
| Fe3Si | Niculescu et al. (1976) | Hamaya et al. (2011) | |||||||
| Hamaya et al. (2011) | |||||||||
| -FeSi2 | Miiller et al. (2015) | Reuther et al. (2001) | Reuther et al. (2001) | ||||||
| Miiller et al. (2015) | |||||||||
| -FeSi2 | Dusausoy et al. (1971) | Fanciulli et al. (1995) | Fanciulli et al. (1995) | ||||||
| Dusausoy et al. (1971) | Fanciulli et al. (1995) | Fanciulli et al. (1995) | |||||||
| Dusausoy et al. (1971) | |||||||||
| -FeSi | Pauling and Soldate (1948) | Fanciulli et al. (1996) | Fanciulli et al. (1996) | ||||||
| FeF2 | Balkanski et al. (1966) | Wertheim and Buchanan (1967) | Wertheim and Buchanan (1967) | ||||||
| Balkanski et al. (1966) | |||||||||
| FeF3 | Leblanc et al. (1985) | Wertheim et al. (1968) | Wertheim et al. (1968) | ||||||
| Leblanc et al. (1985) | |||||||||
| FeBr2 | Wilkinson et al. (1959) | Pfletschinger (1968) | Pfletschinger (1968) | ||||||
| Wilkinson et al. (1959) |
Table 2 lists all Fe-compounds employed in the calibration procedure. -Fe is the ferromagnetic ground state of iron with body-centered cubic structure ( space group). In line with most Mössbauer experiments, this is considered the reference substance in the calculation of IS values. The APW+lo calculation employed a MP- grid of special -points to sample the BZ. The calculated magnetic moment per primitive cell (per Fe atom) was , where is the Bohr magneton. This compares well with the experimental value .Kittel (2005)
TiFe is a metallic compound that crystalizes in the CsCl prototypical cubic structure ( space group). Although it has two transition metals per primitive cell, it is a diamagnetic compound. The BZ of this crystal was sampled with a MP-183 grid of -points and the resulting relative contact density was Bohr3. This is consistent with some electron transfer from Ti to Fe as already reported in Ref. Papaconstantopoulos, 1975.
The inter-metallic Fe3Si solid crystallizes in the structure ( space group) and is a ferromagnetic Heusler compound that has attracted much interest.Ionescu et al. (2005) This structure can be viewed as two inter-penetrating zincblende lattices offsetted along the cube edge by (where the lattice constant).Niculescu et al. (1976) While one of the sub-lattices comprises two inequivalent Fe atoms ( and ), the second sub-lattice is made of a and Si atom pair. Importantly, and are equivalent by symmetry and sits on a site that is similar to that in -Fe — it has 8 equivalent first neighbors at the corners of a cube. The BZ was sampled using a MP-163 grid of -points. Calculated magnetic moments are and . The latter is close to that in -Fe and both compare well the experimental values of 1.35 and 2.2-2.4 , respectively.Niculescu et al. (1983)
-FeSi2 is a high-temperature stable () iron disilicide with tetragonal crystal structure. It is a metallic and diamagnetic compound that is metastable with respect to the structure observed at low-temperatures, namely -FeSi2. The energy difference between fully relaxed and phases was calculated at 0.18 eV/f.u., comparing well with 0.19 eV/f.u. from previous calculations.Moroni et al. (1999) The -FeSi2 phase attracted much attention due to its semiconducting nature with a band gap of eV and envisaged applications in optoelectronics and photovoltaics.Leong et al. (1997) Despite many experimental and theoretical efforts, there is still no agreement about the characteristics and the nature of the band gap in this material.Filonov et al. (1996); Moroni et al. (1999) -FeSi2 is a base-centered orthorhombic crystal (space group ) with 8 Fe atoms (occupying two inequivalent sites, namely FeI and FeII) and 16 Si atoms per primitive cell.Dusausoy et al. (1971) Each Fe species is surrounded by a Jahn-Teller distorted cube of Si atoms, and the material is non-magnetic. Among the silicides, the -FeSi2 is the only one where a non-axially symmetric EFG tensor is obtained (), namely, and , for FeI and FeII, respectively. Due to several effects, the parameters could not be measured reliably. However, they are in qualitative agreement with previous linear-muffin-tin orbital (LMTO) calculations ( and ).Fanciulli et al. (1997) Finally, within the Fe-Si phase diagram, we also considered a monosilicide, namely -FeSi, which is also a non-magnetic semi-metallic material. It crystallizes with a cubic lattice, and contains 4 Fe (Si) atoms per primitive cell at trigonal sites (space group ).Watanabe et al. (1963); Pauling and Soldate (1948); Fanciulli et al. (1996) For the silicides, BZ sampling grids were MP-, MP-63 and MP-123 for the , and phases, respectively.
Three iron halides, respectively FeF2, FeBr2 and FeF3, were also considered in the collection of calibration compounds. They are all anti-ferromagnetic insulators and show a wide spectrum of isomer shifts and quadrupole splittings (in decreasing order as they are referred). FeF2 crystallizes in the rutile structure ( space group), the conventional cell has two formula units where the Fe2+ magnetic moments align anti-parallel along the -axis. Our calculations indicate that within the muffin-tin sphere of Fe, the magnetic moments are , matching previous PAW calculations,López-Moreno et al. (2012) and not far from the experimental figure .Strempfer et al. (2004) FeBr2 crystallizes with the CdI2 structure ( space group), comprising hexagonal layers of Fe atoms sandwiched between bromine atom layers.Wilkinson et al. (1959) The magnetic structure of FeBr2 comprises alternate anti-parallel magnetized layers of Fe atoms, with a large measured magnetization per Fe2+ ion.Wilkinson et al. (1959) Our calculations account only for , perhaps resulting from insufficiencies in the semi-local treatment of exchange-correlation interactions in accounting for the van der Waals type bonding between the anti-ferromagnetic FeBr2 layers. Finally, FeF3 is a rhombohedral crystal ( space group) and a canted anti-ferromagnet where Fe3+ ions are located at the center of octahedra of six fluorine atoms which are slightly tilted with respect to the crystallographic axes.Wollan et al. (1958); Leblanc et al. (1985) Among the iron halides, only FeF2 has a non-axial EFG with a calculated asymmetry parameter , in reasonable agreement with the experimental estimate .Wertheim and Buchanan (1967) For the iron halides, BZ sampling grids were MP-, MP- and MP-123 for FeF2, FeBr2 and FeF3, respectively.
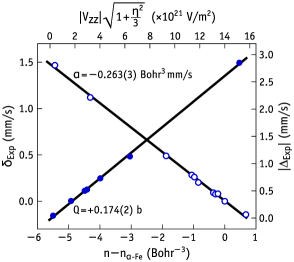
In Figure 3 we show two plots based on the data from Table 2, representing experimental isomer shifts versus calculated relative contact densities (open symbols) and experimental quadrupole splittings versus calculated effective EFG’s (closed symbols) for the materials described above. Least squares linear fits to the data resulted in an IS calibration constant Bohr3 mm/s and in a nuclear quadrupole moment b. The positive sign of the nuclear quadrupole moment is deduced from the sign of for the silicides and FeF2. The calculated values for and are in good agreement with previous full-potential APW calculations, namely those by Wdowik and RuebenbauerWdowik and Ruebenbauer (2007) where Bohr3mm/s and b and those by Dufek et al.Dufek et al. (1995) where b was obtained.
III Iron defects in silicon
III.1 Solubility and lattice location of dissolved iron in silicon
In iron-plated samples annealed at high temperatures, the solubility of in-diffused Fe in the Si bulk depends on the formation of an equilibrium silicide/Si interface underneath the surface.Weber (1983) Below the Si-Fe eutectic ( K), the maximum concentration of all iron dissolved in the bulk, , and that in the silicide phase, , are related as follows
| (16) |
where and are the excess relative partial entropy and enthalpy of formation, respectively, resulting from the transferral of an Fe atom from the silicide to bulk Si. Assuming that is temperature independent, for elemental impurities like tetrahedral interstitial and substitutional iron, Eq. 16 becomes an Arrhenius relation,
| (17) |
where is the number of possible defect sites and orientations per unit volume in the crystal (for tetrahedral interstitial and substitutional impurities in Si we have cm-3). Using measured values of entropy () and enthalpy of formation for dissolved Fe in Si,Weber (1983) one obtains a solubility cm-3 at C. While the change in entropy is a quantity that is difficult to estimate, we can easily calculate the formation enthalpy of Fei and Fes defects by using appropriate chemical potentials for Fe and Si species. Assuming that the source of Fe is the most stable phase of iron disilicide, namely -FeSi2 (see Sec. II.4), we have eV and eV. These calculations were carried out using 216-Si atom supercells with respective defects and a -FeSi2 primitive cell (using MP-23 and MP-63 special -point sets, respectively). We note that the close agreement between and the experimental figure from EPR data ( eV) suggests that the iron source in high-temperature in-diffused samples is actually a -FeSi2 layer. In fact, considering from -FeSi2 or Fe3Si phases, the agreement between calculated and experimental formation enthalpies worsens considerably, with eV and 1.80 eV, respectively.
Assuming that formation entropy values of Fei and Fes (with respect to Fe in -FeSi2) are dominated by configurational contributions,Estreicher et al. (2008) they should be comparable. Hence, from , and for C-1200∘C we obtain a concentration of Fes which is about 1%-2% of the total dissolved Fe. In Ref. Weber and Riotte, 1980 the authors reported that within the above temperature interval, the concentration of Fei (detected by EPR) was slightly but invariably lower than the total Fe in the samples (from NAA). Since some of the iron could have precipitated during the quenching stage, it was suggested that this imbalance represented an upper limit for .
It is also interesting to note that Gilles and his co-workersGilles et al. (1990) reported the enhancement of the Fe solubility in n+-type Si by up to four orders of magnitude in the temperature range 700∘C-850∘C. This was attributed to the formation of immobile substitutional Fe and possibly to pairing with phosphorous. Also from emission channeling in n-type Si, the concentration of substitutional Fe along with that of a defect referred to as near bond-centered iron, was found to be larger than that of Fei, while the opposite was observed in p+-doped samples, i.e. Fei was the most abundant impurity.Silva et al. (2013) The small difference between the formation enthalpies of Fei and Fes, combined with previous predictions that Fes is a deep acceptor,Estreicher et al. (2008) could explain the measurements referred above. Nevertheless, there is a clear need for further experimental and theoretical efforts in order to identify Fes and its electronic levels .
III.2 Interstitial iron in silicon
From PAW calculations, we arrived at the following ground states for Fe interstitial in silicon, , and , where the total spin/charge is left/right-superscripted to the Fe symbol and the symmetry of the defect is specified within parentheses. In the neutral charge state the nearest neighboring Fe-Si distance is 2.404 Å (only 0.036 Å longer than the bulk Si-Si bond length). The same Fe-Si distance increases by less than 0.01 Å for each electron that is ionized from the center. The orthorhombic distortion obtained for is rather small and relates to a displacement of the Fe atom along the direction by 0.06 Å, which corresponds to a decrease in the energy of only 50 meV with respect to the structure. The spin-1 and spin-3/2 states obtained for and correspond to those observed by EPR,Woodbury and Ludwig (1960); Ludwig and Woodbury (1960a); Sieverts et al. (1983) and agree with previous calculations.Weihrich and Overhof (1996); Sanati et al. (2007) Regarding , we will discuss its potential occurrence in a spin-2 state in p+-type material. In this charge state the spin-1 and spin-0 configurations are unstable — from spin-constrained calculations we found them to be 90 meV and 0.54 eV higher in energy than .
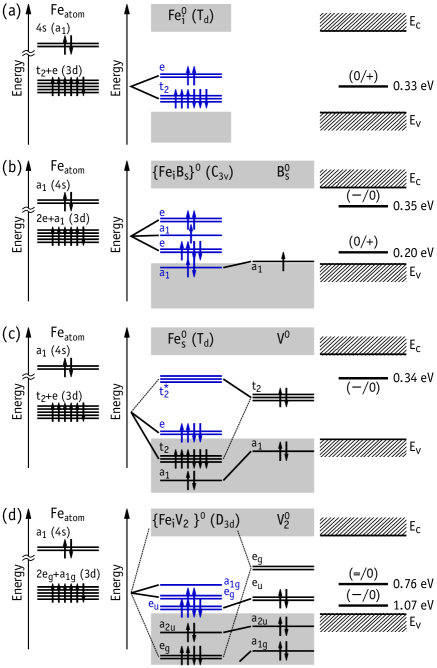
From inspection of the Kohn-Sham band structure we confirm the established model for the electronics of in Si. The result is depicted in Figure 4(a) and closely follows the model early proposed by Ludwig and Woodbury.Ludwig and Woodbury (1960b) Before we proceed with the discussion, we note that the departure from symmetry in Fe is in the present context considered small enough to justify a tetrahedral representation of its electronic states. Basically all 3d levels of atomic Fe (in the figure labeled within the point group symmetry as ) are found inside the band gap of Si which, due to the tetrahedral crystal field, are split into (low energy) and (high energy) states, respectively. Importantly, the neutral Fe impurity adopts a non-oxidized 3d84s0 configuration (unlike atomic iron which is 3d64s2). Also in line with the EPR data we found that the ionization of the defect involves a change in the occupation of the triplet (not in the higher energy doublet). Due to exchange interactions, electrons occupying the state are tightly bound. This results in the formation of a manifold with net spin . In fact, the most stable 1/2Fe+ state was not , but which was 0.31 eV above the spin-3/2 ground state. The weak distortion obtained for Fe suggests a possible Jahn-Teller instability driven by the incomplete filling of the triplet state. Experimental evidence for this effect may be inferred from a dynamic broadening of the EPR signal of Fe relative to that of Fe.Weihrich and Overhof (1996) However, we note that the calculation of Jahn-Teller symmetry breaking using methods based on the Born-Oppenheimer approximation (as presented here), should be considered with care – any quantitative treatment of this effect must account for the electron-phonon coupling. By comparing first ionization energies of Fe and Ti impurities in 216-atom supercells we arrive at a transition at eV [obtained from eV]. This compares fairly well with the experimental figure of eV (see for instance Refs. Feichtinger et al., 1978 and Wünstel and Wagner, 1982). Similarly, by comparison with eV, the level of is very close to the Ti-marked result and it is calculated at eV. Since the marker is referred with respect to the conduction band minimum, a band gap width of 1.17 eV was considered in order to calculate with respect to .
Further ionization of the defect also involved electron depletion of the triplet state. By comparing and energies we were lead to a second donor level for Fe at eV. It is noted that there is no experimental evidence for such a level. This result may suffer from an overestimation of the stability of the high-spin ground state by the use of a semi-local treatment of the exchange-correlation potential. As a matter of fact, if we consider the energy of the state, the Fe level becomes resonant with the valence band.
| 0.72, 0.67 | |||
| 0.71, 0.68, 0.64 | , 0.57, 0.96 | ||
| , , | |||
| 0.35, 0.39 | 0.40, 1.10 |
In Table 3 we find the calculated isomer shifts and quadrupole splittings for the defects under investigation in their relevant charge states. From the APW+lo calculations for we obtained a relative contact density Bohr-3, and using Eq. 6 we arrive at an isomer shift mm/s. Ionization of the Fei impurity results in a small increase in the (absolute) contact density that corresponds to an isomer shift of 0.67 mm/s for . These results agree reasonably well with the experimental data obtained by the ISOLDE consortium, i.e. 0.77 mm/s and 0.72 mm/s observed in n-type and p-type Si and assigned to and , respectively.Gunnlaugsson et al. (2002b) Extensive measurements in n- and p-type samples, where 57Fe was introduced by several methods, were also carried out by Yoshida and his group.Yoshida et al. (2006, 2007, 2016) Although their data for p-type Si seems to be in line with other reported data ( mm/s), for n-type material a resonance at mm/s has been assigned to . Since our calculations conflict with this assignment, we investigated several possible sources of error, including (i) increasing the BZ sampling grid to MP-, (ii) bringing the 3s state of Fe into the valence to be treated within the Kohn-Sham scheme, (iii) including an on-site correction to the exchange-correlation energy by means of the GGA approach as proposed by Liechtenstein et al.Liechtenstein et al. (1995) (with Hubbard and Hund parameters in the range eV and eV), and (iv) using the local density approximation to the electronic exchange-correlation interactions. All these tests resulted in a small and negative charge-induced shift mm/s, where , which is effectively identical to that obtained from values reported in Table 3.
The small calculated change in the isomer shift upon ionization of Fei in Si is also in agreement with previous theoretical reports. Early work by Katayama-Yoshida and ZungerKatayama-Yoshida and Zunger (1985) by means of a self-consistent spin-polarized Green’s-function method reported mm/s, and more recently Kübler and co-workersKübler et al. (1993) obtained mm/s. Figure 5 depicts the difference between the electron density around the 57Fe nucleus in Fe and Fe defects, represented as . It also includes partial contributions from S-states (where the relativistic notation is used) and valence. Two main effects dictate the almost identical contact densities in Fe and Fe, namely (i) the fact that the 4s state is not involved in the ionization process – only 3d states (which are nodal at the nucleus) change occupancy, and (ii) a considerable screening of the Fe impurity by the host crystal, meaning that removal of one electron from the triplet state results in a charge flow (electronic relaxation) from ligand atoms towards the Fe site. This is demonstrated by the large positive contribution from the valence to . Contributions from and states have similar magnitudes and mutually cancel.
III.3 Iron-boron pair in Si
Our calculations indicate that the pairing of Fe with substitutional B results in trigonal () complexes with , and ground states. Low-spin and configurations were 0.06 eV and 0.47 eV above the ground state. From the point of view of its formation, it is instructive to look at the neutral state as a Coulomb stabilized complex made of next to B. Alternatively, we may think of it as a result of electron transfer from the high-energy d-state of Fei to the low-energy acceptor state of boron, meaning that the electronic structure of resembles that of Fe (perturbed by a B anion).Zhao et al. (2001); Macdonald et al. (2005) According to Zhao et al.Zhao et al. (2001) the effect of a negatively charged B next to Fei is to raise the energy of the Fei levels due to Coulomb repulsion. The magnitude of this interaction has been estimated from the measured FeiBs and Fei levelsFeichtinger et al. (1978); Lemke (1981) as 0.53 eV, where the band gap of Si at K is considered to be eV. From here, and hypothesizing that the level also originates from a Coulomb-raised transition resonant with the Si valence band, we readily arrive at an estimate for its location as eV, where again we made use of the measured donor level of FeiBs at eV.Brotherton et al. (1985) Obviously this analysis is based on the premise that the strength of the interaction between B and the two levels of Fei is the same, which although reasonable, is yet to be demonstrated.
The calculated electronic structure of neutral FeiBs is depicted in Figure 4(b). Analogously to Fei, we found that the ionization/electron trapping of/by FeiBs essentially involves a change in the occupation of a manifold (once a triplet localized on Fei) below a spin-1 doublet. The calculated electronic levels of FeiBs marked with Ti are located at FeiB eV and FeiB eV, in fair agreement with the corresponding experimental levels measured at eV and eV, respectively.Ghatnekar-Nilsson et al. (1993) Analogous calculations using and markers gave FeiB eV and FeiB eV. The latter figure is edging the usual error bar of the marker method, perhaps because a substitutional marker is not the best choice to compare with an interstitial defect. The fact that we place the FeiB level about 0.1 eV above the measurements suggests that the calculated Fe transition reported above at eV is spurious.
Likewise, for the electronic structure, the calculated isomer shifts for are very similar to those for Fe. The results are shown in Table 3, where calculated values of 0.71 mm/s and 0.68 mm/s for and are very close to 0.72 mm/s and 0.67 mm/s measured for Fe and Fe, respectively. The fact that we are now dealing with a trigonal center implies the existence of a non-zero EFG at the Fe nucleus and a quadrupole splitting in the Mössbauer signal. The calculations (also reported in Table 3) indicate splittings of mm/s, 0.57 mm/s and 0.96 mm/s for and and . These results indicate that the nuclei of Fe ions in neutral and positively charged complexes experience much larger EFGs than neutral Fe in negatively charged , where there is no Coulomb attraction between the impurity pair. These results differ considerably from Mössbauer data acquired at K where a signal with a centroid velocity mm/s and line splitting mm/s was connected to the FeiBs pair (presumably in the neutral charge state).Gunnlaugsson et al. (2006b) They are also at variance with a recent proposal that the FeiBs pair gives rise to a single resonant line (presumably without or with unresolvable quadrupole splitting) at mm/s.Yoshida et al. (2016) On the other hand, they are in much better agreement with earlier work by Bergholz on 57Co-contaminated p-type Si, where at least three doublets were observed with intensities that depended on the temperature of the measurements, and were all assigned to 57CoiBs pairs. All these doublets had values of about 0.7 mm/s, and were split by either 0.21, 0.54 and 1.04 mm/s, the one with larger being assigned to the -oriented structure studied here.Bergholz (1983) Such mixed agreement calls for further theoretical analysis and experiments.
III.4 Substitutional iron in silicon
Substitutional Fe was studied in the neutral and negative charge states. We obtained ground state configurations and . The tetrahedral structure had 2.255 Å Fe-Si bonds, while the Fe atom in the structure was displaced from the perfect lattice by 0.11 Å along , resulting in Fe-Si bonds either 2.249 Å or 2.239 Å long. These are somewhat shorter than Si-Si bonds in bulk Si (2.368 Å) and also shorter than Fe-Si bonds in -FeSi2 (2.33-2.42 Å). The perfect tetrahedral defect is unstable – a symmetry-constrained relaxation of the structure gave a total energy 0.11 eV above . Considering the formation enthalpy difference of Fei to Fes ( eV), combined with a calculated formation enthalpy of 3.60 eV for a neutral Si vacancy (V), we estimate a binding energy between Fes and V of about 3 eV. This means that if the concentration of vacancies is above the equilibrium level, (ex. after electron irradiation), and if the temperature is such that the vacancies are mobile, a considerable fraction of Fei will readily become substitutional, unless there is a high enough barrier or a more efficient trapping center for vacancies preventing the reaction from occurring. We will come back to this issue below.
The electronic structure of in Si is represented in Figure 4(c), and it is well described by the Watkins vacancy model.Watkins (1992) Accordingly, it results from the resonance between levels from the iron manifold and the levels from the Si vacancy. The result is the formation of a fully occupied bonding state (in the valence) along with an empty anti-bonding counterpart deep in the gap. The fully occupied -component from the manifold of Fe is edging the valence band top. We note that (i) like the gap state in Fei, the state of Fes is nodal on the Fe atom, but (ii) unlike in Fei, is reminiscent of the vacancy states and it is strongly localized on Si atoms.
Early calculations based on the Green’s function method anticipated an inert Fes center with no levels in the gap,Zunger and Lindefelt (1982); Beeler et al. (1985) i.e., the and states were predicted to lie below and above , respectively. More recent density functional calculations placed the state well within the gap, and calculated an acceptor level either at eV or eV, depending on the calculation specifics, such as the type of pseudopotentials and basis functions employed.Estreicher et al. (2008) These results challenge both theorists and experimentalists, suggesting that further studies should be carried out in order to identify the Fes defect in Si. By comparing the electron affinity of Fes and Tii defects we arrive at an acceptor level for Fes at eV, in line with Estreicher and co-workersEstreicher et al. (2008) who using a methodology much similar to ours obtained Fe at eV. Experimentally, there is not much data in the literature regarding the electrical levels of substitutional Fe. Perhaps the work by Kaminski et al.Kaminski et al. (2003) provide us what it could be a signature for this defect. Accordingly, a trap at eV was assigned to an acceptor transition of Fes, although this link was solely based on annealing and concentration arguments.Tanaka and Kitagawa (1995); Kaminski et al. (2003) Our calculated Fe transition is about 0.2 eV off the aforementioned trap, which is about the expected error of the marker method if the electronic structure of the marker is far from that of the defect under scrutiny. Here we are comparing an acceptor transition of a defect which very much resembles the vacancy electronic structure (Fes) with an another acceptor transition involving electron capture at the 3d level of interstitial Ti. However, comparing electron affinities of and with those of and we obtain levels at eV (close to Kaminski’s trap at eV)Kaminski et al. (2003) and eV respectively, indicating that only has one acceptor level within the gap. While these results are consistent with those obtained using the marker, due to similarities between and centers we anticipate that the -marked level is likely to be our best estimate.
The calculated isomer shifts of neutral and negatively charged Fes are mm/s and mm/s, respectively. Their magnitude is slightly overestimated with respect to the measurements, but unlike previous calculations,Kübler et al. (1993) we obtain the right sign, meaning that the contact density on Fes is slightly higher than in -Fe, most probably due to the additional electrons from the vacancy state (see Fig. 4(c)). Notably, like in Fei, the charge state dependence of the isomer shift is rather small – the capture of an electron by Fe changes by only 0.02 mm/s, again due to the fact that the 4s state of iron in Fes is empty (the oxidation state is 0) and the acceptor state is nodal on Fe.
III.4.1 Iron-vacancy pair
We investigated the FeiV pair by first looking at its ground state electronic structure, and then by inspecting its stability against transformation to substitutional Fe, i.e. by following the reaction . The lowest energy structure of FeiV, made of separate Fei and V defects, was that of a Fei with a missing Si nearest neighbor along . Ground states were all low-spin , and , while higher-spin states , and where metastable by 0.17 eV, 0.21 eV and 0.45 eV, respectively. Placing the vacancy at the second nearest neighboring site along to the Fe atom resulted in structures with spin 1/2, 0 and 1/2 and relative energy 1.18 eV, 1.33 eV and 1.47 eV above their respective FeiV ground states (and respective charge states). These figures are still low when compared with the eV binding energy of Fes from infinitely separated V and Fei defects (see above).
In order to follow the energetics of the reaction we employed the nudged elastic band methodHenkelman et al. (2000); Henkelman and Jónsson (2000) on a two-step process, namely (1) and (2) . A total of 9 intermediate structures (images) were considered between the reactant/product structures from each step. We assume that in the presence of vacancies, the eventual formation of is limited by an activation energy that corresponds to the migration barrier of the vacancy. This barrier depends on the charge state of the traveling V defect and was accurately measured by Watkins as 0.33 eV, 0.45 eV and 0.18 eV for V, V0 and V=,Watkins (1992) respectively. Such low values imply that should form before Fei becomes mobile, even below room temperature. For reaction (1) we obtained barriers of 0.2 eV, 0.18 eV and 0.18 eV for positively charged, neutral and negatively charged supercells (spin 1/2, 0 and 1/2), respectively. For step (2) we obtain barriers of 0.17 eV, 0.18 eV and 0.15 eV, again for charge states , and , respectively (spin 1/2, 0 and 1/2). These results are in apparent disagreement with those from Ref. Estreicher et al., 2008 where a barrier above 0.45 eV was reported. However we note we are comparing two different mechanisms. In Ref. Estreicher et al., 2008 a series of molecular dynamics runs were performed in which the Si atoms in the supercell were allowed to relax but the Fe atom was forced to move at constant speed along a trigonal axis, starting at the second neighboring tetrahedral interstitial site (from V) over the hexagonal site to the nearest neighboring T site, and finally into the vacancy site. In our opinion, this approach unjustifiably assumes that the moving defect is Fe (while V is assumed to be static).
Our predicted barriers are not compatible with a FeiV complex stable up to 500 as reported in Ref. Mchedlidze and Suezawa, 2002 and references therein, neither support the early assignment of the EPR NL19 signal to FeiV, which was then shown to be stable at least up to 160.Muller et al. (1982) Although the candidate is only 0.17 eV less stable than , we did not find a stable alternative spin-3/2 FeiV defect that could be connected to NL19. Based on the above results, our view is that FeiV will not survive at room temperature and above, and that NL19 could be related to a more stable vacancy-Fei complex (also involving a single Fe atom), with 3/2FeiV being a likely candidate (see below).
III.5 Iron-divacancy pair in Si
Here we focus mostly on the stable iron-divacancy (FeiV2) structure which, as reported in Ref. Estreicher et al., 2008, consists on a Fe atom right at the center of a divacancy (at the bond-center site of the otherwise perfect Si lattice). Accordingly, we obtain 1/2FeiV, 1FeiV, 3/2FeiV and 1FeiV, all trigonal structures with symmetry. Alternative spin configurations 3/2FeiV, 2FeiV, 1/2FeiV and 0FeiV where found less stable by 0.02 eV, 0.03 eV, 0.12 eV and 0.37 eV, respectively.
As depicted in Figure 4(d), the electronic structure of FeiV2 results from the overlap of the 3d states of the Fe atom ( in a representation) with the and state of the Si divacancy. The states from both defects mix strongly, resulting in bonding and anti-bonding levels in the valence and conduction bands, respectively. The formation energy of a neutral FeiV2 is 5.47 eV, which along with the calculated formation energies for Fes and V gives a binding energy of 1.33 eV for the reaction . This figure is not far from the 1.56 eV previously found by the Estreicher group,Estreicher et al. (2008) and suggests that this is a strong defect that can survive well above room temperature.
Other structures for FeiV2 were investigated. The asymmetric structure with the Fe atom located at one of the vacant sites ( structure) was unstable – upon relaxation, the Fe atom moved without an impeding barrier to the bond center site between the two vacancies. Other structures like or , where a vacancy is located at the second and third neighboring site to Fes were found to be 0.98 eV and 1.26 eV above the ground state.
Also in agreement with the authors of Ref. Estreicher et al., 2008 we found that FeiV2 (with symmetry) is not a donor but rather a multiple acceptor. While they report a level at eV or eV (depending on the method specifics), we obtain a first acceptor level at eV using the Tii-marker. The use of the more suitable Cus marker gives eV and eV. Recently, Tang and co-workersTang et al. (2013) reported electrical measurements in p-type electron-irradiated Si contaminated with Fe. From a series of 30-min isochronal anneals they found that above C mobile Fei could interact with divacancies to form a hole trap at eV (labeled H29) which was connected to a metastable Fei-V2 complex. By rising the annealing temperature above C the H29 signal transformed to a more stable and deeper hole trap (H34) at eV, which was assigned to the -symmetric Fei-V2 defect. While its was not possible to establish the charge states involved in the H34 transition, our calculations strongly suggest that it relates to .
The calculated Mössbauer parameters of FeiV2 are reported in Table 3. Being a non-cubic center, it should give rise to a quadrupole splitting in the MS signal. Accordingly, for the neutral and negatively charged defects we anticipate resonance speeds of mm/s and mm/s for the centroid, and splittings mm/s and mm/s, respectively. Analogously to previous Fe-related defects, the change of values upon charge state transition is small. On the other hand, the quadrupole splitting decreases by more that 50% upon electron capture by . This effect comes from the occupation of an axial state centered on the Fe atom. We note that , which is expected to be particularly stable in high-resistivity p-type and intrinsic material, should give rise to resonances close to mm/s and mm/s. These coincide with the isomer shifts of Fei and Fes, which may mask (or even undermine) the analysis of the experimental data, particularly in the case where ion implantation has been utilized to introduce the 57Fe species.
IV Iron in other group-IV semiconductors
Mössbauer parameters were also calculated for elemental and defects in other group-IV materials, namely in Ge, Diamond, 3C-SiC (cubic phase) and in Si-rich SiGe alloys. Like in Si, the defects were found to minimize the total energy in the and states. The distance between Fe and its nearest neighbors expanded relative to the unrelaxed values, except for in Si and Ge (where it contracted) and in 3C-SiC (where it remained effectively unaltered).
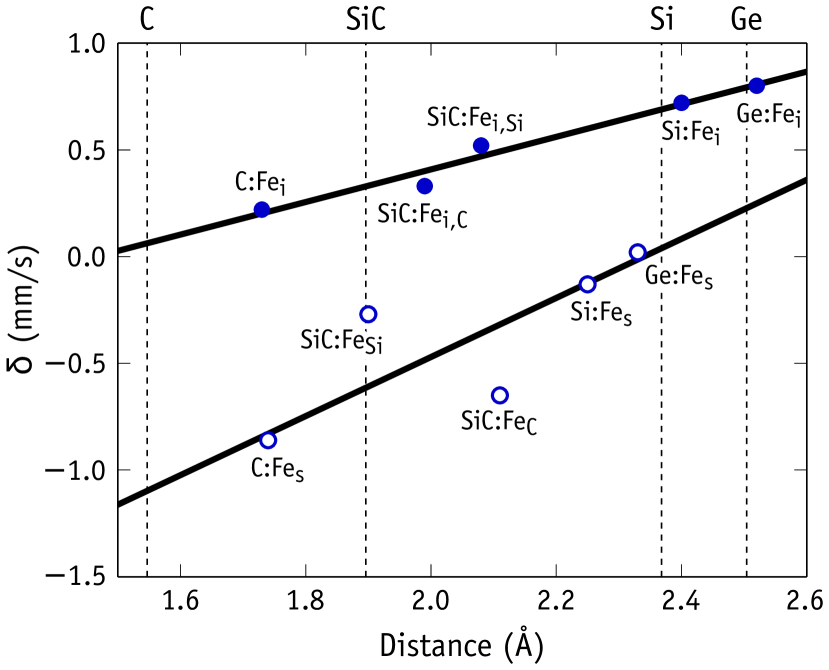
Overall, there is good agreement between the isomer shifts observed in Ge, Diamond and SiC, collected in Table 1, and those from our calculations reported in Table 4. As depicted in Figure 6 and in agreement with Ref. Gunnlaugsson et al., 2006a, we found an approximate linear trend between IS values and the distance between Fe and its first neighbors. IS values for in Ge, Diamond and in SiC match the experimental results, and for all other IS values the agreement is within 0.04 mm/s and 0.14 mm/s. It is noted that, while the IS obtained for in Diamond deviates markedly from previous calculations,Bharuth-Ram et al. (1998) the difference between the calculation methods most likely accounts for this discrepancy. Notably, the relaxed -C and -C distances in Diamond were effectively equal, yet and are 1.08 mm/s apart. However, as we move towards heavier elements, the relative differences between and decrease with increasing distance between Fe and its neighbors, to a minimum value of 0.76 mm/s calculated for Ge.
To the best of our knowledge, in SiC has not been determined experimentally. We obtain mm/s, which is about the same value previously calculated for FeC in 6H-SiC.Elzain et al. (2014) We note though, that experimental IS resonances for substitutional and interstitial Fe in both 6H-SiC and 3C-SiC follow similar trends.Bharuth-Ram et al. (2008) Following the methodology outlined in Section II.4, formation energy calculations for and in 3C-SiC cubic supercells, yielded 2.99 eV, 2.72 eV and 3.26 eV, and 4.78 eV, 5.05 eV and 4.51 eV under stoichiometric, Si-rich and C-rich crystal growth conditions respectively. As is between 1.2 eV and 2.3 eV lower than , it suggests a preferential incorporation of in the Si sites, allowing us to assign the observed peak at mm/s reported in Ref. Bharuth-Ram et al., 2008 to (compared to the calculated value of mm/s).
Formation energies were also calculated for interstitial iron in SiC, where eV and eV, indicating a preference for sites with first-neighboring C atoms. This result explains the transformation of the Fei,2 peak to the Fei,1 peak observed in Ref. Bharuth-Ram et al., 2008 upon annealing the SiC samples, allowing us to assign Fei,1 and Fei,2 peaks to and , respectively.
For Si-rich SiGe alloys, the Mössbauer parameters were studied as a function of the distance between a () defect and a neighboring substitutional Ge atom (from first to fourth neighboring distance). The presence of the Ge atom produced a deformation of the local electron density in all cases. The values of the IS and QS for and decrease monotonically with the distance between the Fe impurity and the Ge atom, and both and are very similar to values calculated in bulk Si. Interestingly, the QS for with a Ge first neighbor is 1.25 mm/s, about seven times the value obtained with a Ge fourth neighbor. However, the relative energies obtained from PAW calculations for second, third and fourth neighboring Fei-Ge pairs are eV, eV and eV, with respect to the first neighboring pair, allowing us to conclude that Fei atoms will effectively avoid Ge atoms in the alloy. Hence, the Mössbauer spectrum of Fei in Si-rich SiGe alloys is expected to be analogous to the signal in bulk Si, although broadened by quadrupole splittings of remote Fei-Ge pairs and internal strain fields. For Fes, structures with Ge atoms at first to fourth neighboring sites have essentially the same small relative energies (within 0.03 eV), suggesting that in principle there will be no preferential distribution of Fes with respect to the location of the Ge minority species. However, due to a sizable QS for Ge at first and second nearest neighboring positions, considerable differences are expected in the corresponding Mössbauer spectra with respect to the bulk Si measurements. Obviously these deviations will depend on the fraction of the Ge concentration with respect to that of Si.
| C | 0.22 | ||||
| SiC | (Fei,Si/FeC) | 0.52 | |||
| (Fei,C/FeSi) | 0.33 | ||||
| SiGe | 1 | 0.71 | 1.25 | 1.55 | |
| 2 | 0.69 | 0.19 | 0.42 | ||
| 3 | 0.69 | 0.19 | 0.10 | ||
| 4 | 0.69 | 0.17 | 0.01 | ||
| Ge | 0.80 | 0.02 |
V Conclusions
In this work we combined pseudopotential and all-electron density functional calculations of Fe-related defects in group-IV semiconductors (mostly in Si, but also in Ge, C, SiC and Si-rich SiGe alloys). Our aim was to investigate electronic and electron-nuclear coupling properties, and compare them to those measured with several spectroscopic techniques, Mössbauer Spectroscopy in particular.
After a short review of previous experimental and theoretical reports on 57Fe Mössbauer parameters for Fe-related defects in group-IV semiconductors, we described the theoretical methodologies employed by us. This includes methods to obtain defect structures, total energies and electron densities (PAW and APW+lo methods), to calculate isomer shifts and quadrupole splittings, formation energies and charge transition levels.
We provided a detailed description of the calculation of the Mössbauer calibration constants, and . These quantities allowed us to obtain the isomer shifts and quadrupole splittings from the contact densities and electric field gradients calculated from first-principles. To this end, we calculated relative contact densities and EFG values for Fe in a comprehensive set of Fe-related compounds, and established linear relations with corresponding IS and QS values obtained experimentally. The resulting values Bohr3 mm/s and b agree well with previous calculations reported in the literature.
We devoted Section III to the study of Fe defects in Si. We started by looking at the relative stability and upper concentration limit of interstitial iron relative to that of substitutional iron in Si (assuming equilibrium conditions across a Si/-FeSi2 interface). We found an enthalpy of formation for Fei of 2.73 eV, which is only 0.14 eV below the figure obtained from EPR experiments,Weber and Riotte (1980) and only 0.5 eV lower than the enthalpy of formation of Fes, suggesting that the concentration of the latter defect could be relevant, particularly in n-type Si, where it could act as a strong recombination center for minority carriers in solar material.
Looking more closely at the Fei impurity, we confirm that it gives rise to a single donor level, calculated at eV (only 0.05 eV below the well established transition measured by DLTSFeichtinger et al. (1978); Wünstel and Wagner (1982)). Inspection of further ionization and a comparison with the FeiBs defect allowed us to conclude that Fe is resonant with the valence of the host. The calculated isomer shifts of neutral and positively charged Fei in Si are calculated as 0.72 mm/s and 0.67 mm/s, respectively. We attribute the rather small charge dependence of the IS to the nodal character of the 3d level on Fe (which is the one involved in the donor transition), but also to the fact that the Fe atom is in the 0 oxidation state, leaving the 4s state (with amplitude on Fe) empty during the transition. The agreement between the calculated IS for Fe and the available Mössbauer data in p-type Si is good. On the other hand, for the neutral charge state, experiments came up with two rather different values, mm/s or 0.77 mm/s, clearly suggestion that further work is necessary in order to clarify the picture.
The iron-boron pair was also investigated. We started by looking at the electronic structure and levels of the most stable form of this defect, where the B atom replaces a Si first neighbor of the Fei defect (trigonal structure). In agreement with DLTS measurements we obtained donor and acceptor levels at eV and eV, respectively. The IS values for the pairs in charge state are found to be rather close to those of Fei in the charge state. This supports the model for the FeB pair as a Coulomb-stabilized complex composed by a Fe cation next to a B anion.
We confirm previous calculationsEstreicher et al. (2008) where Fes was predicted to be a deep acceptor. Our calculations indicate a Fe level at 0.38 eV below . The calculated value for the IS of Fes was mm/s, in line with the generally accepted value assigned to Fes ( mm/s) in Mössbauer measurements. We also confirm that there is a strong binding energy between Fei and a Si vacancy. The reaction was found to realease about 3 eV. We investigated this reaction in-depth using the nudged elastic band method. In disagreement with the prevalent view, we concluded that the reaction kinetics is effectively limited by the migration rate of the vacancy, meaning that several spectroscopic signals (including the NL19 center from EPR), which were detected above room-temperature, were incorrectly connected to an iron-vacancy pair.
Our final analysis concerned the iron-divacancy pair (FeiV2) in Si, comprising a Fe atom at the center of a divacancy. The FeiV2 defect was predicted to be a very deep double acceptor with levels at eV and eV. We concluded that this is a rather stable complex and should be dominant in the presence of vacancies, both after sample quenching from high temperatures, and in samples that were subject to irradiation with electrons and heavier particles. We anticipate that the Mössbauer signal for the neutral complex is a doublet centered at mm/s and split by mm/s. In the negative charge state the centroid increases slightly to 0.39 mm/s but the density becomes more isotropic with mm/s.
Finally, we studied the Mössbauer parameters for Fei and Fes in Ge, diamond, 3C-SiC and Si-rich SiGe alloys. We confirm the observed approximate linear dependence of the IS with the distance between Fe and its first neighbors. The agreement between theory and experiments is very good in general. Additionally, we fill in some blanks and improve upon some previous calculations. This includes the assignment of Fes and Fei defects with specific neighbors in SiC, as well as the IS for Fes in diamond.
Acknowledgements
JC thanks Prof. Yutaka Yoshida for many fruitful discussions. This work was funded by the Fundação para a Ciência e a Tecnologia (FCT) under projects PTDC/CTM-ENE/1973/2012 and UID/CTM/50025/2013, and funded by FEDER funds through the COMPETE 2020 Program. The authors would like to acknowledge the contribution of the COST Action MP1406. Computer resources were provided by the Swedish National Infrastructure for Computing (SNIC) at PDC.
References
- Istratov et al. (2006) A. Istratov, T. Buonassisi, M. Pickett, M. Heuer, and E. Weber, Materials Science and Engineering: B 134, 282 (2006).
- Buonassisi et al. (2005) T. Buonassisi, A. A. Istratov, M. Heuer, M. A. Marcus, R. Jonczyk, J. Isenberg, B. Lai, Z. Cai, S. Heald, W. Warta, R. Schindler, G. Willeke, and E. R. Weber, Journal of Applied Physics 97, 074901 (2005).
- Istratov et al. (1999) A. A. Istratov, H. Hieslmair, and E. R. Weber, Applied Physics A 69, 13 (1999).
- Istratov et al. (2000) A. A. Istratov, H. Hieslmair, and E. R. Weber, Applied Physics A 70, 489 (2000).
- Woodbury and Ludwig (1960) H. H. Woodbury and G. W. Ludwig, Phys. Rev. 117, 102 (1960).
- Sieverts et al. (1983) E. Sieverts, S. Muller, C. Ammerlaan, and E. Weber, Solid State Communications 47, 631 (1983).
- Greulich-Weber et al. (1984) S. Greulich-Weber, J. R. Niklas, E. R. Weber, and J. M. Spaeth, Physical Review B 30, 6292 (1984).
- Feichtinger et al. (1978) H. Feichtinger, J. Waltl, and A. Gschwandtner, Solid State Communications 27, 867 (1978).
- Wünstel and Wagner (1982) K. Wünstel and P. Wagner, Applied Physics A 27, 207 (1982).
- Wahl et al. (2005) U. Wahl, J. G. Correia, E. Rita, J. P. Araújo, and J. C. Soares (The ISOLDE Collaboration), Phys. Rev. B 72, 014115 (2005).
- Silva et al. (2013) D. J. Silva, U. Wahl, J. G. Correia, and J. P. Araújo, Journal of Applied Physics 114, 103503 (2013).
- Gunnlaugsson et al. (2003a) H. Gunnlaugsson, G. Weyer, N. Christensen, M. Dietrich, M. Fanciulli, K. Bharuth-Ram, R. Sielemann, A. Svane, and t. ISOLDE Collaboration, Physica B: Condensed Matter 340-342, 532 (2003a).
- Yoshida et al. (2006) Y. Yoshida, Y. Kobayashi, K. Hayakawa, K. Yukihira, A. Yoshida, H. Ueno, F. Shimura, and F. Ambe, Physica B: Condensed Matter 376-377, 69 (2006).
- Macdonald et al. (2005) D. Macdonald, T. Roth, P. N. K. Deenapanray, K. Bothe, P. Pohl, and J. Schmidt, Journal of Applied Physics 98, 083509 (2005).
- Ludwig and Woodbury (1962) G. W. Ludwig and H. H. Woodbury, in Solid State Physics, Vol. 13, edited by F. Seitz and D. Turnbull (Academic Press, New York, 1962) p. 223.
- Gehlhoff et al. (1988) W. Gehlhoff, K. Irmscher, and J. Kreissl, in New Developments in Semiconductor Physics, Lecture Notes in Physics, Vol. 301, edited by G. Ferenczi and F. Beleznay (Springer Berlin Heidelberg, 1988) pp. 262–267.
- Spaeth et al. (1998) J.-M. Spaeth, S. Martini, and S. Greulich-Weber, Semiconductor Science and Technology 13, 725 (1998).
- Zoth and Bergholz (1990) G. Zoth and W. Bergholz, Journal of Applied Physics 67, 6764 (1990).
- Gilles et al. (1990) D. Gilles, W. Schröter, and W. Bergholz, Phys. Rev. B 41, 5770 (1990).
- Langouche (1992) G. Langouche, Hyperfine Interactions 72, 215 (1992).
- Weyer et al. (1997) G. Weyer, S. Degroote, M. Fanciulli, V. N. Fedoseyev, G. Langouche, V. I. Mishin, A.-M. V. Bavel, A. Vantomme, and the ISOLDE Collaboration, Materials Science Forum 258-263, 437 (1997).
- Weyer et al. (1999) G. Weyer, A. Burchard, M. Fanciulli, V. Fedoseyev, H. Gunnlaugsson, V. Mishin, and R. Sielemann, Physica B: Condensed Matter 273–274, 363 (1999).
- Yoshida et al. (2002) Y. Yoshida, Y. Kobayashi, A. Yoshida, X. Diao, S. Ogawa, K. Hayakawa, K. Yukihira, F. Shimura, and F. Ambe, Hyperfine Interactions 141-142, 157 (2002).
- Yoshida et al. (2003) Y. Yoshida, S. Ogawa, and K. Arikawa, Physica B: Condensed Matter 340–342, 605 (2003).
- Estreicher et al. (2008) S. K. Estreicher, M. Sanati, and N. Gonzalez Szwacki, Phys. Rev. B 77, 125214 (2008).
- Yoshida et al. (2007) Y. Yoshida, Y. Suzuki, A. Matsushita, K. Suzuki, and K. Sakata, Physica B: Condensed Matter 401-402, 167 (2007).
- Weber and Riotte (1980) E. Weber and H. G. Riotte, Journal of Applied Physics 51, 1484 (1980).
- Yoshida and Langouche (2013) Y. Yoshida and G. Langouche, eds., Mössbauer Spectroscopy, Tutorial Book (Springer Berlin, Berlin Heidelberg, 2013).
- Greenwood and Gibb (1971) N. N. Greenwood and T. C. Gibb, Mössbauer spectroscopy (Chapman and Hall London, 1971).
- Gütlich (2012) P. Gütlich, Zeitschrift für anorganische und allgemeine Chemie 638, 15 (2012).
- Kobayashi et al. (2000) Y. Kobayashi, Y. Yoshida, A. Yoshida, Y. Watanabe, K. Hayakawa, K. Yukihira, F. Shimura, and F. Ambe, Hyperfine Interactions 126, 417 (2000).
- Weyer (2000) G. Weyer, Hyperfine Interactions 129, 371 (2000).
- Gunnlaugsson et al. (2002a) H. P. Gunnlaugsson, M. Fanciulli, M. Dietrich, K. Bharuth-Ram, R. Sielemann, G. Weyer, I. collaboration, and others, Nuclear Instruments and Methods in Physics Research Section B: Beam Interactions with Materials and Atoms 186, 55 (2002a).
- Gunnlaugsson et al. (2003b) H. P. Gunnlaugsson, G. Weyer, M. Dietrich, M. Fanciulli, K. Bharuth-Ram, R. Sielemann, t. ISOLDE Collaboration, and others, Physica B: Condensed Matter 340, 537 (2003b).
- Weyer et al. (2004) G. Weyer, H. P. Gunnlaugsson, M. Dietrich, H. Fynbo, K. Bharuth-Ram, and the ISOLDE Collaboration, The European Physical Journal Applied Physics 27, 317 (2004).
- Bharuth-Ram et al. (2008) K. Bharuth-Ram, H. P. Gunnlaugsson, R. Mantovan, V. V. Naicker, D. Naidoo, R. Sielemann, G. Weyer, T. Aigne, and ISOLDE Collaboration, Hyperfine Interactions 184, 207 (2008).
- Gunnlaugsson et al. (2006a) H. P. Gunnlaugsson, K. Bharuth-Ram, M. Dietrich, M. Fanciulli, H. O. U. Fynbo, and G. Weyer, Hyperfine Interactions 169, 1319 (2006a).
- Bharuth-Ram et al. (1998) K. Bharuth-Ram, M. Hartick, E. Kankeleit, C. Dorn, P. Held, R. Sielemann, L. Wende, J. Kübler, and J. P. F. Sellschop, Physical Review B 58, 8955 (1998).
- Elzain et al. (2014) M. Elzain, S. H. Al-Harthi, A. Gismelseed, A. Al-Rawas, A. Yousif, H. Widatallah, and M. Al-Barwani, Hyperfine Interactions 226, 281 (2014).
- Abreu et al. (2014) Y. Abreu, C. Cruz, I. Piñera, A. Leyva, A. Cabal, P. Van Espen, and N. Van Remortel, Physica B: Condensed Matter 445, 1 (2014).
- Kübler et al. (1993) J. Kübler, A. E. Kumm, H. Overhof, P. Schwalbach, M. Hartick, E. Kankeleit, B. Keck, L. Wende, and R. Sielemann, Zeitschrift für Physik B Condensed Matter 92, 155 (1993).
- Gunnlaugsson et al. (2002b) H. P. Gunnlaugsson, G. Weyer, M. Dietrich, ISOLDE collaboration, M. Fanciulli, K. Bharuth-Ram, and R. Sielemann, Applied Physics Letters 80, 2657 (2002b).
- Yoshida et al. (2016) Y. Yoshida, Y. Ino, and K. Tanaka, Solid State Phenomena 242, 211 (2016).
- Hohenberg and Kohn (1964) P. Hohenberg and W. Kohn, Phys. Rev. 136, B864 (1964).
- Kohn and Sham (1965) W. Kohn and L. J. Sham, Phys. Rev. 140, A1133 (1965).
- Perdew et al. (1996) J. P. Perdew, K. Burke, and M. Ernzerhof, Phys. Rev. Lett. 77, 3865 (1996).
- Perdew et al. (1997) J. P. Perdew, K. Burke, and M. Ernzerhof, Phys. Rev. Lett. 78, 1396 (1997).
- (48) See http://elk.sourceforge.net/ for a description of the features and documentation of the ELK code.
- Kresse and Hafner (1993) G. Kresse and J. Hafner, Phys. Rev. B 47, 558 (1993).
- Kresse and Hafner (1994) G. Kresse and J. Hafner, Phys. Rev. B 49, 14251 (1994).
- Kresse and Furthmüller (1996) G. Kresse and J. Furthmüller, Phys. Rev. B 54, 11169 (1996).
- Kresse and Furthm’́uller (1996) G. Kresse and J. Furthm’́uller, Comput. Mater. Sci. 6, 15 (1996).
- Blöchl (1994) P. E. Blöchl, Phys. Rev. B 50, 17953 (1994).
- Kresse and Joubert (1999) G. Kresse and D. Joubert, Phys. Rev. B 59, 1758 (1999).
- Monkhorst and Pack (1976) H. J. Monkhorst and J. D. Pack, Phys. Rev. B 13, 5188 (1976).
- Madelung (1996) O. Madelung, ed., Semiconductors – Basic Data, 2nd ed. (Springer-Verlag, Berlin Heidelberg, 1996).
- Madsen et al. (2001) G. K. H. Madsen, P. Blaha, K. Schwarz, E. Sjöstedt, and L. Nordström, Phys. Rev. B 64, 195134 (2001).
- Singh and Nordstrom (2006) D. J. Singh and L. Nordstrom, Planewaves, Pseudopotentials, and the LAPW method, 2nd ed. (Springer US, New York, 2006).
- Andersen (1975) O. K. Andersen, Phys. Rev. B 12, 3060 (1975).
- Moroni et al. (1999) E. G. Moroni, W. Wolf, J. Hafner, and R. Podloucky, Phys. Rev. B 59, 12860 (1999).
- Bodmer (1953) A. R. Bodmer, Proceedings of the Physical Society. Section A 66, 1041 (1953).
- Shirley (1964) D. A. Shirley, Reviews of Modern Physics 36, 339 (1964).
- Angeli (2004) I. Angeli, Atomic Data and Nuclear Data Tables 87, 185 (2004).
- Mauger et al. (2014) L. Mauger, M. S. Lucas, J. A. Muñoz, S. J. Tracy, M. Kresch, Y. Xiao, P. Chow, and B. Fultz, Phys. Rev. B 90, 064303 (2014).
- ichi Tani et al. (2010) J. ichi Tani, M. Takahashi, and H. Kido, Physica B: Condensed Matter 405, 2200 (2010).
- Reuther and Behr (2002) H. Reuther and G. Behr, Hyperfine Interactions 141-142, 435 (2002).
- Dufek et al. (1995) P. Dufek, P. Blaha, and K. Schwarz, Phys. Rev. Lett. 75, 3545 (1995).
- Wdowik and Ruebenbauer (2007) U. D. Wdowik and K. Ruebenbauer, Physical Review B 76 (2007), 10.1103/PhysRevB.76.155118.
- Northrup and Zhang (1993) J. E. Northrup and S. B. Zhang, Phys. Rev. B 47, 6791 (1993).
- Haynes (2014) W. M. Haynes, ed., CRC Handbook of Chemistry and Physics,, 95th ed. (CRC Press, Boca Raton, Florida, 2014).
- Resende et al. (1999) A. Resende, R. Jones, S. Oberg, and P. R. Briddon, Phys. Rev. Lett. 82, 2111 (1999).
- Shaw et al. (2007) M. J. Shaw, J. P. Goss, and P. R. Briddon, in Theory of Defects in Semiconductors, Topics in Applied Physics, Vol. 104, edited by D. A. Drabold and S. K. Estreicher (Springer Berlin Heidelberg, 2007) pp. 69–94.
- Mathiot and Hocine (1989) D. Mathiot and S. Hocine, Journal of Applied Physics 66, 5862 (1989).
- Kolkovsky et al. (2012) V. Kolkovsky, L. Scheffler, and J. Weber, physica status solidi (c) 9, 1996 (2012).
- Scheffler et al. (2015) L. Scheffler, V. Kolkovsky, and J. Weber, Journal of Applied Physics 117, 045713 (2015).
- Brotherton et al. (1985) S. D. Brotherton, P. Bradley, and A. Gill, Journal of Applied Physics 57, 1941 (1985).
- Istratov et al. (1997) A. A. Istratov, H. Hieslmair, C. Flink, T. Heiser, and E. R. Weber, Applied Physics Letters 71, 2349 (1997).
- Yarykin and Weber (2011) N. Yarykin and J. Weber, Physical Review B (2011), 10.1103/PhysRevB.83.125207.
- Acet et al. (1994) M. Acet, H. Zähres, E. F. Wassermann, and W. Pepperhoff, Phys. Rev. B 49, 6012 (1994).
- Mori et al. (2009) Y. Mori, H. Nakano, G. Sakane, G. Aquilanti, H. Udono, and K. Takarabe, physica status solidi (b) 246, 541 (2009).
- Thompson et al. (1989) P. Thompson, J. J. Reilly, and J. M. Hastings, Journal of Applied Crystallography 22, 256 (1989).
- Mielczarek and Winfree (1975) E. V. Mielczarek and W. P. Winfree, Phys. Rev. B 11, 1026 (1975).
- Niculescu et al. (1976) V. Niculescu, K. Raj, J. I. Budnick, T. J. Burch, W. A. Hines, and A. H. Menotti, Phys. Rev. B 14, 4160 (1976).
- Hamaya et al. (2011) K. Hamaya, T. Murakami, S. Yamada, K. Mibu, and M. Miyao, Phys. Rev. B 83, 144411 (2011).
- Miiller et al. (2015) W. Miiller, J. M. Tomczak, J. W. Simonson, G. Smith, G. Kotliar, and M. C. Aronson, Journal of Physics: Condensed Matter 27, 175601 (2015).
- Reuther et al. (2001) H. Reuther, G. Behr, and A. Teresiak, Journal of Physics: Condensed Matter 13, L225 (2001).
- Dusausoy et al. (1971) Y. Dusausoy, J. Protas, R. Wandji, and B. Roques, Acta Crystallographica Section B 27, 1209 (1971).
- Fanciulli et al. (1995) M. Fanciulli, C. Rosenblad, G. Weyer, A. Svane, N. E. Christensen, and H. von Känel, Phys. Rev. Lett. 75, 1642 (1995).
- Pauling and Soldate (1948) L. Pauling and A. M. Soldate, Acta Crystallographica 1, 212 (1948).
- Fanciulli et al. (1996) M. Fanciulli, A. Zenkevich, I. Wenneker, A. Svane, N. E. Christensen, and G. Weyer, Phys. Rev. B 54, 15985 (1996).
- Balkanski et al. (1966) M. Balkanski, P. Moch, and G. Parisot, The Journal of Chemical Physics 44, 940 (1966).
- Wertheim and Buchanan (1967) G. K. Wertheim and D. N. E. Buchanan, Phys. Rev. 161, 478 (1967).
- Leblanc et al. (1985) M. Leblanc, J. Pannetier, G. Ferey, and R. de Pape, Revue de Chimie Minerale 22, 107 (1985).
- Wertheim et al. (1968) G. K. Wertheim, H. J. Guggenheim, and D. N. E. Buchanan, Phys. Rev. 169, 465 (1968).
- Wilkinson et al. (1959) M. K. Wilkinson, J. W. Cable, E. O. Wollan, and W. C. Koehler, Phys. Rev. 113, 497 (1959).
- Pfletschinger (1968) E. Pfletschinger, Zeitschrift für Physik 209, 119 (1968).
- Kittel (2005) C. Kittel, Introduction to Solid State Physics, 8th ed. (John Wiley & Sons, Inc., New York, 2005).
- Papaconstantopoulos (1975) D. A. Papaconstantopoulos, Phys. Rev. B 11, 4801 (1975).
- Ionescu et al. (2005) A. Ionescu, C. A. F. Vaz, T. Trypiniotis, C. M. Gürtler, H. García-Miquel, J. A. C. Bland, M. E. Vickers, R. M. Dalgliesh, S. Langridge, Y. Bugoslavsky, Y. Miyoshi, L. F. Cohen, and K. R. A. Ziebeck, Phys. Rev. B 71, 094401 (2005).
- Niculescu et al. (1983) V. A. Niculescu, T. J. Burch, and J. I. Budnick, Journal of Magnetism and Magnetic Materials 39, 223 (1983).
- Leong et al. (1997) D. Leong, M. Harry, K. J. Reeson, and K. P. Homewood, Nature 387, 686 (1997).
- Filonov et al. (1996) A. B. Filonov, D. B. Migas, V. L. Shaposhnikov, N. N. Dorozhkin, G. V. Petrov, V. E. Borisenko, W. Henrion, and H. Lange, Journal of Applied Physics 79, 7708 (1996).
- Fanciulli et al. (1997) M. Fanciulli, C. Rosenblad, G. Weyer, A. Svane, N. E. Christensen, H. von Känel, and C. O. Rodriguez, Journal of Physics: Condensed Matter 9, 1619 (1997).
- Watanabe et al. (1963) H. Watanabe, H. Yamamoto, and K. ichi Ito, J. Phys. Soc. Jpn. 18, 995 (1963).
- López-Moreno et al. (2012) S. López-Moreno, A. H. Romero, J. Mejía-López, A. Muñoz, and I. V. Roshchin, Phys. Rev. B 85, 134110 (2012).
- Strempfer et al. (2004) J. Strempfer, U. Rütt, S. P. Bayrakci, T. Brückel, and W. Jauch, Phys. Rev. B 69, 014417 (2004).
- Wollan et al. (1958) E. O. Wollan, H. R. Child, W. C. Koehler, and M. K. Wilkinson, Phys. Rev. 112, 1132 (1958).
- Weber (1983) E. Weber, Applied Physics A 30, 1 (1983).
- Ludwig and Woodbury (1960a) G. W. Ludwig and H. H. Woodbury, Phys. Rev. 117, 1286 (1960a).
- Weihrich and Overhof (1996) H. Weihrich and H. Overhof, Phys. Rev. B 54, 4680 (1996).
- Sanati et al. (2007) M. Sanati, N. G. Szwacki, and S. K. Estreicher, Phys. Rev. B 76, 125204 (2007).
- Ludwig and Woodbury (1960b) G. W. Ludwig and H. H. Woodbury, Phys. Rev. Lett. 5, 98 (1960b).
- Liechtenstein et al. (1995) A. I. Liechtenstein, V. I. Anisimov, and J. Zaanen, Phys. Rev. B 52, R5467 (1995).
- Katayama-Yoshida and Zunger (1985) H. Katayama-Yoshida and A. Zunger, Phys. Rev. B 31, 7877 (1985).
- Zhao et al. (2001) S. Zhao, L. V. C. Assali, J. F. Justo, G. H. Gilmer, and L. C. Kimerling, Journal of Applied Physics 90, 2744 (2001).
- Lemke (1981) H. Lemke, physica status solidi (a) 64, 215 (1981).
- Ghatnekar-Nilsson et al. (1993) S. Ghatnekar-Nilsson, M. Kleverman, P. Emanuelsson, and H. G. Grimmeiss, Semiconductor Science and Technology 8, 1857 (1993).
- Gunnlaugsson et al. (2006b) H. Gunnlaugsson, K. Bharuth-Ram, M. Dietrich, M. Fanciulli, H. Fynbo, and G. Weyer, Hyperfine Interactions 169, 1315 (2006b).
- Bergholz (1983) W. Bergholz, Physica B+C 116, 312 (1983).
- Watkins (1992) G. D. Watkins, “Deep centers in semiconductors,” (Gordon and Breach Science Publishers, New York, 1992) Chap. 3, p. 177, 2nd ed.
- Zunger and Lindefelt (1982) A. Zunger and U. Lindefelt, Phys. Rev. B 26, 5989 (1982).
- Beeler et al. (1985) F. Beeler, O. K. Andersen, and M. Scheffler, Phys. Rev. Lett. 55, 1498 (1985).
- Kaminski et al. (2003) P. Kaminski, R. Kozlowski, A. Jelenski, T. Mchedlidze, and M. Suezawa, Japanese Journal of Applied Physics 42, 5415 (2003).
- Tanaka and Kitagawa (1995) S. Tanaka and H. Kitagawa, Japanese Journal of Applied Physics 34, L721 (1995).
- Henkelman et al. (2000) G. Henkelman, B. P. Uberuaga, and H. Jónsson, J. Chem. Phys. 113, 9901 (2000).
- Henkelman and Jónsson (2000) G. Henkelman and H. Jónsson, J. Chem. Phys. 113, 9978 (2000).
- Mchedlidze and Suezawa (2002) T. Mchedlidze and M. Suezawa, Physica B: Condensed Matter 324, 188 (2002).
- Muller et al. (1982) S. H. Muller, G. M. Tuynman, E. G. Sieverts, and C. A. J. Ammerlaan, Phys. Rev. B 25, 25 (1982).
- Tang et al. (2013) C. K. Tang, L. Vines, V. P. Markevich, B. G. Svensson, and E. V. Monakhov, Journal of Applied Physics 113, 044503 (2013).