Crowdsourcing the Robin Hood effect in cities
Abstract
Socioeconomic inequalities in cities are embedded in space and result in neighborhood effects, whose harmful consequences have proved very hard to counterbalance efficiently by planning policies alone. Considering redistribution of money flows as a first step toward improved spatial equity, we study a bottom-up approach that would rely on a slight evolution of shopping mobility practices. Building on a database of anonymized card transactions in Madrid and Barcelona, we quantify the mobility effort required to reach a reference situation where commercial income is evenly shared among neighborhoods. The redirection of shopping trips preserve key properties of human mobility, including travel distances. Surprisingly, for both cities only a small fraction () of trips need to be altered to reach equality situations, improving even other sustainability indicators. The method could be implemented in mobile applications that would assist individuals in reshaping their shopping practices, to promote the spatial redistribution of opportunities in the city.
The growth of economic inequality has raised concern and attention in recent years Piketty2014 ; Stiglitz2015 . In cities these inequalities are embedded in space, as a result of entangled processes which include location choices of households and businesses, daily mobility, segregation and closure attitudes, central planning, or global economic restructuring. Over the course of several decades their joint actions have given rise to segregated cities, characterized by uneven distributions of capital among their neighborhoods. While the intensity of socioeconomic inequalities vary from one city to another, the general observation that “some neighborhoods are poorer than others” has been made for cities with different age, in every continent, and for different periods in urban history Pinol2003 ; Goldsmith2010 ; Cassiers2012 ; UN-HABITAT2014 . An abundant literature has long depicted the neighborhood effect Friedrichs2003 – the neighborhood impacts the life trajectories of the residents, even when controlling for their individual characteristics –, and highlighted its societal costs and enduring consequences Blau1982 ; Brooks-Gunn1997 ; Vallee2010 ; Womack1972 ; Chetty2015 .
Over the last decade, increasing volumes of digital geographic footprints have been produced by individuals using mobile ICT devices, and these footprints have been increasingly analyzed by scientists as well. These data are not free of biases Lewis2015 or privacy concerns Montjoye2015 , but they undeniably constitute an important asset for understanding social phenomena in detailed spatio-temporal contexts Lazer2009 ; Eagle2010 ; Onnela2007 ; Lu2012 ; Sun2013 ; Gonzalez2008 . They also have the potential to reveal the information required to coordinate individuals’ actions, so that large groups of people can tackle issues which are distributed and spatial by nature. This is particularly true in the case of mobility networks, which already integrate such footprints in feedback mechanisms: people produce data when moving, and their travel decisions are partly guided by the data produced by others. Examples include GPS navigation using real-time traffic data, local search and discovery of new places, or location-based dating applications. So far, these footprints have been mainly used in applications intended to enhance individual satisfaction (time savings, discovery of a location, encounter of a partner), but they have also fostered spontaneous and large-scale solidarity movements during disasters (e.g. Facebook’s safety check, or the use of dedicated Twitter hashtags). An important question is thus whether we can scale up, and address complex issues through distributed and coordinated approaches relying on such data. Here we refer to complex social issues for which improvements would necessarily occur on longer timescales. There is a need to relate smart technology with sustainability and spatial justice in cities McLaren2015 , and this implies building upon the existing practices of individuals. In this work, we develop further this idea by focusing on a complex problem: the reduction of spatial inequality in large cities.
The “Robin-Hood effect” refers to a process through which capital is redistributed to reduce inequality. A spatial and city-scale implementation would then consist in taking from the rich neighborhoods to give to the poor. This role is normally played by the city’s governance, and is essential to mitigate spatial inequality. However, studies in cities worldwide have demonstrated that top-down planning and fiscal policies alone seem inefficient in significantly counterbalancing the numerous consequences of the neighborhood effect Ostendorf2001 ; Satterthwaite2013 . It has also been long emphasized that developing economic activity in disadvantaged regions indirectly benefits the surrounding populations, by fostering job opportunities, transport facilities and increased safety Kanbur2005 . Here, we study an original approach to rebalance economic activity among the neighborhoods of a city. The scenarios we explore would not incur any additional environmental or monetary costs, but would instead require slight modifications of daily shopping mobility practices.
According to surveys, shopping and leisure trips account for to of the individuals’ daily travels AASHTO . Such trips virtually move money from one part of the city to another, and directly contribute to shape the spatial distribution of wealth across neighborhoods. By connecting areas, shopping trips also foster metropolitan integration and “social cohesion” Miciukiewicz2012 , whilst the resulting money flows are a key component of the development of territories Ruault2014 . Large metropolitan areas are characterized by mixed land use in many of their neighborhoods. Every time a resident has to buy usual products such as food, gas or clothes, he/she can actually choose among several stores and neighborhoods to do so, sometimes without even increasing his/her travel time.
In the following we focus on the two largest Spanish cities, Madrid and Barcelona. Performing exploratory experiments, we demonstrate that they could be more evenly balanced thanks to the cumulative addition of small and reasonable changes in a limited fraction of their residents’ shopping destinations. While there exists various spatial indicators for quantifying territorial inequalities, static indicators fail to provide a clear picture of the collective effort that would be required to reach a certain level of redistribution. With this in mind, we quantify the proportion of individual shopping trips that should be redirected in order to evenly share the commercial income between neighborhoods, the first step of a conceivable path toward a spatial redistribution of opportunities in the city. We show that alternative mobility scenarios not only allow to distribute money more evenly in space, but also to enhance the spatial mixing of residents through their shopping mobility, without increasing the total distance traveled, nor changing the individuals’ effective purchases and mobility routines. The following of this paper is an exploration on how money flows in cities could be more evenly distributed, if shopping spatial behavior was slightly restructured. In the following of this paper, we use zipcodes delimitation as proxies for neighborhoods. While zipcodes correspond to administrative units which are very coarse-grained proxies for effective neighborhoods, this choice was imposed by the spatial resolution of the available data.
Material and Methods
Data
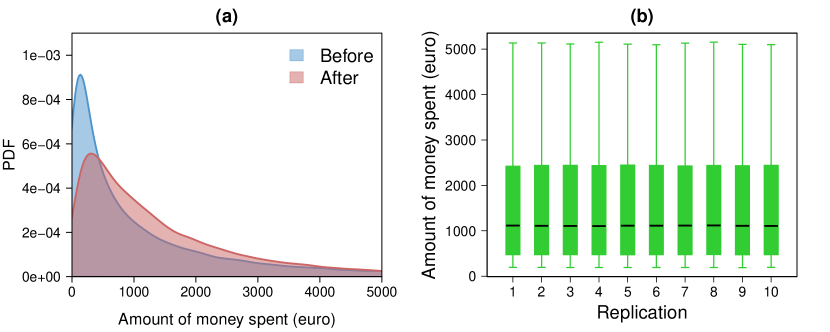
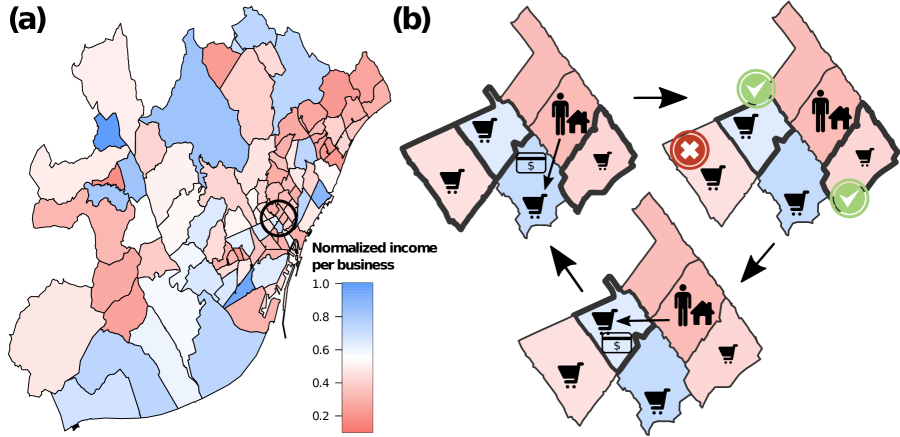
We use a dataset containing the metadata of one year of bank card payments from more than anonymous users in over businesses of Barcelona and Madrid. Each transaction is time-stamped and contains the information collected by the bank on both the cardholder and the business. It also includes the customer’s age and residence’s zipcode, the business category and its geographical coordinates (see the Appendix for details and Martinez:2016 ; Yoshimura:2016 for other recent examples of research relying on similar data). From these data there are two obvious ways to estimate inequality among neighborhoods: first, in measuring the income of their residents – indirectly estimated through the amount of money spent during the year; second, in measuring the income resulting from the commercial activity of businesses located in these neighborhoods. The latter is particularly interesting because it results from the spatial organization of shopping trips, which may be much easier to alter than any other type of daily trips, notably commuting. The average commercial income of businesses in Barcelona’s neighborhoods, resulting from shopping trips, is mapped on Figure 1a. This map reveals that according to this measure, some neighborhoods are indeed five times richer than others.
Rewiring the shopping trips networks
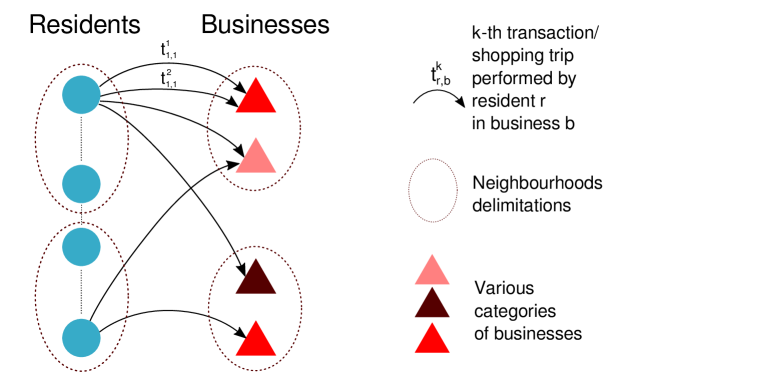
From the data for both cities we construct the bipartite spatial network whose nodes are individuals and businesses, and whose edges stand for transactions (see Figure S2 in Appendix). We then perform rewiring experiments, in which randomly selected transactions are redirected toward alternative businesses of the same category, but located elsewhere in the city (Figure 1b). The rewiring methods we implemented operate directly at the level of individual transactions (see Figure S2 in Appendix). A rewiring operation then consists in randomly selecting a transaction (made by user in business ), and an alternative business , such than and are of the same category (see in Appendix the details of the 16 business categories), but located in different neighborhoods. The rewiring occurs only if the change fulfills a number of constraints which are expressed at the city level. The calculation of these constraints are based on the candidate configuration of the shopping trips network (i.e. after rewiring operations), the current configuration (after rewiring operations) and the original shopping trips network.
Four dimensions to assess the likelihood of the network’s configuration
We consider four dimensions to assess the different network configurations from an economic, social and environmental point of view. Since our main objective is to rebalance the distribution of commercial income among the neighborhoods, we first focus on the economic dimension. We denote by the wealth inequality among the city’s neighborhoods after rewiring operations. It is defined as the distance to a reference homogeneous situation, where the commercial income resulting from purchases would be equally shared among all neighborhoods. We have:
| (1) |
where is the number of neighborhoods, is the average income of the businesses located in the neighborhood after rewiring operations, and represents the wealth per neighborhood in the reference configuration where commercial income is evenly distributed across neighborhoods, such that
| (2) |
Another important aspect is related to the social nature of mobility in the city that might prevent some neighborhoods from ghettoization. To measure to what extent individuals residing in various neighborhoods mix in the city space as a result of their travels, for each neighborhood we count the number of times the residents of traveled to each of the neighborhoods ( included), after rewiring operations. Then, by averaging the vector of trips over all the neighborhoods, we compute a geographical diversity index (after rewiring operations),
| (3) |
where represents the homogeneous distribution of visits originating from and in direction to all neighborhoods,
| (4) |
The third considered dimension is the distance traveled by individuals. Summing the distances traveled by individuals for all their shopping trips, we can compute the total distance traveled, as measured after rewiring transactions. Details about the method used to estimate the shopping trips distances are available in Appendix.
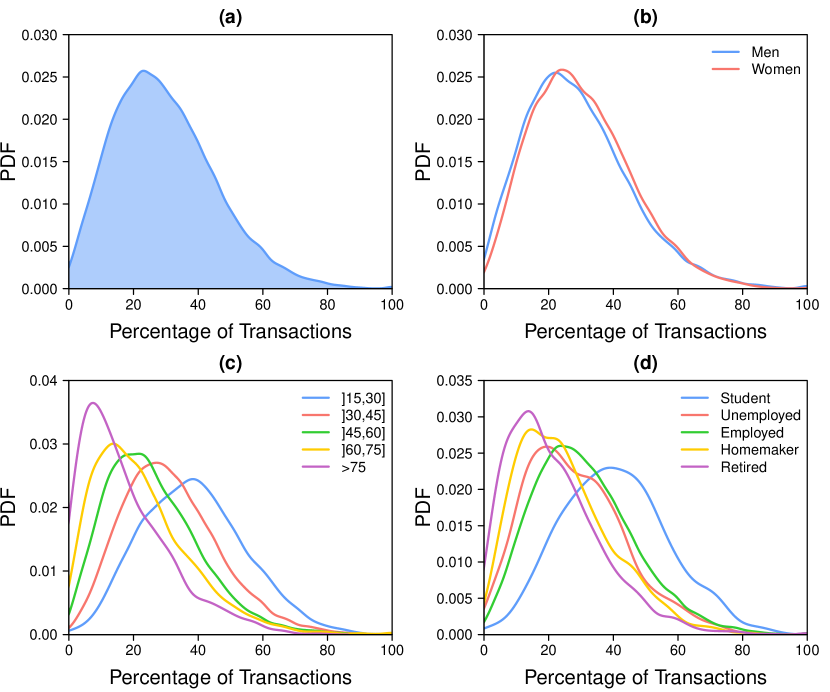
Finally, we are also interested in individual mobility routines and the tendency of individuals to return to already visited places. For each individual we calculate an exploration rate . It is defined as the number of unique businesses he/she has visited divided by his/her total number of transactions, after rewiring operations. Considering the empirical peaked distribution of among the population of customers (see Figure 3b), in the following we only consider the average value .
Rewiring constraints
As mentioned above, a candidate reconfiguration of the shopping trips network ( rewiring operations) will occur if and only if the proposed change respects a number of constraints regarding the current configuration ( rewiring operations) and the original shopping trips network. We consider four constraints, each of them concerns one of the four economic, social and environmental dimensions described in the previous section,
-
•
A first constraint applies on the wealth distribution; it ensures that each destination change contributes to iteratively homogenize the distribution of commercial income across neighborhoods.
-
•
A constraint on the spatial mixing of individuals resulting from their shopping travels. In order to be accepted, a rewiring operation has to preserve the diversity of neighborhoods visited, hence the degree of spatial mixing of individuals residing in different neighborhoods.
-
•
A third constraint on the total distance traveled, to guarantee that each destination change does not result in increasing the total distance traveled. The distance associated to each individual transaction is calculated with regard to the individual’s main activity place at this moment of the day.
-
•
Finally, a constraint on the spatial exploration rate of individuals, to preserve the behavioral mobility routines measured in the population.
All constrains have the same form and are satisfied if the following condition holds
| (5) |
where denotes the number of rewiring operation, and is a parameter positive or equal to zero. The general form of Equation 5 allows us to fix an objective upper bound for each dimension with respect to its original value . Then as long as is greater than , each rewiring operation must decrease . Once is smaller than , then rule 5 ensures that none of the following rewiring operations will increase above . An experiment is then defined by a set of four values that specify the maximal value desired for each variable of interest.
Algorithm
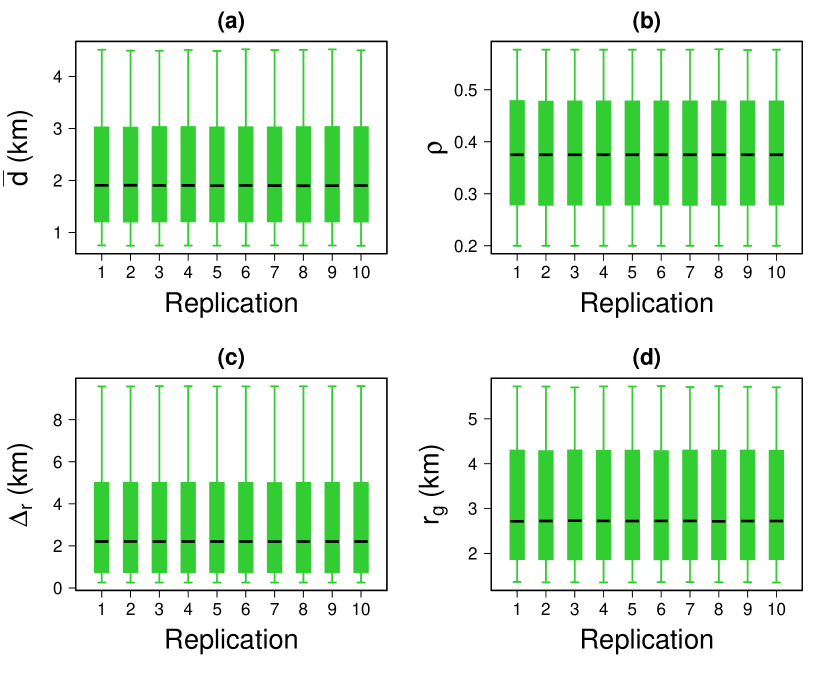
The process is unambiguously specified by Algorithm 1. One should note that the products purchased and the amount of expenses of each individual are preserved. This iterative process is run until the rewiring rate falls below a given threshold (see the Appendix for more details). Since the rewiring process is stochastic, all the results we discuss in the following sections have been averaged over hundreds of replications. Numerous rewiring methods fulfilling the aforementioned conditions could be proposed. However, we favored a numerical approach because of the large number of transactions () and also because of the constraints we impose to guarantee realistic and interesting properties.
Besides, the random selection of (i) the transaction to rewire and (ii) of the candidate business (step 1. of the algorithm) can be uniform (denoted “Uniform” sampling hereafter) or proportional to their amount in the case of transactions and/or inversely proportional to the average income of the targeted neighborhood for the businesses (denoted “Weighted” sampling hereafter). Even more informed methods might be proposed, but for the sake of simplicity only simple random procedures are tested in the following.
Results
Reachability of even spatial distributions
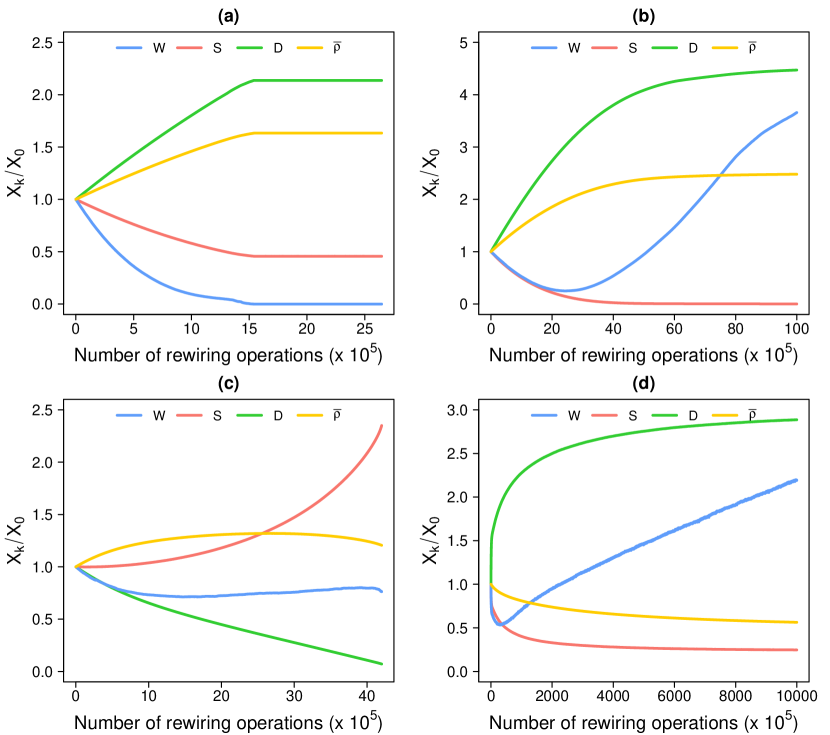
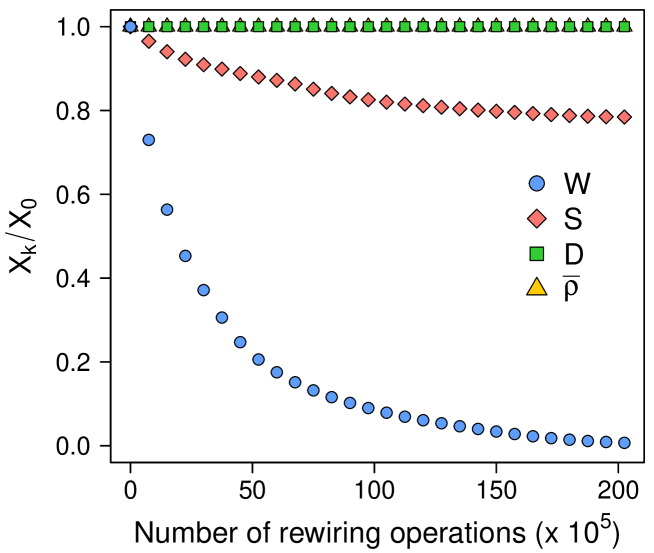
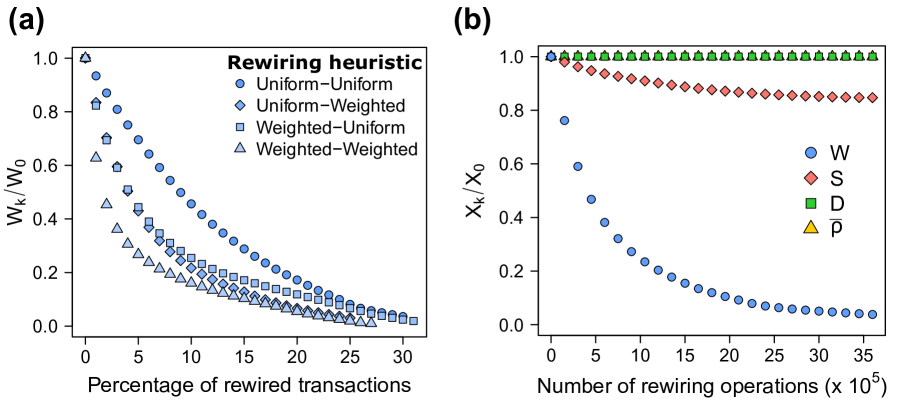
We first investigate the reachability of an even spatial distribution of the commercial income resulting from individual purchases, while the variables , and remain in the range of their empirical values. To address this question, we apply the rewiring method previously described with the four constraints of Equation 5 such as , , and . This constitutes our Reference scenario. Figure 2a shows the evolution of inequality in the urban area of Barcelona as a function of the fraction of rewired transactions, according to various sampling methods. Surprisingly, even with basic random sampling methods, it is possible to reduce spatial inequality between neighborhoods by more than while reassigning only of individual transactions. All the methods produce the same qualitative behavior – an early regime of very fast decay, followed by a regime of slower decay. Weighted methods are naturally more efficient, and allow to reach spatial equity by redirecting a smaller fraction of transactions. In particular, a reduction of wealth inequality of () can be obtained by rewiring only of the transactions if the sampling method is double weighted.
The state of the other variables , and is also monitored along the process, as shown in Figure 2b for a Uniform-Uniform sampling method. What makes the previous results remarkable is in fact that income redistribution is achieved without increasing the distance traveled by individuals (), nor changing their mobility routines (). Moreover, a positive side-effect is to increase the frequency of encounters of individuals living in different parts of the city – as indicated by the decrease of –, an effect that could not be anticipated from the rewiring constraints alone (). The increase of spatial mixing is the consequence of individual shopping trips more evenly distributed in the city space, required to homogenize the income among neighborhoods. The behavior of is non trivial, notably because one could imagine unrealistic solutions that would simultaneously even the spatial distribution of business income and decrease the total distance traveled, by rewiring most of the shopping trips to the closest neighborhood containing businesses of the relevant category. In this case the spatial mixing of individuals would decrease dramatically, and the distance to an homogeneous mixing would increase. Here the decay of guarantees that it is not the case.
Preservation of human mobility properties
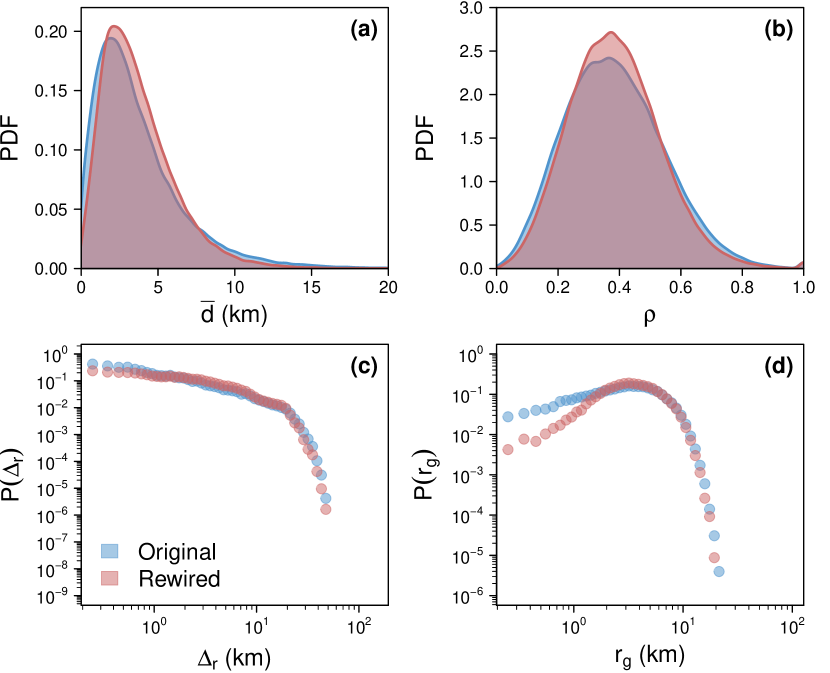
We wish to control further the likelihood of the rewired shopping mobility networks, and ensure that they preserve the spatial properties of individual human mobility. A small set of indicators have proved to be useful to describe the statistical and spatial properties of human mobility Gonzalez2008 . These include the jump length between consecutive locations , the radius of gyration (with , is the characteristic travel distance of individual with center of mass after displacements), and the tendency to return to already visited places . In our case, for each individual is simply defined as the ratio between the number of unique businesses visited and the total number of transactions.
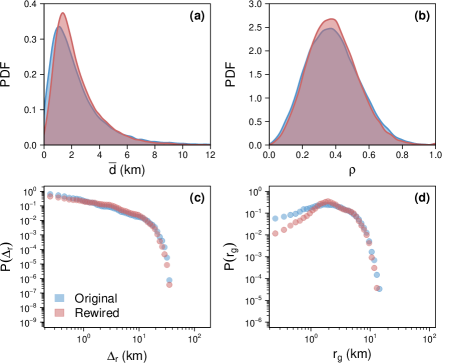
Figure 3 shows their empirical and simulated values, plus the average distance traveled by each individual for each shopping trip (see the Appendix for details on the calculation of shopping trips distances). On each panel both curves overlap almost perfectly, indicating that the rewiring has no significant effect on the key mobility properties. The simulated distributions of and are slightly more peaked than the empirical ones.
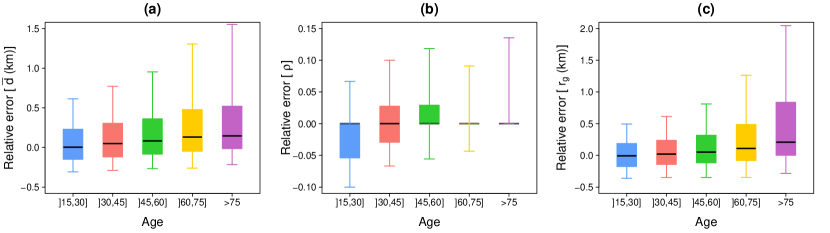
We showed in a previous study that young adults tend to spend their money further from their neighborhood of residence Lenormand2015 . Coherently their shopping trips are those that are the most affected in the simulated scenarios (see Figure S6 in Appendix). But the simulated scenarios also contain some questionable aspects. For example, elderly people are those whose displacements would increase the most (with regard to their current shopping travel distances – see Figure S5 in the Appendix).
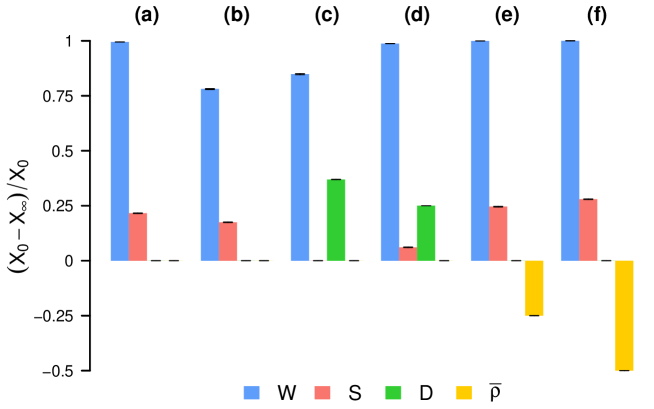
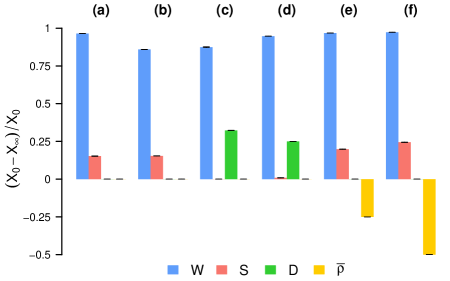
Multi-objective improvement
We now perform multi-criteria rewiring experiments in order to measure to what extent redistribution can be achieved while improving simultaneously other important aspects of urban mobility. To this end, we perform the series of experiments summarized in Table 1. The objective is to even the wealth distribution among neighborhoods () and also improve either , or without worsening the other two. Figure 4 gives the relative gains and losses upon the four indicators, and the last two columns of Table 1 contain the asymptotic values obtained for the reduction rate of wealth inequality, for Barcelona (B) and Madrid (M).
| Experiment | W (B/M) | ||||
|---|---|---|---|---|---|
| (a) Reference | |||||
| (b) Spatial mixing | |||||
| (c) energy savings | |||||
| (d) energy savings | |||||
| (e) Exploration rate | |||||
| (f) Exploration rate |
These experiments proove that it is not always possible to combine significant improvements on several dimensions simultaneously. This is not an issue with the method, but rather with the set of objectives which are somewhat opposite. Most individuals perform their shopping trips near their residence – as highlighted by the empirical distributions in Figure 3 – and consequently it is not feasible to diversify the neighborhoods where an individual regularly travels to – in order to improve spatial mixing – and at the same time decrease the total travel distance . More surprisingly, experiment (b) indicates that it is also not possible to simultaneously improve the wealth redistribution and the spatial mixing of individuals. The two indicators are based on different metrics (the amount of money spent per business for and the number of trips for ), which imply different reference egalitarian situations (see Figure S7 in Appendix for more details). Optimization is thus a trade-off between the various consequences of shopping mobility at the city scale. However, experiments (c) and (d) prove that it is possible to significantly decrease the total distance traveled and in the same time to strongly reduce wealth inequality among neighborhoods, but not as much as in the reference experiment. Still, it is remarkable that experiment (d) results in an alternative mobility network such that the spatial inequality of the average business income is reduced by , while the total distance associated to shopping mobility is reduced by , the level of spatial mixing is preserved, as well as the individual mobility routines. Finally, experiments (e) and (f) show that even if residents deeply restructured their mobility routines, and typically started going to a new business each time they perform a new shopping trip, keeping control of the total distance traveled in the city would prevent from increasing the mixing of individuals coming from different neighborhoods beyond . The gains in terms of wealth redistribution would not be significant when compared to the reference experiment (a).
Discussion
Reducing urban segregation and increasing spatial justice are some of the major challenges faced by cities worldwide, and the digital footprints passively produced by their residents constitute a promising resource to help addressing these issues from the bottom. This study is a first attempt to quantify the relation between shopping mobility and the spatial distribution of economic activity in the city. The alternative shopping trips resulting from our experiments offer an interesting trade-off between the preservation of essential aspects – the effective purchases of individuals and households, and their mobility properties – and some reasonable changes in the places where they spend their money. The addition of small changes in the shopping destinations of individuals can dramatically impact the spatial distribution of money flows in the city, and the frequency of encounters between residents of different neighborhoods, even if the total number of changes remains relatively small. These results have important consequences, and they lead in particular to the decisive question of the effective implementation of alternative shopping travels, like those drawn by our experiments. While the decision process behind each individual redirection may appear intricate for a single person, one could easily imagine dedicated mobile applications, querying databases similar to the one we used in this paper. Their purpose would be to assist their users in a transition toward a more socially and spatially concerned shopping mobility.
Limitations of the study
However, one should keep in mind that individuals do not guide most of their travel decisions by philanthropy, but instead by balancing accessibility, price and business characteristics. Individuals first choose their casual shopping destinations with regard of transport facilities and travel time budget Recker1978 . Here as accessibility information we considered the Euclidean distance between neighborhoods. However, in urban environments the Euclidean distance is rarely a direct proxy for travel time Gallotti2015 , and some of the rewired shopping trips are unlikely to be performed in the real world. more accurate measures of travel time. In future studies transport APIs and road network data could be used instead to calculate more realistic travel distances between points in the city. Also, from a choice point of view, distance is not the only one determinant of shopping destination choices. The inequality might be also due to the inequality between businesses of the same category, which may differ substantially in terms of the price, product quality, etc. The reader should also remind that prices of retail goods are not uniform across a city’s neighborhoods, they may display strong spatial variation, affecting consumer choices and spatial behavior in complex ways.
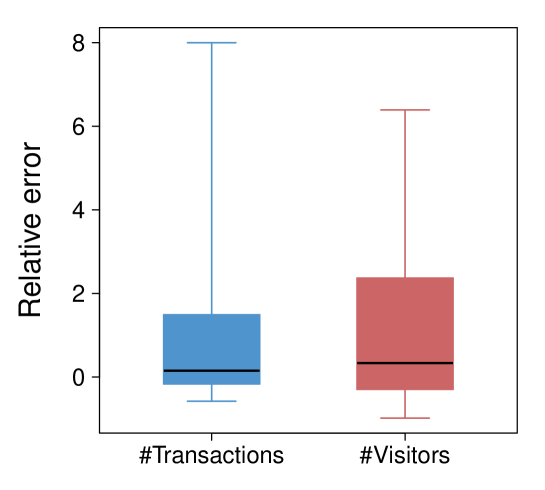
We also assumed that every shopping trip follows the simple pattern , and we did not consider the more complicated case of chained trips (e.g. ) during which individuals join several trips associated with different purposes Schneider2013 . Destination choices for certain types of shopping travels are also motivated by reasons that are not only related to the sole proximity (e.g. the local market is a place where residents can build a sense of community, discuss the problems of the neighborhood, make social contacts useful in everyday life). People also tend to choose the places where they spend money according to several other key factors, the price of products in the first place, but also according to some more personal appreciations, such as the ”atmosphere” of neighborhoods and the feeling of well-being they provide. In large cities, the neighborhoods strongly differ in the quality of their planning and architecture, in their public spaces, in their amenities and leisure opportunities, commercial fabric, in their safety. Additionally, the changes might be considered as problematic, since a profound spatial reorganization of shopping mobility in the city could have consequences on the spatial structure of employment in the first place (see Figures S8 and S9 in Appendix showing the evolution of the number of clients and transactions per business), then on residences, finally on their commercial offer and ambiance. This questions the likelihood and desirability of the objective configuration we chose, in which the average commercial income per business is evenly balanced across neighborhoods. Still it has the advantage to be unambiguously defined, and constitutes an immediate, easy-to-think-with reference situation
For the sake of simplicity, we considered none of the aforementioned factors but they could be implemented in more involved frameworks derived from our work. A number of additional constraints, aiming at making the rewiring schemes more realistic from a spatial economy perspective, could be introduced in future scenarios. These include the preservation of the number of transactions and income per business (or at least a certain fraction of them); the restriction of the rewiring operations to certain business categories; limiting changes for certain socio-demographic categories of population (such as elderly people); or ensuring the temporal likelihood of the simulated scenarios (so that the rerouted shopping travels are homogeneously distributed through time).
Concluding remarks
There are recent, encouraging examples of fast and wide adoptions of new daily practices, whose benefits are essentially collective. Examples include garbage differentiation Robinson2005 , the increasing role of bicycle in urban transport and the development of bicycle sharing systems Dill2003 , or the open-source movement and the dedication of a growing number of individuals to collectively build free knowledge databases (e.g. Wikipedia, StackExchange, the free software movement). In these cases, the remuneration of participants, if any, is essentially symbolic. The success of a spatial counterpart to these altruistic behaviors could rejuvenate the very meaning of the so-called sharing economy McLaren2015 . As citizens produce the data that document their location and activity patterns, in return these data could serve not only the specific interest of the institution collecting them, but also support fair socio-economic initiatives. Our study brings evidence that these geographical footprints we passively produce can support bottom-up responses to big societal issues, an expected feature of truly smart cities.
Acknowledgements
We wish to thank Julie Vallée and Suma Desu for providing feedback on an early version of the manuscript. We also thank Jean-Loup Guillaume for fruitful discussions on the rewiring problem. Partial financial support has been received from the Spanish Ministry of Economy (MINECO) and FEDER (EU) under the project INTENSE@COSYP (FIS2012-30634), and from the EU Commission through projects EUNOIA and INSIGHT. The work of TL has been funded under the PD/004/2015, from the Conselleria de Educación, Cultura y Universidades of the Government of the Balearic Islands and from the European Social Fund through the Balearic Islands ESF operational program for 2013-2017. JJR acknowledges funding from the Ramón y Cajal program of MINECO.
References
- [1] T. Piketty. Capital in the Twenty-First Century. Harvard University Press, Cambridge, MA, USA, 2014.
- [2] J. E. Stiglitz. The Great Divide: Unequal Societies and What We Can Do About Them. W. W. Norton & Company, New York, 1 edition edition, 2015.
- [3] J.-L. Pinol. Histoire de l’Europe urbaine. Seuil, Paris, France, 2003.
- [4] W. Goldsmith, E. J. Blakely, and B. Clinton. Separate Societies: Poverty and Inequality in U.S. Cities, 2nd Edition. Temple University Press, Philadelphia, Pa, 2nd edition edition, 2010.
- [5] T. Cassiers and C. Kesteloot. Socio-spatial Inequalities and Social Cohesion in European Cities. Urban Studies, 49(9):1909–1924, 2012.
- [6] UN-HABITAT. State of African Cities Re-imagining sustainable urban transitions. State of Cities - Regional Reports. UN-Habitat, 2014.
- [7] J. Friedrichs, G. Galster, and S. Musterd. Neighbourhood effects on social opportunities: the European and American research and policy context. Housing Studies, 18(6):797–806, 2003.
- [8] Judith R. Blau and Peter M. Blau. Cost of Inequality - Metropolitan Structure and Violent Crime. American Sociological Review, 47:114–129, 1982.
- [9] Jeanne Brooks-Gunn, Greg Duncan, and J. Lawrence Aber, editors. Neighborhood Poverty, Volume 1: Context and Consequences for Children. Russell Sage Foundation, New York, 1997.
- [10] J. Vallée, E. Cadot, F. Grillo, I. Parizot, and P. Chauvin. The combined effects of activity space and neighbourhood of residence on participation in preventive health-care activities: The case of cervical screening in the Paris metropolitan area (France). Health & Place, 16(5):838–852, 2010.
- [11] B. Womack. Across 110th street. United Artists, 1972.
- [12] R. Chetty and N. Hendren. The Impacts of Neighborhoods on Intergenerational Mobility: Childhood Exposure Effects and County-Level Estimates. Technical report, Harvard Univ. Dept. of Economics, 2015.
- [13] K. Lewis. Three fallacies of digital footprints. Big Data & Society, 2(2):2053951715602496, 2015.
- [14] Y.-A. de Montjoye, L. Radaelli, V. K. Singh, and A. Pentland. Unique in the shopping mall: On the reidentifiability of credit card metadata. Science, 347(6221):536–539, 2015.
- [15] D. Lazer, A. Pentland, L. Adamic, S. Aral, A.-L. Barabási, D. Brewer, N. Christakis, N. Contractor, J. Fowler, M. Gutmann, T. Jebara, G. King, M. Macy, D. Roy, and M. V. Alstyne. Computational Social Science. Science, 323(5915):721–723, 2009.
- [16] N. Eagle, M. Macy, and R. Claxton. Network Diversity and Economic Development. Science, 328(5981):1029–1031, 2010.
- [17] J.-P. Onnela, J. Saramäki, J. Hyvönen, G. Szabó, D. Lazer, K. Kaski, J. Kertész, and A.-L. Barabási. Structure and tie strengths in mobile communication networks. Proceedings of the National Academy of Sciences, 104(18):7332–7336, 2007.
- [18] X. Lu, L. Bengtsson, and P. Holme. Predictability of population displacement after the 2010 Haiti earthquake. Proceedings of the National Academy of Sciences, 109(29):11576–11581, 2012.
- [19] L. Sun, K. W. Axhausen, D.-H. Lee, and X. Huang. Understanding metropolitan patterns of daily encounters. Proceedings of the National Academy of Sciences, 110(34):13774–13779, 2013.
- [20] M. C. González, C. A. Hidalgo, and A.-L. Barabási. Understanding individual human mobility patterns. Nature, 453(7196):779–782, 2008.
- [21] D. McLaren and J. Agyeman. Sharing Cities: A Case for Truly Smart and Sustainable Cities. Urban and Industrial Environments. MIT Press, Cambridge, MA, USA, 2015.
- [22] W. Ostendorf, S. Musterd, and S. De Vos. Social Mix and the Neighbourhood Effect. Policy Ambitions and Empirical Evidence. Housing Studies, 16(3):371–380, 2001.
- [23] D. Satterthwaite and D. Mitlin. Reducing Urban Poverty in the Global South. Routledge, London ; New York, 2013.
- [24] R. Kanbur and A. J. Venables. Spatial Inequality and Development. Oxford University Press, 2005.
- [25] The American Association of State Highways and Transportation Officials (AASHTO). Commuting in America 2013, the national report on commuting patterns and trends. Technical report.
- [26] K. Miciukiewicz and G. Vigar. Mobility and Social Cohesion in the Splintered City: Challenging Technocentric Transport Research and Policy-making Practices. Urban Studies, 49(9):1941–1957, 2012.
- [27] J.-F. Ruault. L’effet de la consommation de passage sur le développement et l’intégration métropolitaine des territoires en Ile-de-France. Paris Est, 2014.
- [28] Elena Alfaro Martinez, Maria Hernandez Rubio, Roberto Maestre Martinez, Juan Murillo Arias, Dario Patane, Amanda Zerbe, Robert Kirkpatrick, Miguel Luengo-Oroz, and Amanda Zerbe. Measuring Economic Resilience to Natural Disasters with Big Economic Transaction Data. arXiv:1609.09340 [cs], 2016. arXiv: 1609.09340.
- [29] Yuji Yoshimura, Stanislav Sobolevsky, Juan N. Bautista Hobin, Carlo Ratti, and Josep Blat. Urban association rules: uncovering linked trips for shopping behavior. arXiv:1610.00187 [physics], 2016.
- [30] M. Lenormand, T. Louail, O. G. Cantú-Ros, M. Picornell, R. Herranz, J. Murillo Arias, M. Barthelemy, M. San Miguel, and J. J. Ramasco. Influence of sociodemographics on human mobility. Scientific Reports, 5:10075, 2015.
- [31] W. W. Recker and L. P. Kostyniuk. Factors influencing destination choice for the urban grocery shopping trip. Transportation, 7(1):19–33, 1978.
- [32] R. Gallotti, A. Bazzani, S. Rambaldi, and M. Barthelemy. A stochastic model of randomly accelerated walkers for human mobility. arXiv:1509.03752 [cond-mat, physics:physics], 2015.
- [33] C. M. Schneider, V. Belik, T. Couronné, Z. Smoreda, and M. C. González. Unravelling daily human mobility motifs. Journal of The Royal Society Interface, 10(84):20130246, 2013.
- [34] G. M. Robinson and A. D. Read. Recycling behaviour in a London Borough: Results from large-scale household surveys. Resources, Conservation and Recycling, 45(1):70–83, 2005.
- [35] J. Dill and T. Carr. Bicycle Commuting and Facilities in Major U.S. Cities: If You Build Them, Commuters Will Use Them. Transportation Research Record: Journal of the Transportation Research Board, 1828:116–123, 2003.
- [36] Instituto Nacional de Estadística (National Institute for Statistics). Available: http://www.ine.es. Accessed 2016 April 26.
Appendix
Data preprocessing
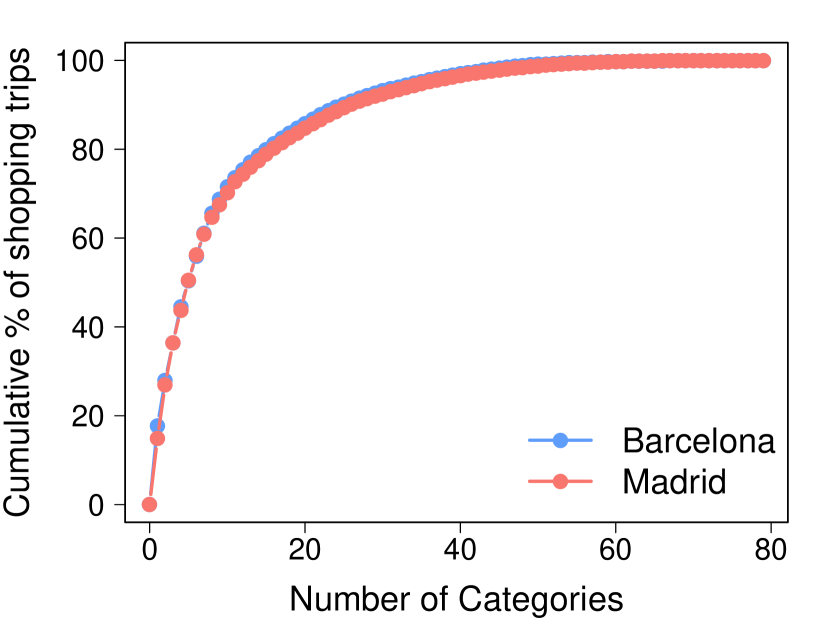
The dataset contains information about million bank card transactions made by customers of the Banco Bilbao Vizcaya Argentaria (BBVA) in the metropolitan areas of Barcelona and Madrid in . For both case studies, we only consider the credit card payments whose amount was inferior to euros, and which were made inside the metropolitan areas, by bank customers that lived and worked in the metropolitan area in . Each transaction is characterized by its amount (in euro currency) and the time when the transaction has occurred. Each transaction is also linked to a customer and a business. Customers are identified with an anonymized customer ID, connected with sociodemographic characteristics (gender, age and occupation) and their postcode of residence. In the same way, businesses are identified through an anonymized business ID, a business category id, and the geographical coordinates of the credit card terminal. Since we are primarily interested in daily shopping mobility, we chose to consider the business categories that account for the top 90% of the daily shopping trips (see Figure S1). The proportions of shopping trips associated to each of the business categories we selected are available in Table S1.
| Category | Barcelona | Madrid |
|---|---|---|
| Supermarket | 17.71 | 14.84 |
| Hypermarket | 10.25 | 12.09 |
| Gas Stations | 8.41 | 9.49 |
| Restaurants | 8.20 | 6.73 |
| Retail store | 5.84 | 2.82 |
| Clothing store chain | 5.48 | 4.67 |
| Clothing store | 5.16 | 7.33 |
| Pharmacy, optical and orthopedics | 4.52 | 3.81 |
| Department store | 3.14 | 5.73 |
| Hair and beauty | 2.88 | 2.72 |
| Electronics, computers and appliances | 1.97 | 1.44 |
| Bars and café | 1.85 | 1.60 |
| Shoe store | 1.71 | 1.43 |
| Toys and sports articles | 1.43 | 1.33 |
| Bookshop, music shop and stationery | 1.42 | 1.04 |
| Fast food restaurants and chains | 1.13 | 2.38 |
| Car dealership and garage | 1.02 | 1.01 |
| Bazaar | 1.01 | 1.06 |
| DIY store | 0.99 | 1.08 |
| Hospitals, clinics and doctors | 0.91 | 0.88 |
Formal description of the rewiring process
From the data we extract the bipartite network of all credit card transactions performed by the city residents in businesses located in the city, during the entire year. is the set of residents, the set of businesses and the set of transactions. Table S2 contains the characteristic attributes of the network in the two cities studied. Each city is partitioned in spatial units/neighborhoods (here the units correspond to zip codes) and the network is spatial: each resident and each business is located in one neighborhood. We denote (resp. ) the set of residents (resp. businesses) located in the neighborhood . The sets are disjointed and we have and , with . Additionally the businesses are also partitioned in categories according to the products they sell, and we have . The edges of the network represent the card transactions, hence implicitly the shopping trips. We note the k-th transaction performed by resident in business , and by its amount.
| Statistics | Barcelona | Madrid |
|---|---|---|
| Number of neighborhoods | 97 | 123 |
| Number of inhabitants (2009) | 3,218,071 | 5,512,495 |
| Area (km2) | 634 | 1,935 |
| Number of customers | 42,023 | 118,447 |
| Number of businesses | 40,618 | 55,148 |
| Number of transactions | 3,640,961 | 10,025,642 |
The rewiring methods we implemented operate directly at the micro scale of the individual transactions, and each rewiring operation consists in selecting a business , such than and are of the same category but are located in different neighborhoods. The rewiring occurs only if fulfills a number of additional constraints which are expressed at the macro-scale of the entire city.
The network is rewired iteratively, i.e. transaction per transaction. A transaction is picked up randomly (uniform or weighted sampling, as described in the main text). A neighborhood is chosen among the set of all neighborhoods that contain some businesses of the same category than . Both the transaction and the candidate business can be picked up through a uniform or weighted random sampling. Finally, if the neighborhood change matches the four constraints, then the transaction/edge is rewired. The process stops when the rewiring rate falls below .
Estimation of shopping trips distances and identification of the users’ main daytime activity location
We made the assumption that to each transaction is implicitly associated a trip originating from either the main activity neighborhood during working time, or the neighborhood of residence, depending on the hour of the day and day of the week. The shopping trip distance is then defined as the Euclidean distance between the centroids of the origin and destination neighborhoods.
We already know the neighborhood of residence that we can assign as the place of main activity during night time (i.e between 7pm and 8am) on week days and Saturday and Sunday. In addition to the neighborhood of residence, for each individual we can determine the neighborhood in which he/she was the most frequently located during the typical working hours of working days, i.e. from 8pm to 7am, from Monday to Friday.
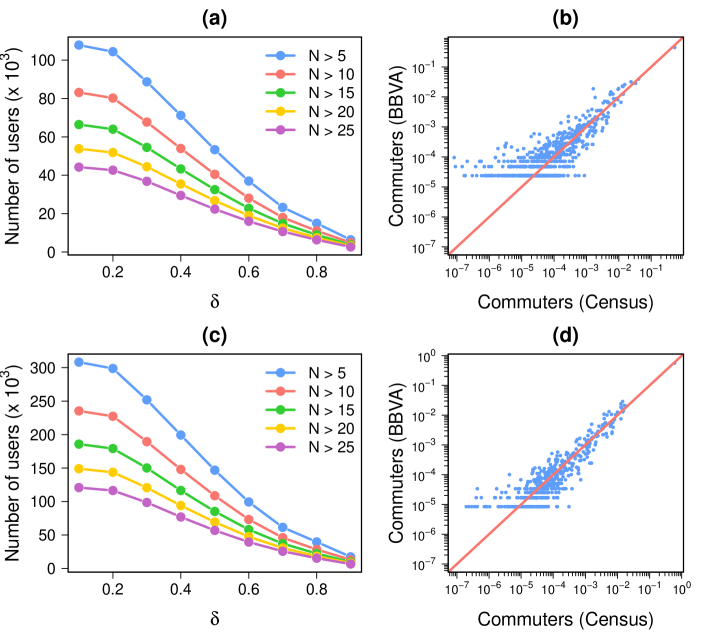
To do so, for each individual we count the number of unique couples during which he/she was located in each neighborhood. For our study we keep only the individuals for which credit card is a casual mode of payment, and for which we can then reasonably assume that their card purchases and corresponding shopping trips are representative of their shopping mobility in general. Regarding the available statistics for Spain on the share of credit card payments among all payments, we decided to keep individuals whose data displayed at least unique couples during the entire year. For each of these individuals, we then determine the neighborhood in which they were the most frequently located during typical working hours. If this neighborhood accounted for less than one third of the time in his/her entire set of locations, then the individual is discarded. As it can be seen in Figure S3a and Figure S3c, the couple of value allow us to keep enough users and discard the users not showing enough regularity to estimate their main daytime activity location.
Finally, we can estimate the commuting flows between neighborhoods and assess the accuracy of the results by comparing these flows with those obtained from the 2011 Spanish census in Barcelona and Madrid 111Instituto Nacional de Estadística (National Institute for Statistics). Available: http://www.ine.es. Accessed 2016 April 26.. The census data is at the municipal level, which implies that the neighborhoods must be aggregated at the municipality scale to be able to perform the comparative analysis. Figure S3b and Figure S3d show a scattered plot with the comparison between the flows obtained with the two matrices. A good agreement between the two ODs is obtained.
The source code of this method is available at https://github.com/maximelenormand/Most-frequented-locations.
Supplementary figures