On the limits of measuring the bulge and disk properties of local and high-redshift massive galaxies
Abstract
A considerable fraction of the massive quiescent galaxies at z 2, which are known to be much more compact than galaxies of comparable mass today, appear to have a disk. How well can we measure the bulge and disk properties of these systems? We simulate two-component model galaxies in order to systematically quantify the effects of non-homology in structures and the methods employed. We employ empirical scaling relations to produce realistic-looking local galaxies with a uniform and wide range of bulge-to-total ratios (), and then rescale them to mimic the signal-to-noise ratios and sizes of observed galaxies at z 2. This provides the most complete set of simulations to date for which we can examine the robustness of two-component decomposition of compact disk galaxies at different . We confirm that the size of these massive, compact galaxies can be measured robustly using a single Sérsic fit. We can measure accurately without imposing any constraints on the light profile shape of the bulge, but, due to the small angular sizes of bulges at high redshift, their detailed properties can only be recovered for galaxies with 0.2. The disk component, by contrast, can be measured with little difficulty.
Subject headings:
galaxies: spiral and lenticular, cD — galaxies: formation — galaxies: photometry — galaxies: structure — galaxies: surveys1. Introduction
Discovery of compact, red massive galaxies at z 2 (e.g., Franx et al. 2003; Daddi et al. 2005; Kriek et al. 2006) have opened a new door for improving the current models of galaxy formation and evolution (e.g., Wuyts et al. 2010; Oser et al. 2012; Ishibashi et al. 2013; Dekel & Burkert 2014). Several studies have confirmed the compactness of these galaxies (e.g., Daddi et al. 2005; Toft et al. 2007; Trujillo et al. 2007; Buitrago et al. 2008; Cimatti et al. 2008; Franx et al. 2008; van der Wel et al. 2008; van Dokkum et al. 2008; Damjanov et al. 2009; Hopkins et al. 2009; Cassata et al. 2010, 2011; Mancini et al. 2010; Newman et al. 2012; Szomoru et al. 2012; Barro et al. 2013; Huang et al. 2013b; Williams et al. 2014). These “red nuggets,” while common at z 2, are rare in the local universe, thus implies a considerable size increase (3 – 4 times) in the last 10 billion years (van Dokkum et al. 2008; Trujillo et al. 2009; Taylor et al. 2010; van Dokkum & Brammer 2010; but see Saracco et al. 2010; Valentinuzzi et al. 2010; Ichikawa et al. 2012; Poggianti et al. 2013). Red nuggets are found to be as compact as kpc, which is comparable to the size of the Hubble Space Telescope (HST) point-spread function (PSF). This raises the concern that the size and mass measurements of these galaxies are subject to potential uncertainties (Hopkins et al. 2009; Muzzin et al. 2009).
Besides the small size of the red nuggets, at least a considerable fraction of them are found to have a disk, which imposes a further challenge to our paradigm of galaxy evolution. Van der Wel et al. (2011) claim that more than 50 of the population of massive quiescent galaxies at z 2 are disk-dominated. Chang et al. (2013), by deprojecting the observed axial ratios of the galaxies in their sample, show that early-type galaxies at z 1 are, on average, flatter than their counterparts at z 1. Furthermore, they claim that the median projected axis ratio at a fixed mass decreases with redshift, which hints at the prevalence of disks at higher redshifts. Patel et al. (2013) find that their sample of quiescent massive galaxies at higher redshifts have lower axial ratios () and concluded that the stars in the progenitors of today’s 2 galaxies were distributed in disks at z 3. Bruce et al. (2014) show that within the redshift interval 1 z 3 most massive galaxies are morphologically composite systems containing both a bulge and a disk component. More than 80 of their sample require a disk component to properly fit their light distribution. Aside from the observational evidence of the prevalence of disks among the most massive galaxies at high redshift, cosmological simulations predict the formation of massive disk galaxies at these epochs. The compactness of red nuggets indicates that these galaxies have experienced severe dissipation during their formation. One plausible scenario is that the red nuggets are the end result of major gas-rich mergers. Robertson et al. (2006) find that nearly all their simulated gas-rich merger remnants contain rapidly rotating stellar substructure, while disk-dominated remnants are restricted to form in mergers that are gas-dominated at the time of final coalescence. They show that the formation of rotationally supported stellar systems in mergers is not restricted to idealized orbits, and both gas-rich major and minor mergers can produce disk-dominated stellar remnants. Their findings can be especially important for galaxy formation at high redshifts, where gas-dominated mergers are common.
Measuring the bulge and disk properties, and subsequently the luminosity bulge-to-total ratio (), of galaxies obviously can reveal key properties and clues to formation and evolutionary paths that may be obscured by studying a bulge+disk galaxy as a single system. Several factors can affect the reliability of bulge-disk decomposition, including how the fitting pipeline is employed, the galaxy brightness [signal-to-noise ratio ()], cosmological surface brightness dimming, and the effect of the PSF. One of the best ways for quantifying the influence of these factors is through galaxy simulations (e.g., Trujillo et al. 2007, Cimatti et al. 2008, Mancini et al. 2010, Szomoru et al. 2010, 2012, van Dokkum & Brammer 2010, Williams et al. 2010, Papovich et al. 2012, van der Wel et al. 2012, and Davari et al. 2014 for high-z galaxies, and Häussler et al. 2007 and Meert et al. 2013 for low-z galaxies).
This work employs well-tested properties and scaling relations of local galaxies to generate mock bulge+disk galaxies with a uniform and wide range of . This provides the most complete set of simulations to date that allows us to examine the robustness of two-component decomposition of disk galaxies at different values. Although our model bulge+disk galaxies do not capture the full observed complexity of local disk galaxies (e.g., Gadotti 2009; Kormendy & Barentine 2010), recent zoom-in cosmological simulations find that galaxies with bars and spiral structures are rare at (Kraljic et al. 2012). If higher redshift bulges and disks resemble their local counterparts, the results of our rescaled model galaxies can be used as a yardstick for examining the robustness of these types of analysis for higher redshift galaxies. We address three key questions:
1) How well can single-component fitting of bulge+disk galaxies measure the global size and total luminosity of these galaxies?
2) Can we recover the properties of both the bulge and disk components, and if so, how well?
3) What are the best methods for measuring the of composite galaxies? And what are the potential biases of different bulge-disk fitting methods?
This paper is organized as follows. In Section 2, the details of the galaxy simulations are provided. The main results are presented in Section 3. Comparison with similar studies is done in Section 4. In Section 5, implications of our results for red nuggets are discussed, and a summary is listed in Section 6. Results are based on a standard cosmology ( = 71 , = 0.27, and = 0.73) and AB magnitudes.
2. Method
2.1. Technique
GALFIT 3.0 (Peng et al. 2010) is utilized for our simulations. GALFIT is used extensively for modeling the light profiles of galaxies. It provides several commonly used functions in the astronomical literature. For our applications, we only use the Sérsic (1968) function to model the surface brightness profiles:
| (1) |
where is the effective radius of the galaxy, is the surface brightness at , the Sérsic index describes the profile shape, and the parameter is closely connected to (Ciotti 1991). The special cases of the Sérsic profile are the exponential profile (n = 1; Freeman 1970) and the law (n = 4; de Vaucouleurs 1948), which are commonly observed in spiral and elliptical galaxies, respectively. This suggests that the Sérsic index can be used as a yardstick for distinguishing the disk-dominated from the bulge-dominated galaxies (e.g., Blanton et al. 2003; Shen et al. 2003; Bell et al. 2004; Hogg et al. 2004; Ravindranath et al. 2004; Barden et al. 2005; McIntosh et al. 2005; Fisher & Drory 2008).
2.2. Simulated Model Galaxies
We aim to simulate galaxies that resemble real, observed disk galaxies. Toward this goal, we use empirical scaling relations and other empirical constraints derived from observations of nearby galaxies as inputs to create the model galaxies. Although these constraints reduce the generality of our simulated sample, they provide us with simulated galaxies that exhibit realistic values of bulge and disk component parameters.
The well-known Kormendy relation (Kormendy 1977; Hamabe & Kormendy 1987), a projection of the galaxy fundamental plane (Djorgovski & Davis 1987; Dressler et al. 1987), reveals that elliptical galaxies and classical bulges follow a correlation between effective surface brightness () and effective radius (). The Kormendy relation indicates that larger elliptical galaxies and classical bulges have lower densities. Since brighter galaxies are bigger, a more general statement is that more luminous systems are fluffier. The Kormendy relation, which has played an important role in the study of the formation and evolution of galaxies, has been studied in different bands (e.g., La Barbera et al. 2010), environments (e.g., Nigoche-Netro et al. 2007), redshifts (e.g., La Barbera et al. 2003; Longhetti et al. 2007), and magnitude ranges (Nigoche-Netro et al. 2008).
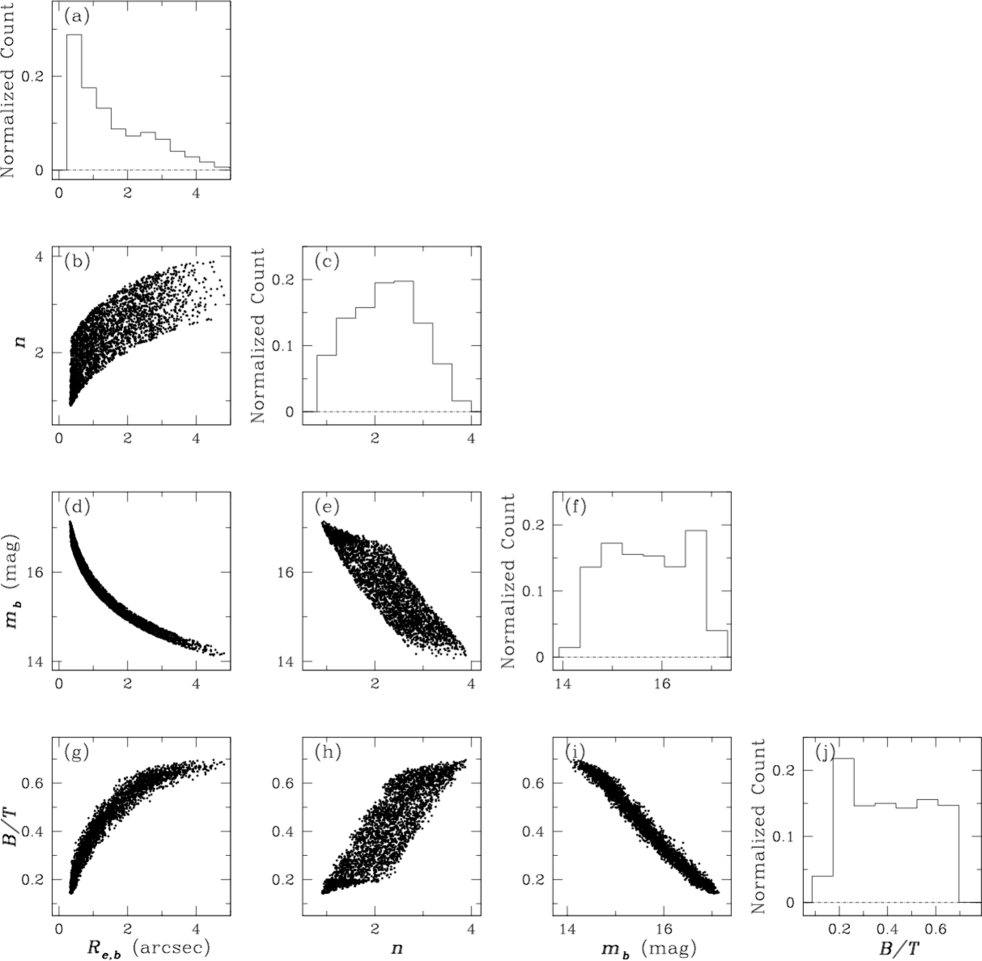
Our simulated images of fiducial local () galaxies will be designed to mimic Sloan Digital Sky Survey (SDSS; York et al. 2000; Stoughton et al. 2002) images taken in the band. Using the -band Kormendy relation of (Hamabe & Kormendy, 1987) and assuming for E/S0 galaxies (Fukugita et al. 1995), our simulated bulges follow
| (2) |
where is expressed in Kpc and in mag (Fig. 1d).
The simulated disk component follows the exponential light profile (Freeman 1970). On the other hand, the Sérsic indices (Sérsic 1968) of bulges correlate with their total luminosity (Fisher & Drory 2008; Graham & Worley 2008; Laurikainen et al. 2010). Using Equation 17 of Graham & Worley (2008), which is given in the band, we assume (appropriate for Sab galaxies; Fukugita et al. 1995) to obtain
![[Uncaptioned image]](/html/1604.08331/assets/x6.png)
![[Uncaptioned image]](/html/1604.08331/assets/x7.png)
![[Uncaptioned image]](/html/1604.08331/assets/x10.png)
![[Uncaptioned image]](/html/1604.08331/assets/x11.png)
| (3) |
where is the absolute -band magnitude (Fig. 1h).
There are number of definitions of pseudo-bulges. Gadotti (2009) claims that “pseudo-bulges can be distinguished from classical bulges as outliers in the Kormendy relation.” Based on the fact that our simulated bulges follow the Kormendy relation, one might say that pseudo-bulges are not included in our sample. However, Fisher & Drory (2008) argue that the main structural difference between pseudo and classical bulges is that the former has lower Sersic indices. Without meaning to favor one definition over another, according to Fisher & Drory (2008) definition, pseudo-bulges are present in our simulated sample. Definitions aside, as a prelude to the results, one can infer how well bulges can be fit (pseudo or not) regardless of the relation they follow because the accuracy of recovery can be summarized from direct measurables alone: luminosity, size, and ratio. In short, if pseudo-bulges span a range that is lower in , lower in angular resolution, and lower in than our simulations, then they would not be easily recovered at high-z, independent of which physical relations they follow.
The ellipticity, , of bulges have a Gaussian distribution that peaks around 0.2 (Fathi et al. 2003), whereas disks, as a result of different inclination angles, have (Ryden 2006). We assume disks and bulges have random orientations (position angles).
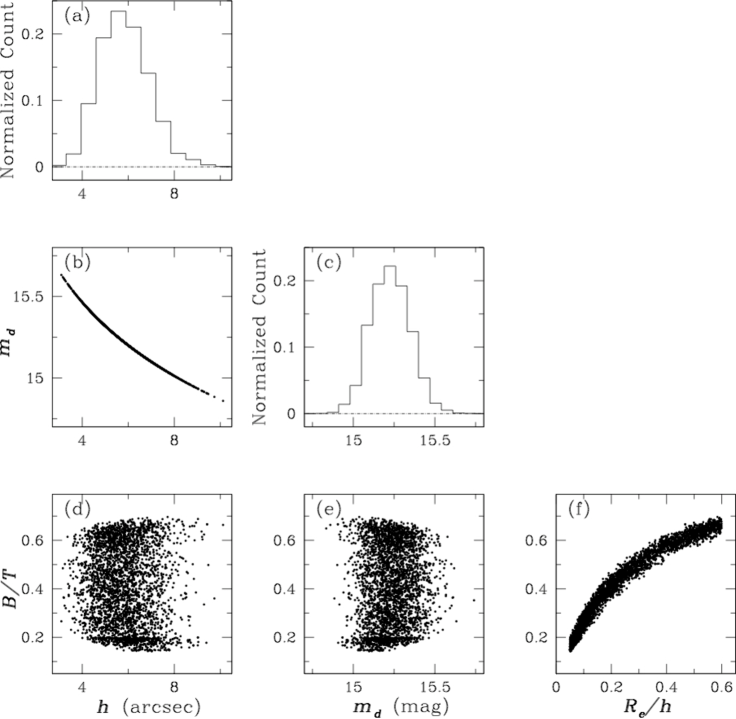
The simulated disks have a Gaussian distribution of central surface brightness, with a mean and standard deviation of mag (Gadotti 2009).
These initial conditions lead to a sample of model galaxies with 0.1 0.7, with the majority of the objects having 0.25 0.5. There are more than 500 galaxies in each of the following bins of : 0.2, 0.2–0.3, 0.4–0.3, 0.4–0.5, 0.5–0.6, and 0.6. This produces bulges with 0.4′′–5′′ (1–12 pixels) and disks with 3.5′′–10′′(9–25 pixels). In this paper, the analyzed effective radii are circularized effective radii, ; the same applies to the disk scale lengths. Figures 1 and 2 show the properties of the simulated bulges and disks. Figure 2f shows that galaxies with the smallest have the lowest , in agreement with previous studies (e.g., MacArthur et al. 2003; Fisher & Drory 2008).
For this analysis, the sky backgrounds are simulated. Local and high-z simulated backgrounds have identical gain, pixel scale, magnitude zero point, and average noise levels as in the SDSS and CANDELS mosaic images, respectively. To obtain a robust determination of the sky background, the size of the simulated images should be at least 15 times larger than the effective radius of the galaxy (Yoon et al. 2011; Huang et al. 2013a). As the simulated images are meant to resemble SDSS data, the pixel scale is set to 0.396′′, and the zero point of the images is set to 25 mag, typical for the SDSS band111http://www.sdss.org/dr7/algorithms/fluxcal.html. We convolve the simulated images with an empirical PSF constructed by stacking 30 bright stars selected from SDSS -band images.
is a key factor for the robustness of morphological analysis. Considering the fact that galaxies are extended objects, we use the within the effective radius rather than the total . We define
| (4) |
where is the area within the effective radius and is the sum of all possible sources of noise, including dark current, readout noise, and shot noise from the sky.
For each model galaxy, we generate 10 images with different noise levels over the range 100 10000; the values are uniformly distributed in logarithmic space. In total, we generate more than 5000 images in each bin, and more than 30,000 over the whole range of . For the typical noise level and exposure time of SDSS images, the above range of values corresponds to simulated galaxies with .
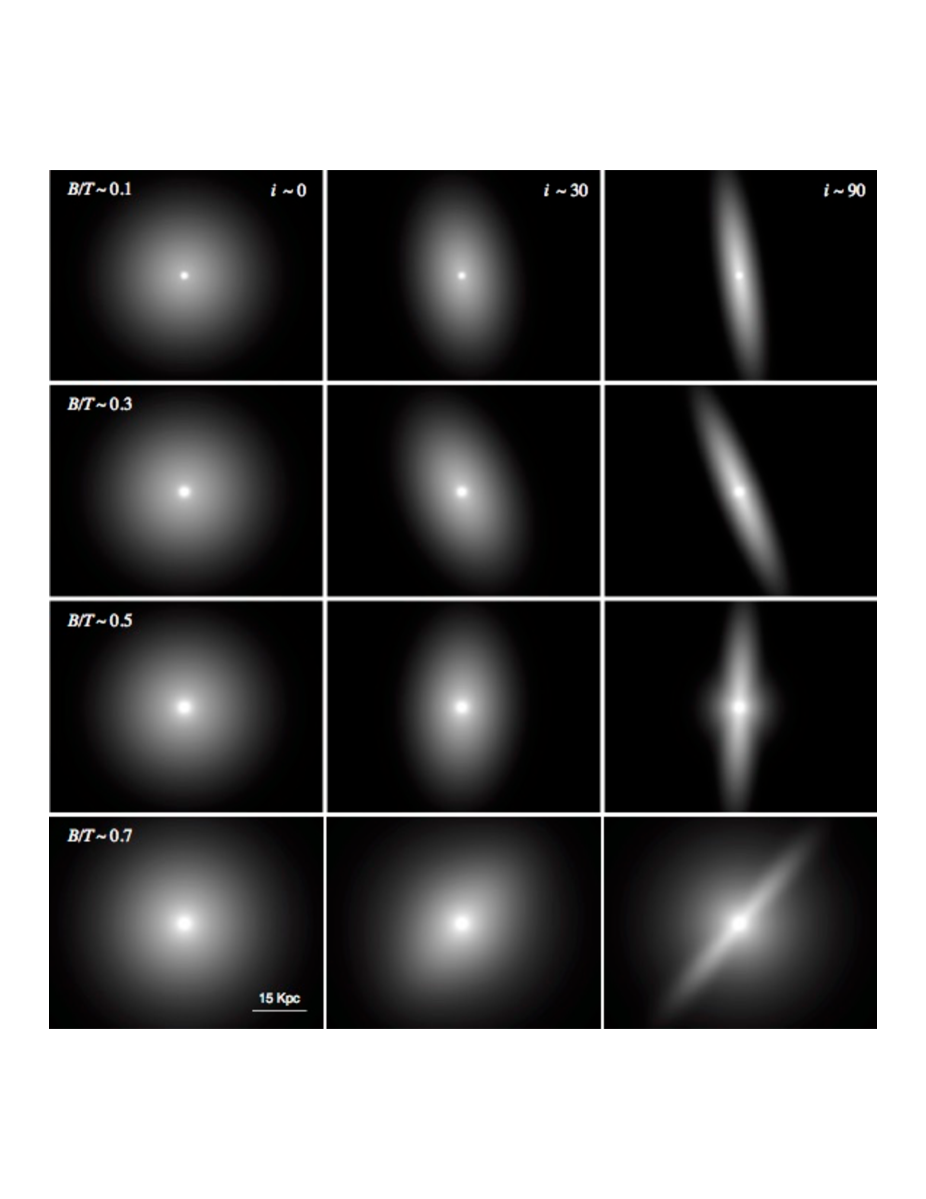
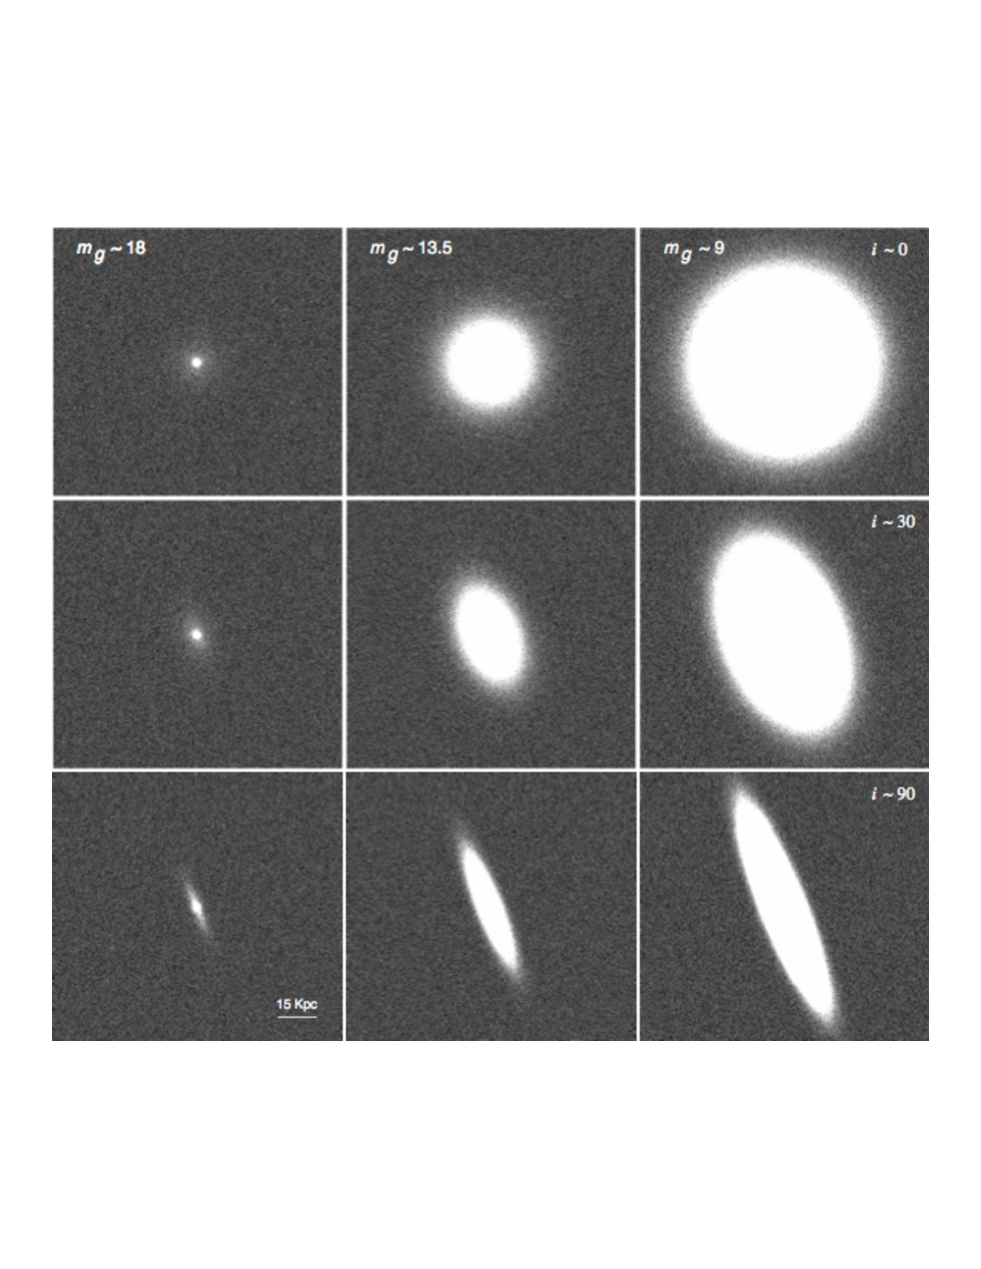
Figure 3 shows simulated disk galaxies with four different values of and three inclination angles. Figure 4 gives an example of a simulated galaxy with at three different levels of , which correspond to 18, 13.5, and 9 mag, and three inclination angles. Objects with low look like compact galaxies due to the missing light in the outer part of the disk.
One of the main goals of this paper is to examine the reliability of model fits of high-redshift massive galaxies using one or two Sérsic components. These high-redshift galaxies are generally smaller than local galaxies, have been observed at lower , and have been subject to surface brightness dimming. We simply rescale the size and as if the local galaxies are observed at z 2 without taking the size evolution or stellar population evolution into account. This leads to simulated galaxies with bulges with 0.02′′ 0.25′′ (0.3–4 pixels) and disks with 0.17′′ 0.5′′ (3–8 pixels). The rescaled model galaxies are simulated at 10 1000 (uniformly distributed in logarithmic space), and their images mimic the properties of the CANDELS222http://candels.ucolick.org/ (Grogin et al. 2011; Koekemoer et al. 2011) UDS (UKIDSS Ultra-Deep Survey; Lawrence et al. 2007) mosaic image. For images with the noise level of those acquired using HST’s Wide Field Camera 3 (WFC3) in the filter (Koekemoer et al. 2011), this range of for the rescaled model galaxies is equivalent to galaxies with observed for one orbit with the HST. Note that our simulated magnitudes covers a range well below the detection limit of high-redshift studies in near-infrared (including CANDELS) and thus provides the chance to detect the levels at which reliable morphological measurements can be achieved. The simulated images are convolved with the hybrid PSF from CANDELS UDS (van der Wel et al. 2012).
Once the galaxies are simulated, we fit each of them in two ways: (1) single Sérsic component plus a sky component and (2) a Sérsic component (to represent a bulge), an exponential component (to represent a disk), and a sky component. The sky component is fitted as a plane with a constant slope, to correct for any residual non-flatness, to first order, for all the following analysis. All parameters are left free (including the sky component parameters) except when the disk or/and bulge Sérsic index is fixed. Besides, no constraint file (for limiting the parameter space) is used for GALFIT fits .
3. Results
3.1. Fitting Disk Galaxies with Single Sérsic Component
In order to quantify the reliability of our model fits, we need to determine the intrinsic size of a simulated galaxy. Davari et al. 2014 (their Fig. 3) show that this can be done robustly by using IRAF/ellipse (Jedrzejewski 1987) and constructing the galaxy curve-of-growth on the input, noiseless images.
3.1.1 Local Galaxies
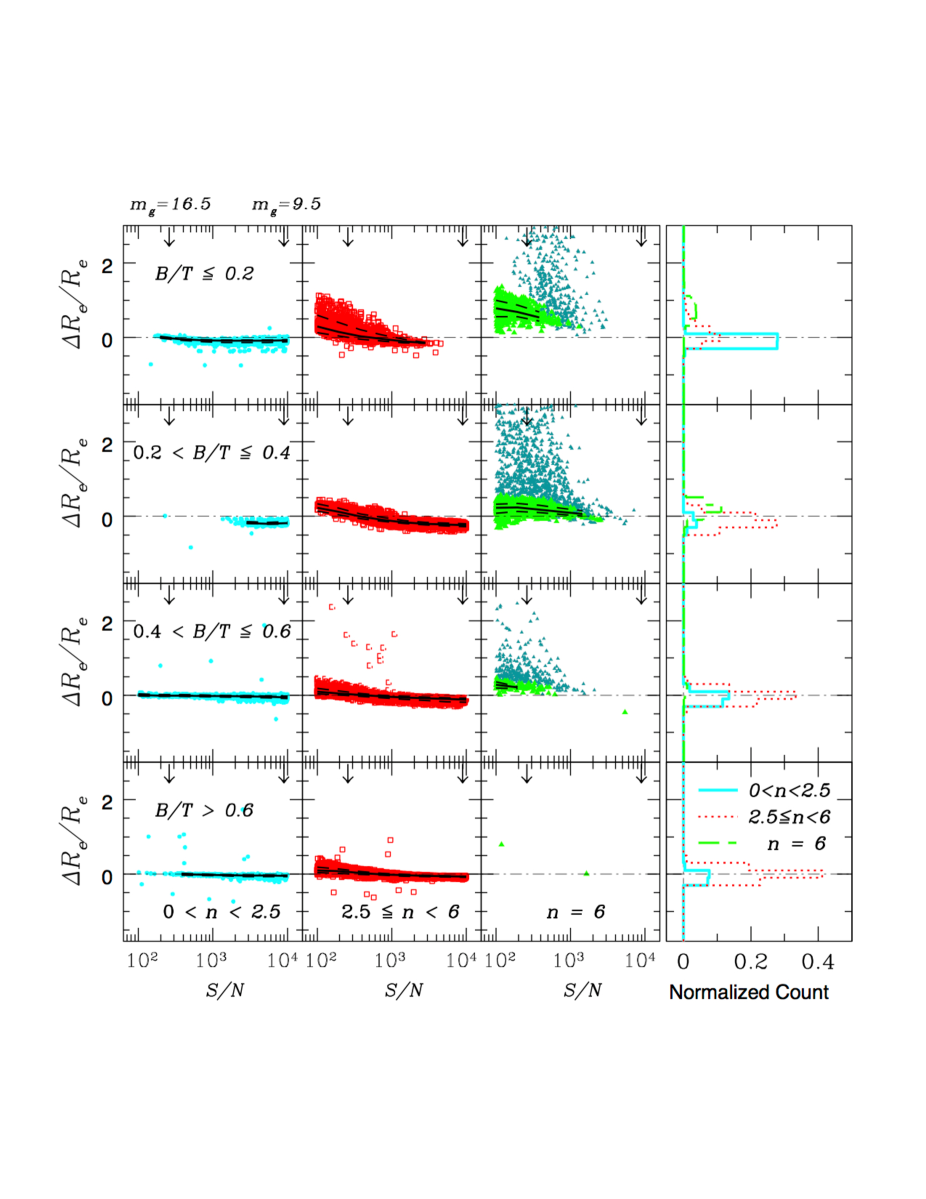
We first discuss the results for single-component fits, the method most widely adopted in the literature to obtain the total luminosity and basic structural parameters of galaxies. Figure 5 shows the difference between actual and measured effective radii as a function of , for more than 30,000 model galaxies. The horizontal panels give the results at a given , while the vertical panels give the results for different values of the Sérsic index .
As shown by Davari et al. (2014), the fits with 6 are generally unreliable. This comes from the fact that Sérsic profiles with 4 have a long tail, which can be confused by the background signal and its associated noise. This generally causes overestimation of the total flux and size of a galaxy. We refit these galaxies with 6 by fixing to 6, to minimize potential biases caused by these unreliable fits. Comparing dark and light green points in Figure 5 demonstrates the significant improvement in the size determination for best-fit models with high Sérsic indices. All the reported results allow the sky component to be free. However, when =6 is forced, the sky value naturally has to increase to compensate for the lower index value. The increase in the sky value, however, is not necessarily large. For large Sérsic indices ( 4) it is typical that a small change in sky value can produce a large swing in the index value.
We note that fixing to different values leads to different biases for galaxies at different range. For example, fixing to 2.5 will reduce biases for galaxies with 0.2 0.4. However, when grows larger than 4, it is common to hold it fixed to 4. For our sample disky galaxies, holding fixed to 4 should reduce the systematics compared to =6, but the differences are not large.
Dependence of Fitted Sérsic Indices
The histograms in Figure 5 show that the fraction of best-fit models with 2.5 6 is higher for model galaxies with higher . This is expected, as previous studies have shown that the light distributions of later type galaxies resemble exponential disks ( = 1), whereas bulge-dominated galaxies have light distributions close to = 4 (Graham & Worley 2008). On the other hand, higher background noise level affects the model galaxies with smaller the most. This is evidenced by the fraction of single-component fits that yield high Sérsic indices (). As mentioned above, fits with are generally unreliable and can lead to significant systematic offsets. This, in part, comes from the fact that Sérsic profiles with large , which have a steep central part and a long tail at large radii, are very sensitive to changes in the central and outermost parts of the galaxy. The fraction of galaxies with are 15, 25, 2, and 1 for galaxies with , 0.2–0.4, 0.4–0.6, and , respectively.
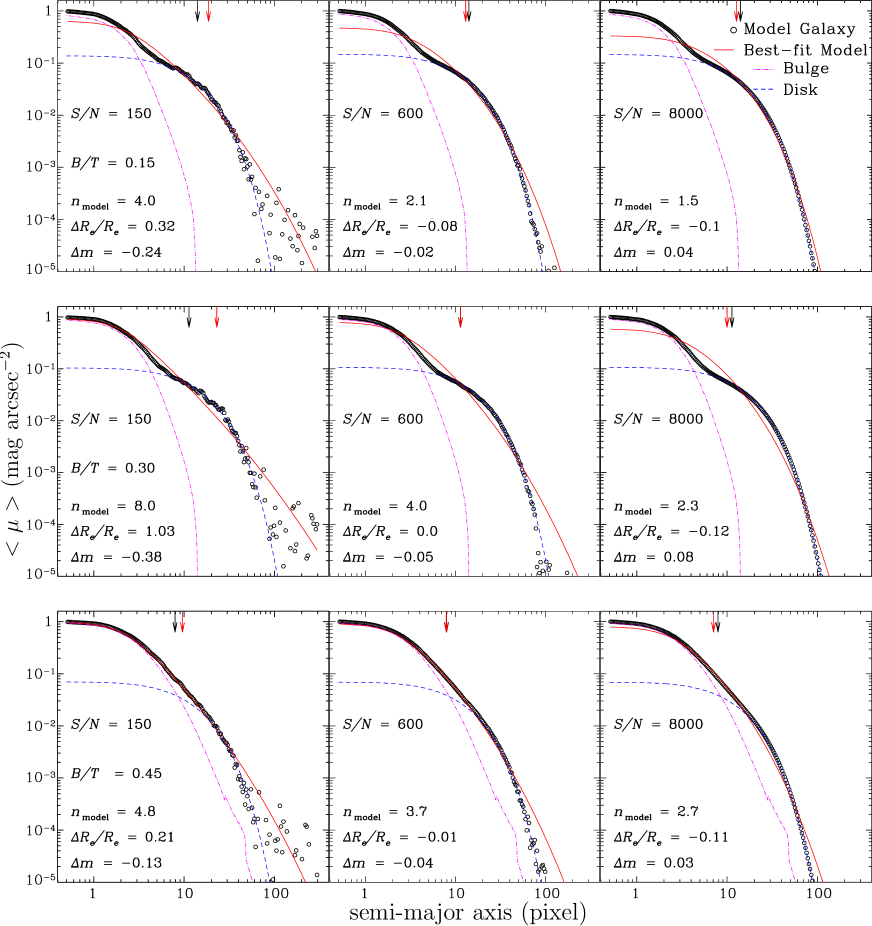
Dependence of Systematics
The higher fraction of unreliable fits at lower for model galaxies with is due to their morphological properties. This is demonstrated in Figure 6, which illustrates the effects of on the reliability of the fits. Light distributions of model galaxies with = 0.15, 0.30, and 0.45 are shown at three different values of . For model galaxies with 0.4 a considerable fraction of the flux resides in the disk, which leads to systematic profile deviations in the outskirts. Figure 6 shows that this effect is stronger for galaxies with 0.2 0.4. Lower leads to a situation where random noise dominates over systematic profile deviations in the outskirts. As the contribution of between the outer and inner region is asymmetric, it is generally difficult to know a priori how the Sérsic index would behave when fitting a single-component profile to a multi-component model. Our simulations show that the presence of a small bulge (lower ) preferentially leads to relatively larger biases in size and luminosity using a single-component fit. Only in the largest and the highest does the fit have a (slightly) opposite effect. In model galaxies with , the prominence of the bulge reduces the contribution of the disk to the overall light distribution. The bottom left panel shows that even at very low GALFIT can still reliably measure the size and total luminosity of the model galaxy. This is in agreement with Davari et al. (2014), who find that single-component fits of early-type galaxies can accurately measure their structural properties and total luminosities over a wide range of .
Note that although single-component fits to model galaxies with have the lowest fraction of best-fit models with , at high their fraction is similar to that of model galaxies with and higher than that for . Therefore at higher , as expected, the fraction of best-fit models with is higher for model galaxies with lower .
Tables 1 and 2 summarize the results of the single-component fits. As mentioned before, at low , it is more likely to overestimate the total luminosity and size. On the other hand, at high the non-homology in the light distribution of these two-component galaxies leads to underestimaton of the total luminosity. The offsets are larger for model galaxies with , as these galaxies have the most prominent no-homology in their surface brightness light distribution (Fig. 6). And, as expected, the offsets are smaller for bulge-dominated galaxies because of the negligible contribution of the disk component to the overall light profle.
For the range of in which typical local disk galaxies are observed (i.e. a few thousands), systematic offsets are less than 10%–20% for size measurements and 0.1 mag for luminosity measurements. Thus, single-component Sérsic fits using GALFIT give reliable sizes and luminosities for typical local disk galaxies.
Sky Estimation Effect on Systematics
Estimating the sky value is another key factor in morphological analysis, especially for extended objects like galaxies (e.g., MacArthur et al. 2003; Erwin et al. 2008; Bernardi et al. 2010; Yoon et al. 2011). Davari et al. (2014; their Fig. 9) show that the sky value can be measured with an accuracy better than 0.1 for early-type galaxies. That finding holds for bulge-dominated disk, galaxies, but it may not be the case for more disk-dominated systems. As discussed above, low-, disk-dominated galaxies paradoxically may be better fit by a model with a high Sérsic index, whose extended wings contribute little to compared to improvements in the fit toward the center. In order to examine the effect of sky determination, all model galaxies are fit two ways: (1) by letting the sky be a free component in the fit and (2) by fixing the sky value to the actual background value measured independently. We found that at high GALFIT can measure the sky value accurately when enough background pixels are available. (Note that the simulated images are at least 15 times larger than the of the model galaxy.) But at low (less than a few hundreds) and for galaxies with low , fixing the sky value decreases the systematic offsets by % for and by % for .
3.1.2 Galaxies Rescaled to z = 2
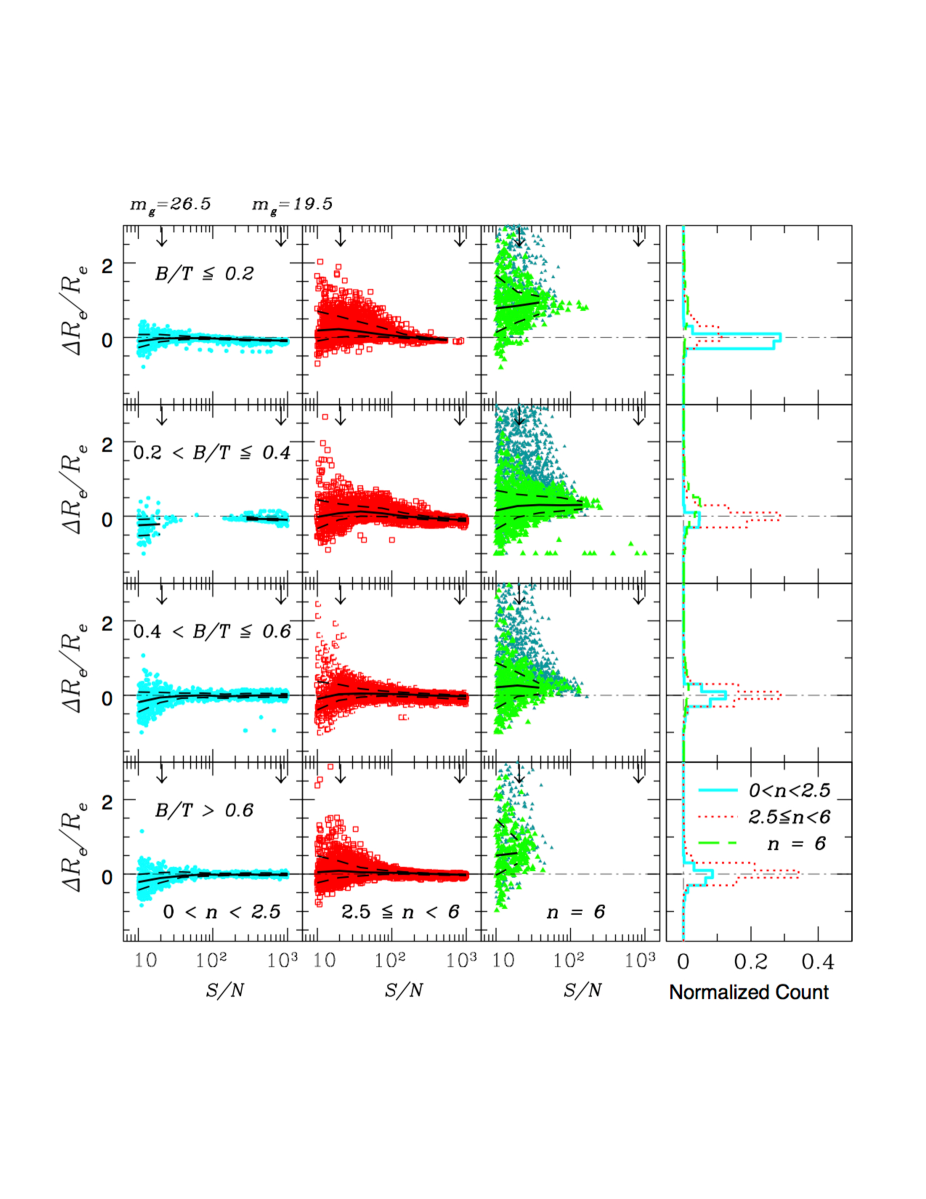
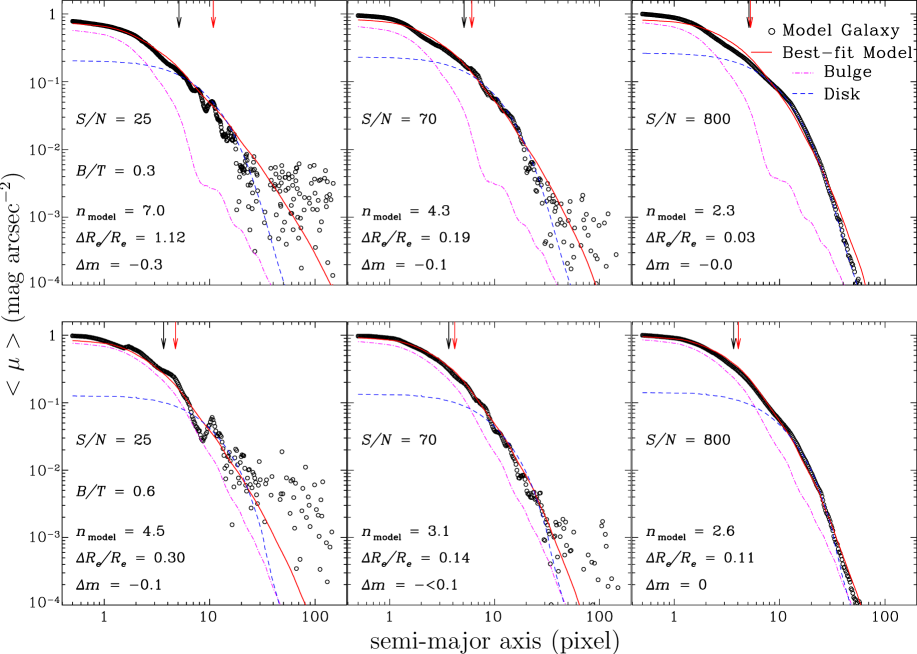
Figure 7 shows the results of fitting disk galaxies scaled to with a single Sérsic component. The trends are similar to the results for local disk galaxies (Fig. 5), but Tables 3 and 4 show that at high the systematic offsets are smaller for rescaled galaxies. As a result of rescaling the size of local galaxies to mimic galaxies at higher redshift, the structural non-homologies are mostly washed out and single-component fits, in fact, return more reliable fits. This can be seen in Figure 6 (middle panels) and Figure 8 (top panels).
Another noticeable difference between the results of local and rescaled model galaxies is the higher fraction of single-component fits with for more bulge-dominated galaxies. We consider these fits to be unreliable. The fraction of unreliable fits are 8, 20, 7, and 4 for galaxies with , 0.2–0.4, 0.4–0.6, and 0.6, respectively. Figure 8 (botton panels) shows that for rescaled galaxies the can be so low that it even affects the innermost part (i.e., bulge) of the galaxy. Note that, in order to mimic higher redshift observations, the range of is different (lower) for rescaled galaxies. On the other hand, as a result of more homologous light distribution, the fraction of single-component fits with is lower for rescaled galaxies with .
3.2. Fitting Disk Galaxies with Two Components
3.2.1 Measuring and Total Luminosities
Although the initial values do not have a major effect on the single Sérsic fits, they require some consideration for multiple-component decompositions, where it is generally advisable to use an additional, external prior or information. For example, one approach might be to fit a single component first, then add a second to the result, differentiating the two in some way. Another approach, which we adopt here, is to estimate using a one-dimensional light profile. Knowing that the disk component follows an exponential profile, we look for the part of the profile that traces a straight line in logarithmic space. A straight line fitted (in logarithmic space) to that section of the light distribution provides an estimate for the disk central surface brightness and scale length. Assuming the total brightness is given (which can be robustly estimated by single Sérsic fits), the bulge component magnitude and therefore the galaxy can be estimated. Most numerical problems encountered in the fit are caused by the small bulge sizes in our study, because they are near the resolution limit at high redshifts. When the sizes go below 0.1 pixel during a fit we hold them fixed to 0.5 pixel.
Local Galaxies
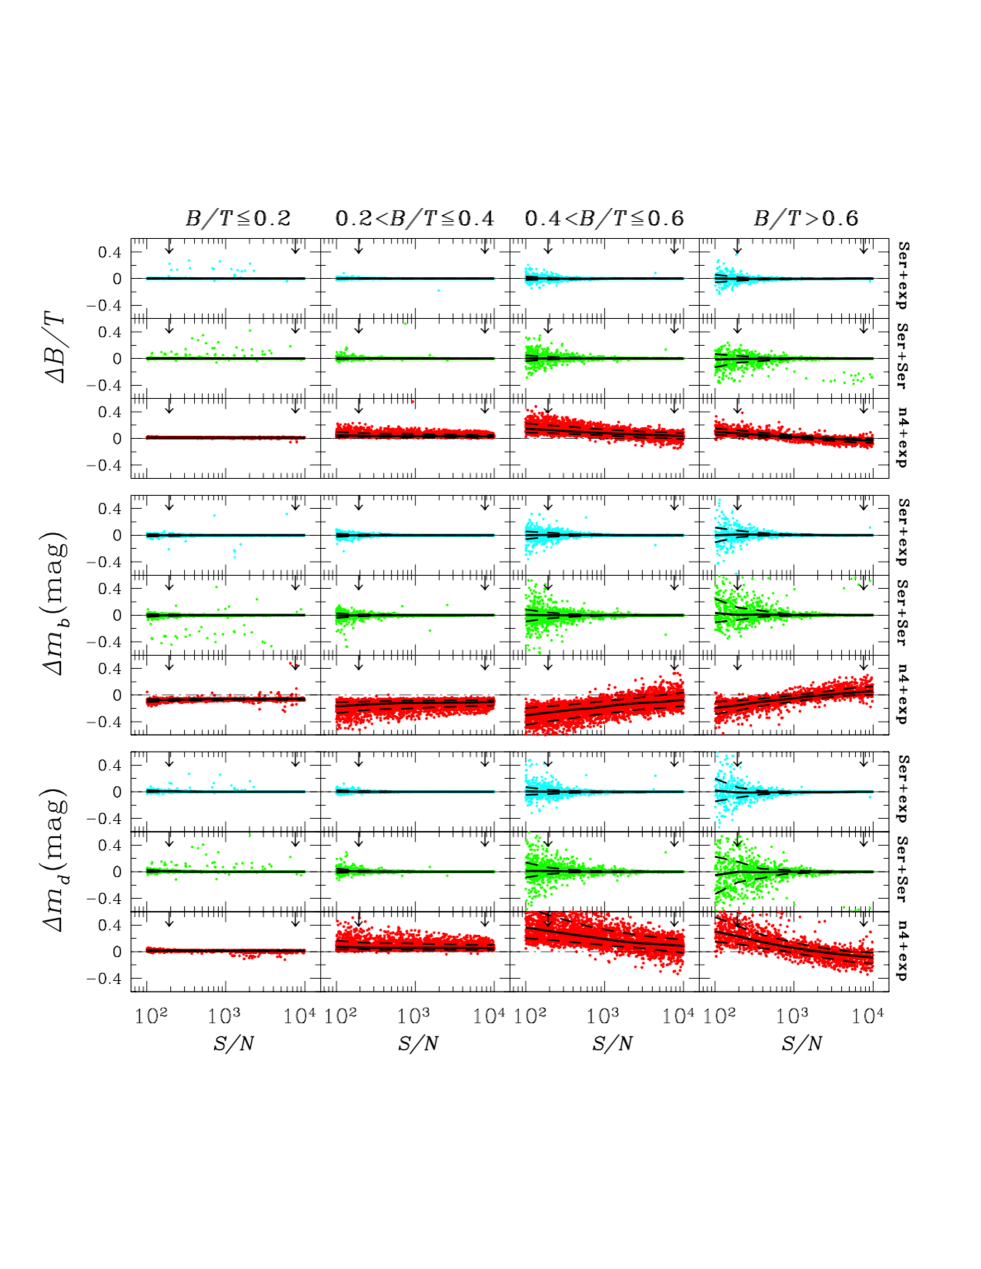
Figure 9 shows the results of measuring the total luminosity of the bulge and disk and for galaxies with three different methods: bulge with free Sérsic + exponential disk, two Sérsic components, and bulge with =4 + exponential disk. For disk-dominated galaxies (left column), and bulge and disk luminosities can be measured robustly, independent of the method. For galaxies with larger , Figure 9 shows that fixing the bulge Sérsic index to incorrect values can lead to considerable biases, especially for galaxies with intermediate (); while the bulge flux contribution is significant, its light distribution does not necessary follow a de Vaucouleurs profile. Using this method tends to overestimate the bulge total flux and does the opposite for the disk total flux. This effect becomes more prominent at lower . However, fitting model galaxies with a free Sérsic + exponential disk (cyan points) and even two Sérsic components (green points) results in more robust luminosity and determinations.
Previous studies have shown that not all disks follow an exponential light distribution (e.g., Boroson 1981), and therefore it is useful to know how well one can measure the Sérsic index and subsequent properties of the disk component, in case the disk has different from 1. Comparing the cases where the disk is set to versus = free in Figure 9, we find that although in general the uncertainties are lower for , at higher the results of and = free are comparable. This implies that, as known, the disk component need not follow a pure exponential function, in oder to find a reliable bulge+disk model fit.
Rescaled Galaxies to z = 2
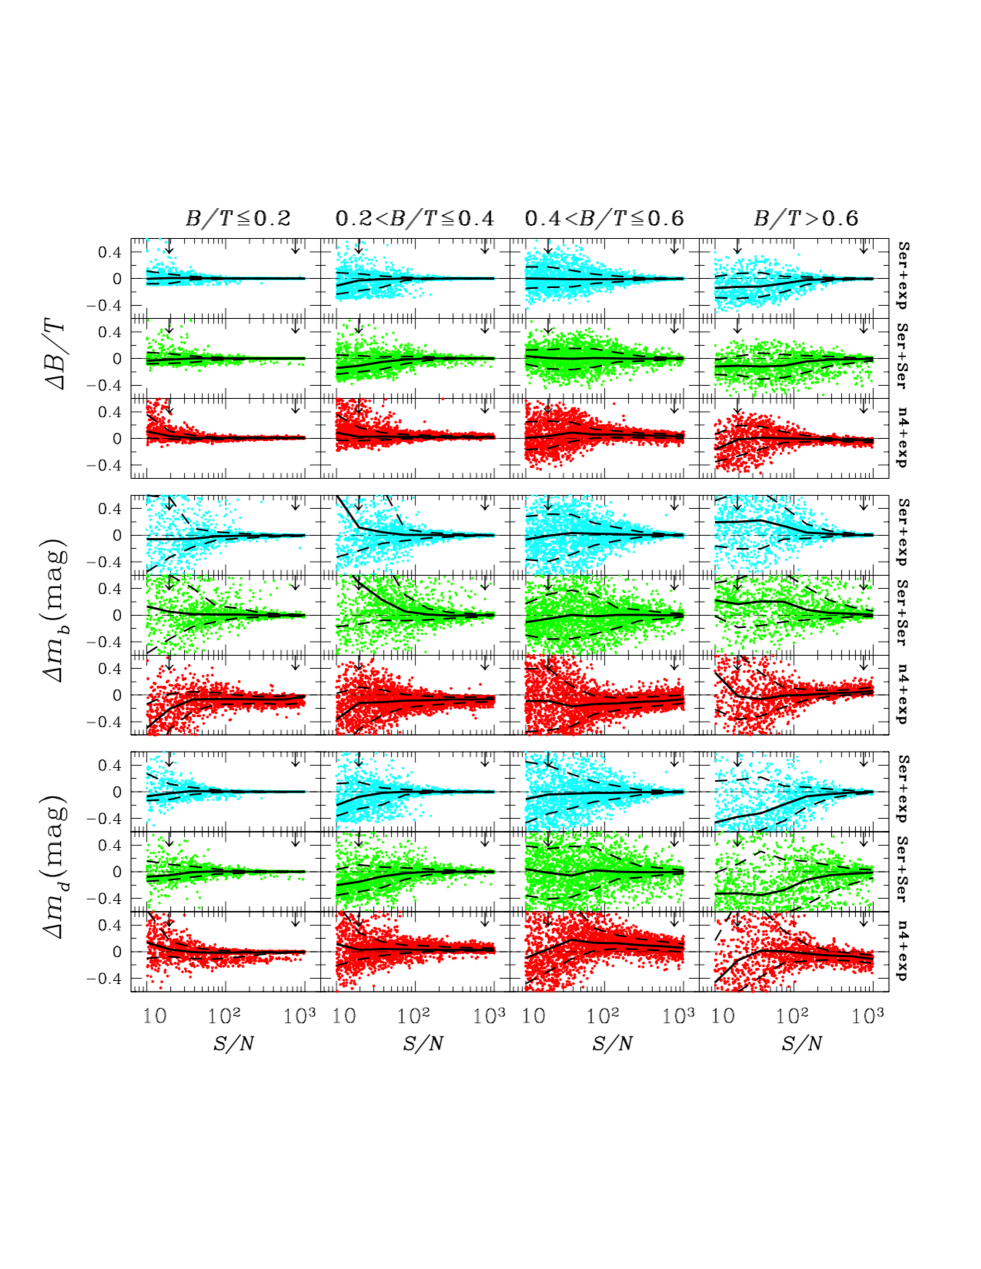
As expected, the measurements are more uncertain for high-z galaxies (Fig. 10), as their bulges typically have smaller than one pixel, and, besides, structural non-homologies are mostly washed out (Fig. 8). However, by employing different fitting methods, can be measured with no significant bias for of a few 100, values typical of actual HST observations of compact massive galaxies (e.g., Szomoru et al. 2012). Similar to the result for local galaxies, for galaxies with very small , any of the methods yields reliable results; however, for galaxies with higher , it is best to fit the bulge component with a free to mitigate systematic biases, even if the biases are smaller compared to local galaxies.
3.2.2 Measuring Bulge Properties
Local Galaxies
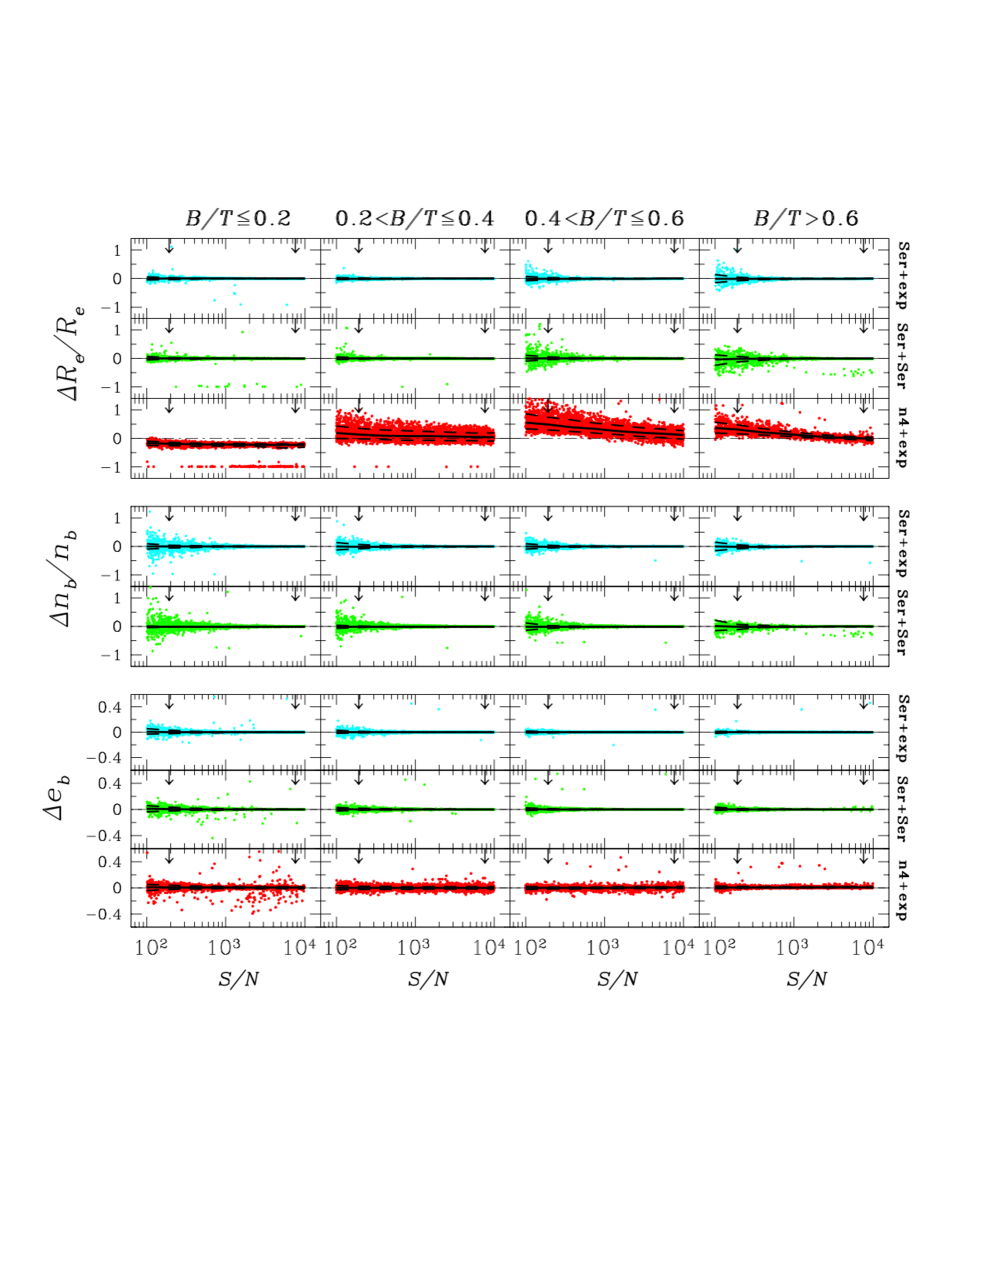
Figure 11 reinforces the conclusions drawn from Figure 9. Sérsic + exponential and Sérsic + Sérsic models can measure bulge properties with high accuracy. Figure 11 shows that + exponential is not a reliable model as it leads to biases in bulge size measurements. Fixing bulge to 4 tends to overestimate its effective radius. More importantly, any information on bulge is lost.
Galaxies Rescaled to z = 2
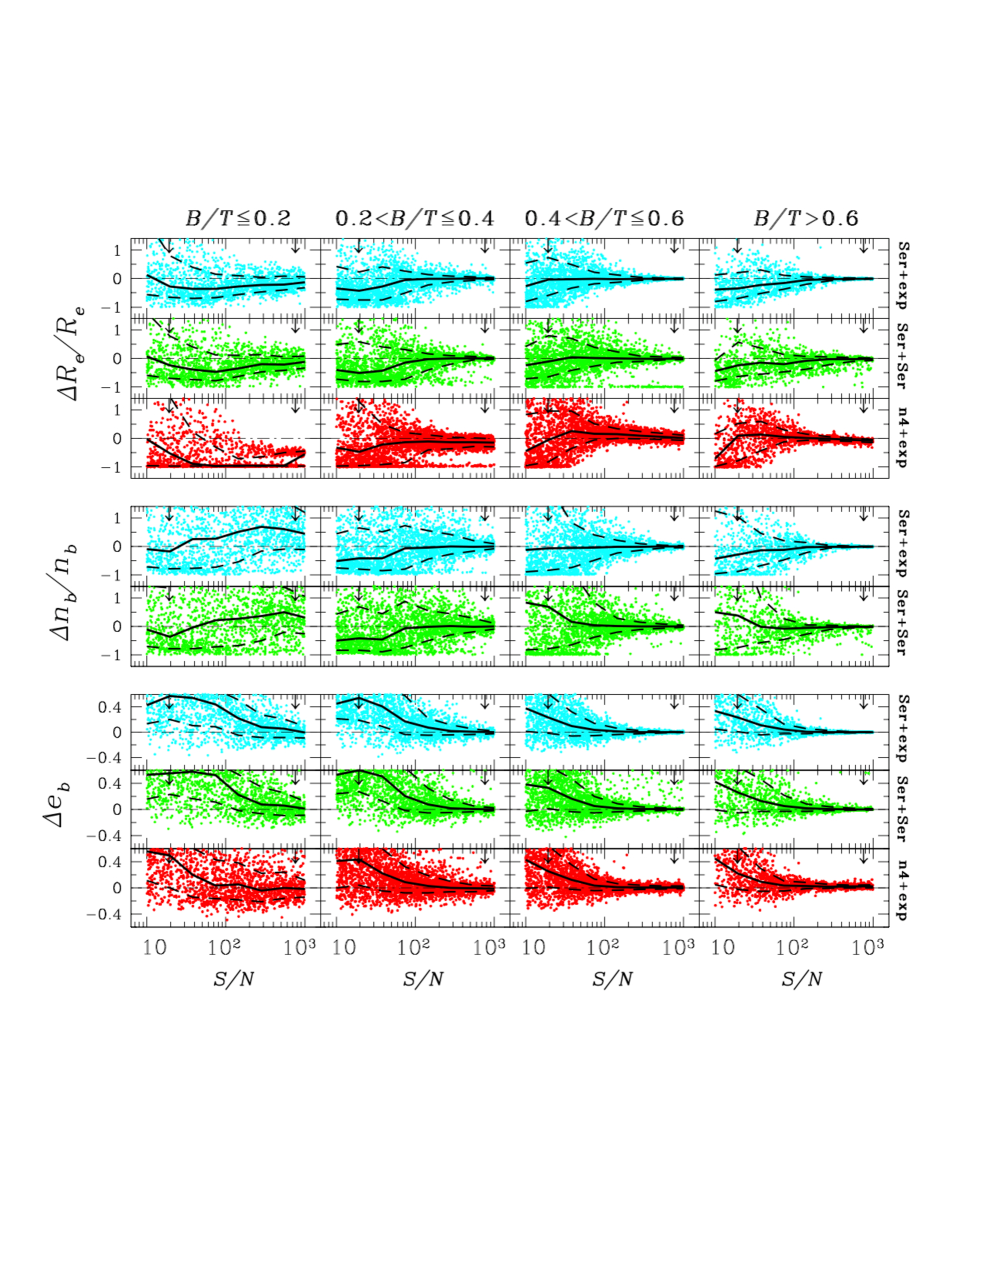
Figure 12 shows that for high-z galaxies with , measuring the bulge properties is vulnerable to large uncertainties and systematic offsets independent of the fitting method. For our model galaxies with 0.2, the systematic errors on the bulge properties measurements are as large as 50%, even when is high, due mainly to the small angular resolution. However, for model galaxies with 0.2 0.4 and very high values, the size and ellipticity can be measured with little error. Note that the bulge effective radius of these low- galaxies are 0.5 pixel (or less) and thus mainly unresolved. However, for model galaxies with and at of compact massive galaxies observed at high z, the bulge properties can be measured reliably. As expected, the Sérsic index is most vulnerable to large uncertainties. Similar to the results of local galaxies, the errors are greater for + exponential fits.
The high levels of uncertainties in bulge ellipticity measurements may be surprising. For idealized model galaxies, like ours, the ellipticity is expected to be one of the more robust measures. The robustness of recovered ellipticity is directly related to the recovered size. At lower redshifts, there is hardly any uncertainties but at higher redshifts, especially at lower and for galaxies with lower , the structural parameters are very uncertain as the bulge cannot be resolved by GALFIT. The recovered bulge and disk ellipticity distributions are biased toward extreme values. This is partly also an artificial effect of having hard numerical boundaries for the ellipticities between 0 and 1 rather than being continuous between arbitrarily negative and positive values. When nearly all the flux fits inside a single pixel the axis ratio parameter becomes irrelevant.
The uncertainties for measuring bulge structural properties are higher than for measuring the total magnitude and . This is because for a given overall profile shape (total flux), component parameters will have covariances consistent with that shape, to within the noise (often thought of, inaccurately, as “degeneracy”). This is especially true here because most high-z bulges fit inside a single pixel; naturally there is considerable uncertainty in the sizes and ellipticities but less so the luminosity.”
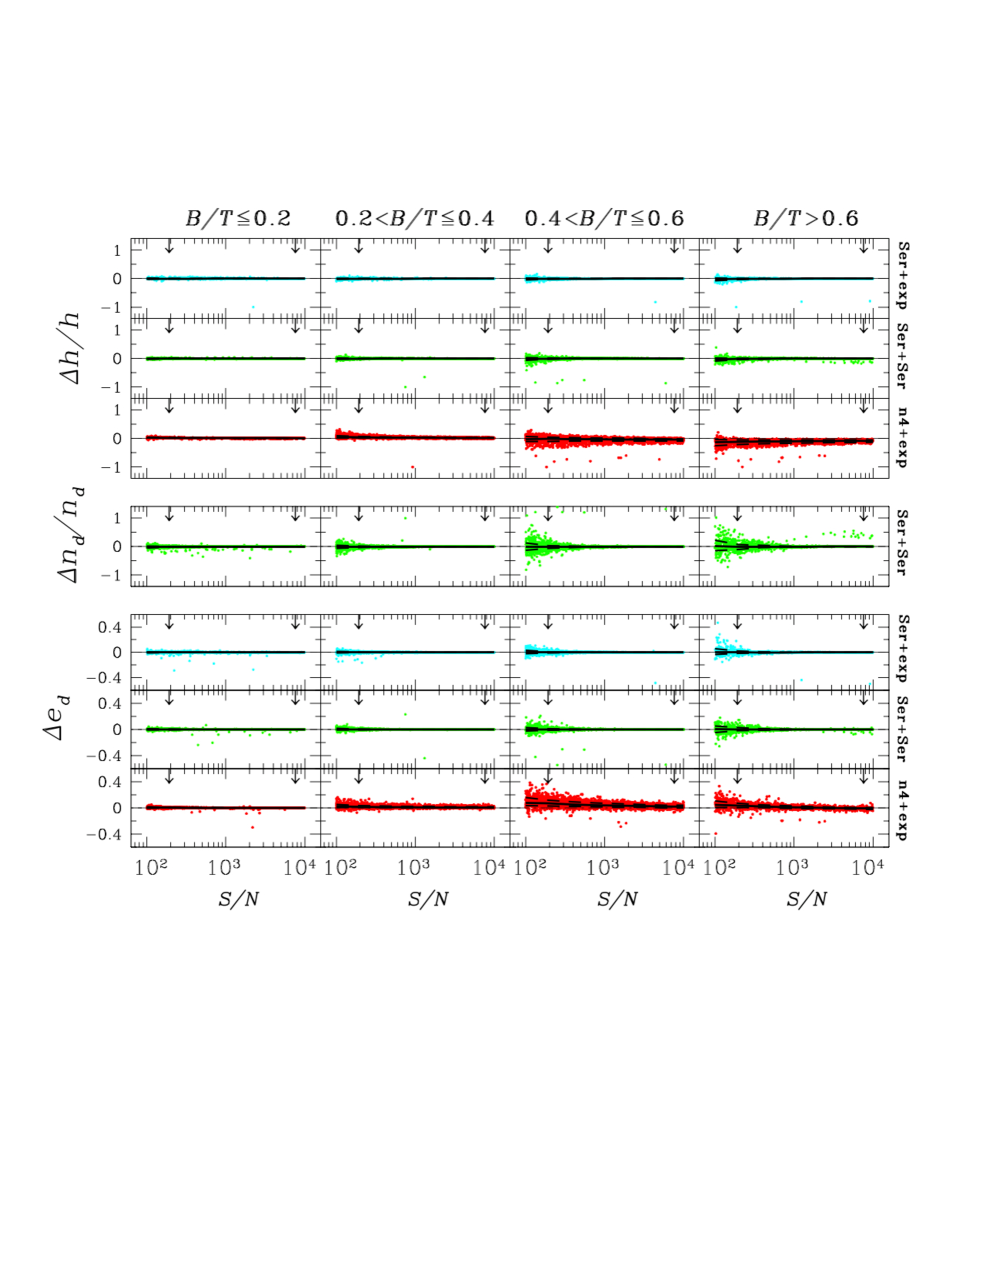
3.2.3 Measuring Disk Properties
The number of pixels that each component occupies affects the robustness of the fit. The disk component, being intrinsically larger than the bulge, is therefore easier to measure than the bulge. Figure 13 demonstrates this fact. All methods can measure the disk properties of local galaxies with no systematic offsets over a wide range of . The only exception is when the =4+exponential model is used for galaxies with higher ; this method causes 10% systematic offsets. The middle panel of the figure shows that the Sérsic+Sérsic model can measure the disk Sérsic index robustly.
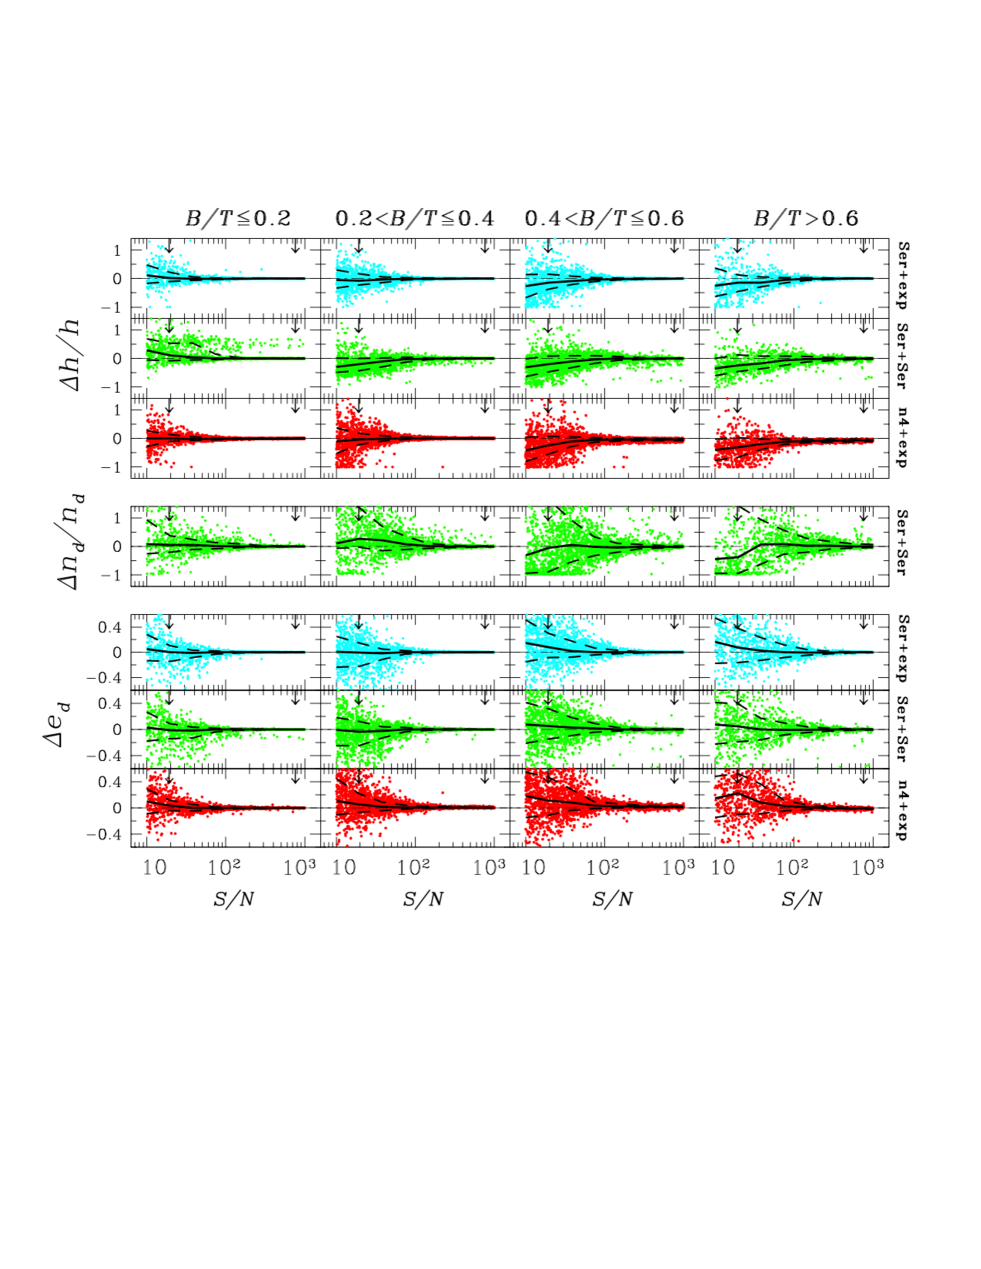
Figure 14 shows that even for galaxies rescaled to z = 2, disk properties can be measured with little to no systematic offsets and with low uncertainties at the pertinent to massive compact high-z galaxies. Measuring the disk Sérsic index has the highest level of uncertainties. Although the random uncertainties are near zero at higher , they increase to 10-20% at intermediate , and larger at very low . Note that the measured disk is centered on 1 and therefore there is no systematic bias.
4. Comparison to Other Studies
Our results generally agree well with those of other similar recent studies. Using a sample of galaxies spectroscopically selected from SDSS, Meert et al. (2013) show that single-component Sérsic fits of two-component (bulge + disk) simulated galaxies can lead to systematic biases in size measurements (their Fig. 8b), but the offsets are small, generally 10% over a wide range of galaxy sizes. This is consistent with our simulations of local galaxies: Tables 1 and 2 show that for our disk-dominated and bulge-dominated model galaxies the systematic offsets are less than 10, and for model galaxies with more prominent non-homology the offsets can be as large as 20. However, for very low (i.e., a few hundred) the systematic offsets can be even larger.
Meert et al. (2013), again in agreement with our findings, show that fitting local bulge+disk model galaxies with two components result in more reliable fits and measured structural parameters (their Figs. 9 and 10), as the systematic offsets are close to zero over a wide range of apparent magnitude (i.e., ). They also find that disk parameters can be measured more accurately compare to those for the bulge (Fig. 13). The parameter most vulnerable to large uncertainties is , confirming our findings (Fig. 11).
Meert et al. (2013) further examined the effects of image size on the accuracy of GALFIT sky determination. They find (their Figs. 12, 14, and 15), as we do, that GALFIT can measure the sky value with an accuracy of 0.1. Our simulations indicate that when the images are large enough (i.e., 10–15 times larger than effective radius of the galaxy), the sky component can be set as a free parameter for GALFIT modeling.
The simulations of Mosleh et al. (2013) show that size measurements done by two-component Sérsic fits are more reliable than single Sérsic fits. They found that for local massive, red, early-type galaxies (their Fig. 3), single-component fits overestimate the size. This bias goes away for their redshifted galaxies, consistent with our findings. Rescaling galaxies to higher redshifts washes out the structural non-homology and therefore single Sérsic fits can model the galaxy light profile better.
Similar, but less general sets of simulations are performed by Bruce et al. (2014). Their simulated galaxies are = 4 + = 1 models at discrete and effective radii values ranging from 0.01 to 0.99, and 1 to 20 pixels, respectively. All their mock galaxies have the same brightness, and thus the effect of is not examined. For their simulated galaxies with 0.1 0.9, they find that the derived sizes of the bulge component have higher uncertainties than the disk components, which our findings confim. Bruce et al. concluded that can be measured to within 10% accuracy. The simulations of Lang et al. (2014) show similar measurement errors in for their z 2 modeled galaxies. Our simulations further show that the measurement error depends on the galaxy , and it ranges from only a few percent at higher to 10-20% at lower redshifts.
In general, our results confirm the findings of similar previous studies. Furthermore, our simulations, for the first time, provide a detailed study of the effect on the GALFIT modeling of galaxies with a wide range of . Our results show that for different methods (i.e. Sérsic+exponential, =4+exponential), the reliability of the fits varies for different values of . Knowing the optimum method for a specific value of and offers a roadmap for a variety of structural analysis.
5. Implications for Red Nuggets
Our simulations provide a metric for quantifying the uncertainties in measuring the properties of the red, massive galaxies at z = 2. These peculiar objects are found to be generally compact ( 2.0 kpc). They mainly have 23, with a small fraction having (Szomoru et al. 2012). This translates to high ( 100) for typical single-orbit HST exposures.
Several previous studies have shown that if the light distributions of red nuggets follow a single Sérsic profile, at the that these galaxies are observed, the structural parameters and the total luminosity can be measured accurately (e.g., Häussler et al. 2007; Trujillo et al. 2007; Cimatti et al. 2008; Szomoru et al. 2010; van Dokkum & Brammer 2010; Williams et al. 2010; Papovich et al. 2012; van der Wel et al. 2012; Meert et al. 2013; Mosleh et al. 2013; Davari et al. 2014).
On the other hand, the structural non-homologies can lead to biases in size measurements using single-component fitting (a popular method). Davari et al. (2014) found that if the red nuggets have structures similar to those of local massive elliptical galaxies, single Sérsic fits return reliable size (with about 10 systematic offsets) and total luminosity measurements. In this paper, we further extend previous work by examining the potential biases of single-component size measurements of red nuggets, assuming that their light distributions resemble that of local galaxies with a bulge and a disk component. Our work is motivated by the possibility that red nuggets contain a significant disk component. We are interested in knowing whether the presence of a disk affects the overall size and luminosity measurements of red nuggets, as well as the prospects of decomposing the bulge and disk components, to study derive their structural parameters and eventually their redshift evolution.
Figure 7 and Tables 3 and 4 show the best-fit results of the single-component Sérsic fits of the bulge+disk galaxies. With adequate ( 100, comparable to red nuggets studied in CANDELS), the presence of a disk has an insignificant effect (a few percent underestimation) on their sizes. This holds over a wide range of sizes ( pixels). At much lower values (e.g., 50), the systematic offsets are about 20, which is still insignificant compared to the estimated amount of evolution (200%–500%). Conclusion: if red nuggets have structures similar to those of local spiral galaxies, single-component Sérsic fits of these galaxies measure their global sizes robustly. Furthermore, Table 4 shows that the total luminosity of the bulge+disk galaxies can be measured very accurately, too.
The Sérsic indices of the best-fit single-component models can be an indicator of the of the galaxy (Fisher & Drory 2008). We found that, at the of observed red nuggets, all the best-fit models with have . It is more difficult to physically interpret fits with , as it can indicate either a high or a galaxy with moderate (e.g., 0.4) and moderately low (Fig. 6, middle panels). Lower values of Sérsic indices are more informative and less difficult to interpret.
We also examine how well one can measure the of disk galaxies and the reliability of the resulting parameters for the bulge and disk components. Figure 10 shows that for galaxies with and at the pertinent to red nuggets, can be accurately measured from fitting a Sérsic + exponential disk model.
The properties of bulges can be measured robustly in galaxies with and with little to no systematic offsets but with large uncertainties in those with (Fig. 12). The best strategy is to leave the Sérsic index of the bulge free, while adding an exponential component for the disk. Fixing the bulge Sérsic index to introduces systematic biases, apart from removing any information on . At higher , especially, using this method tends to overestimate bulge total flux and effective radius and underestimate those of the disk component. Our simulations show that recovering the bulge properties of low at z 2 is challenging due to present resolution level of HST WFC3. For well-resolved bulges, even at very low , the bulge properties can be measured well, as our low-redshift simulations show.
The properties of the disk are easiest to measure and least subject to serious systematic error (Fig. 14). This is expected, as the disk component is the most extended and is least effected by the PSF. As for the case of the bulge mentioned above, the best strategy is to set the bulge Sérsic index free while fixing the disk to an exponential. Of course, this imposes the assumption that the disk follows an exponential light distribution.
The analysis of massive galaxies at z 2 find bulge sizes that are larger than those assumed in our simulations (Bruce et al. 2014). The fact that they are not in our sample, comprised only of scaled versions of local bulge+disk systems, suggests that the actual population of galaxies at differs from that our assumed sample. The fraction of galaxies with 0.4 among the real galaxies at high-z is relatively low, which further confirms that we are comparing two different populations. Our simulations indicate that the actual galaxy population at high redshifts is easier to analyze compared with the unresolved bulge cases because they span an intermediate angular size between low-z and z 2 galaxies.
6. Summary
A considerable fraction of the compact, red massive galaxies at z 2 may have a disk component. This motivated us to simulate mock observations of model galaxies to investigate the extent to which a disk component, if present, can be detected under realistic conditions typical of actual observations.
The simulated bulge+disk galaxies span a uniform and wide range of , and we constrain the disk and bulge components to follow empirical scaling relations established for local galaxies. We then rescale these galaxies to mimic the and sizes of galaxies observed at z 2. This provides the most complete set of simulations that allows us to examine the robustness of two-component image decomposition of compact disk galaxies at different .
First, we measure the basic structural parameters using single Sérsic fits, with special emphasis on their sizes. This analysis method is popularly employed in the literature. We then study the robustness of different methods of bulge+disk decomposition of these composite galaxies. Furthermore, we assess the effectiveness of different sky background fitting methods.
For the range of and sizes pertinent to red nuggets, we conclude:
-
•
Modeling bulge+disk galaxies with a single Sérsic component does not bias the sizes too low, by no more than 10. The apparent compactness of red nuggets is real; it is not the result of missing faint, outer light. However, single-component fits of galaxies with low preferentially leads to relatively larger biases in size and luminosity.
-
•
The can be measured accurately, regardless of the .
-
•
Bulge properties of galaxies with 0.4 can be measured robustly. This becomes increasingly difficult for galaxies with below this limit.
-
•
Disk properties are subject to the least amount of systematic and random error, regardless of the .
-
•
Fits with Sérsic indices larger than 6 have larger uncertainties and can cause significant systematic errors. Refitting these galaxies by fixing to 6 provides more reliable results.
-
•
GALFIT can measure the sky value accurately when enough background pixels are available at high . At low , fixing the sky value during the fitting reduces systematic errors.
References
- Barden et al. (2005) Barden, M., Rix, H.-W., Somerville, R. S., et al. 2005, ApJ, 635, 959
- Barro et al. (2013) Barro, G., Faber, S. M., Pérez-González, P. G., et al. 2013, ApJ, 765, 104
- Bell et al. (2004) Bell, E. F., Wolf, C., Meisenheimer, K., et al. 2004, ApJ, 608, 752
- Bernardi et al. (2010) Bernardi, M., Shankar, F., Hyde, J. B., et al. 2010, MNRAS, 404, 2087
- Blanton et al. (2003) Blanton, M. R., Hogg, D. W., Bahcall, N. A., et al. 2003, ApJ, 592, 819
- Boroson (1981) Boroson, T. 1981, ApJS, 46, 177
- Bruce et al. (2014) Bruce, V. A., Dunlop, J. S., McLure, R. J., et al. 2014, MNRAS, 444, 1660
- Buitrago et al. (2008) 2008ApJ…687L..61B Buitrago, F., Trujillo, I., Conselice, C. J., et al. 2008, ApJ, 687, L61
- Cassata et al. (2010) Cassata, P., Giavalisco, M., Guo, Y., et al. 2010, ApJ, 714, L79
- Cassata et al. (2011) Cassata, P., Giavalisco, M., Guo, Y., et al. 2011, ApJ, 743, 96
- Chang et al. (2013) Chang, Y.-Y., van der Wel, A., Rix, H.-W., et al. 2013, ApJ, 762, 83
- Cimatti et al. (2008) Cimatti, A., Cassata, P., Pozzetti, L., et al. 2008, A&A, 482, 21
- Ciotti (1991) Ciotti, L. 1991, A&A, 249, 99
- Courteau et al. (1996) Courteau, S., de Jong, R. S., & Broeils, A. H. 1996, ApJ, 457, L73
- Daddi et al. (2005) Daddi, E., Renzini, A., Pirzkal, N., et al. 2005, ApJ, 626, 680
- Damjanov et al. (2009) Damjanov, I., McCarthy, P. J., Abraham, R. G., et al. 2009, ApJ, 695, 101
- Davari et al. (2014) Davari, R., Ho, L. C., Peng, C. Y., & Huang, S. 2014, ApJ, 787, 69
- de Jong (1996) de Jong, R. S. 1996, A&A, 313, 45
- de Vaucouleurs (1948) de Vaucouleurs, G. 1948, Annales d’Astrophysique, 11, 247
- Dekel & Burkert (2014) Dekel, A., & Burkert, A. 2014, MNRAS, 438, 1870
- Djorgovski & Davis (1987) Djorgovski, S., & Davis, M. 1987, ApJ, 313, 59
- Dressler et al. (1987) Dressler, A., Lynden-Bell, D., Burstein, D., et al. 1987, ApJ, 313, 42
- Erwin et al. (2008) Erwin, P., Pohlen, M., & Beckman, J. E. 2008, AJ, 135, 20
- Fisher & Drory (2008) Fisher, D. B., & Drory, N. 2008, AJ, 136, 773
- Franx et al. (2003) Franx, M., Labbé, I., Rudnick, G., et al. 2003, ApJ, 587, L79
- Franx et al. (2008) Franx, M., van Dokkum, P. G., Schreiber, N. M. F., et al. 2008, ApJ, 688, 770
- Freeman (1970) Freeman, K. C. 1970, ApJ, 160, 811
- Fukugita et al. (1995) Fukugita, M., Shimasaku, K., & Ichikawa, T. 1995, PASP, 107, 945
- Gadotti (2009) Gadotti, D. A. 2009, MNRAS, 393, 1531
- Graham & Worley (2008) Graham, A. W., & Worley, C. C. 2008, MNRAS, 388, 1708
- Grogin et al. (2011) Grogin, N. A., Kocevski, D. D., Faber, S. M., et al. 2011, ApJS, 197, 35
- Hamabe & Kormendy (1987) Hamabe, M., & Kormendy, J. 1987, in IAU Symp. 127, Structure and Dynamics of Elliptical Galaxies, ed. P. T. de Zeeuw & S. D. Tremaine, 379
- Häussler et al. (2007) Häussler, B., McIntosh, D. H., Barden, M., et al. 2007, ApJS, 172, 615
- Hogg et al. (2004) Hogg, D. W., Blanton, M. R., Brinchmann, J., et al. 2004, ApJ, 601, L29
- Hopkins et al. (2009) Hopkins, P. F., Bundy, K., Murray, N., et al. 2009, MNRAS, 398, 898
- Huang et al. (2013a) Huang, S., Ho, L. C., Peng, C. Y., Li, Z.-Y., & Barth, A. J. 2013a, ApJ, 766, 47
- Huang et al. (2013b) Huang, S., Ho, L. C., Peng, C. Y., Li, Z.-Y., & Barth, A. J. 2013b, ApJ, 768, L288, L288, L288, L288, L288, L288, L288, L28
- Ichikawa et al. (2012) Ichikawa, T., Kajisawa, M., & Akhlaghi, M. 2012, MNRAS, 422, 1014
- Ishibashi et al. (2013) Ishibashi, W., Fabian, A. C., & Canning, R. E. A. 2013, MNRAS, 431, 2350
- Jedrzejewski (1987) Jedrzejewski, R. I. 1987, MNRAS, 226, 747
- Koekemoer et al. (2011) Koekemoer, A. M., Faber, S. M., Ferguson, H. C., et al. 2011, ApJS, 197, 36
- Kormendy (1977) Kormendy, J. 1977, ApJ, 218, 333
- Kormendy & Barentine (2010) Kormendy, J., & Barentine, J. C. 2010, ApJ, 715, L176
- Kraljic et al. (2012) Kraljic, K., Bournaud, F., & Martig, M. 2012, ApJ, 757, 60
- Kriek et al. (2006) Kriek, M., van Dokkum, P. G., Franx, M., et al. 2006, ApJ, 649, L71
- La Barbera et al. (2003) La Barbera, F., Busarello, G., Merluzzi, P., Massarotti, M., & Capaccioli, M. 2003, ApJ, 595, 127
- La Barbera et al. (2010) La Barbera, F., de Carvalho, R. R., de La Rosa, I. G., & Lopes, P. A. A. 2010, MNRAS, 408, 1335
- Laurikainen et al. (2010) Laurikainen, E., Salo, H., Buta, R., Knapen, J. H., & Comerón, S. 2010, MNRAS, 405, 1089
- Lawrence et al. (2007) Lawrence, A., Warren, S. J., Almaini, O., et al. 2007, MNRAS, 379, 1599
- Longhetti et al. (2007) Longhetti, M., Saracco, P., Severgnini, P., et al. 2007, MNRAS, 374, 614
- MacArthur et al. (2003) MacArthur, L. A., Courteau, S., & Holtzman, J. A. 2003, ApJ, 582, 689
- Mancini et al. (2010) Mancini, C., Daddi, E., Renzini, A., et al. 2010, MNRAS, 401, 933
- McIntosh et al. (2005) McIntosh, D. H., Bell, E. F., Rix, H.-W., et al. 2005, ApJ, 632, 191
- Meert et al. (2013) Meert, A., Vikram, V., & Bernardi, M. 2013, MNRAS, 433, 1344
- Mosleh et al. (2013) Mosleh, M., Williams, R. J., & Franx, M. 2013, ApJ, 777, 117
- Muzzin et al. (2009) Muzzin, A., van Dokkum, P., Franx, M., et al. 2009, ApJ, 706, L188
- Newman et al. (2012) Newman, A. B., Ellis, R. S., Bundy, K., & Treu, T. 2012, ApJ, 746, 162
- Nigoche-Netro et al. (2007) Nigoche-Netro, A., Moles, M., Ruelas-Mayorga, A., Franco-Balderas, A., & Kjørgaard, P. 2007, A&A, 472, 773
- Nigoche-Netro et al. (2008) Nigoche-Netro, A., Ruelas-Mayorga, A., & Franco-Balderas, A. 2008, A&A, 491, 731
- Oser et al. (2012) Oser, L., Naab, T., Ostriker, J. P., & Johansson, P. H. 2012, ApJ, 744, 63
- Papovich et al. (2012) Papovich, C., Bassett, R., Lotz, J. M., et al. 2012, ApJ, 750, 93
- Patel et al. (2013) Patel, S. G., van Dokkum, P. G., Franx, M., et al. 2013, ApJ, 766, 15
- Peng et al. (2002) Peng, C. Y., Ho, L. C., Impey, C. D., & Rix, H.-W. 2002, AJ, 124, 266
- Peng et al. (2010) Peng, C. Y., Ho, L. C., Impey, C. D., & Rix, H.-W. 2010, AJ, 139, 2097
- Poggianti et al. (2013) Poggianti, B. M., Calvi, R., Bindoni, D., et al. 2013, ApJ, 762, 77
- Ravindranath et al. (2004) Ravindranath, S., Ferguson, H. C., Conselice, C., et al. 2004, ApJ, 604, L9
- Robertson et al. (2006) Robertson, B., Bullock, J. S., Cox, T. J., et al. 2006, ApJ, 645, 986
- Ryden (2006) Ryden, B. S. 2006, ApJ, 641, 773
- Saracco et al. (2010) Saracco, P., Longhetti, M., & Gargiulo, A. 2010, MNRAS, 408, L21
- Sérsic (1968) Sérsic, J. L. 1968, Atlas de Galaxias Australes (Córdoba: Obs. Astron., Univ. Nac. Córdoba)
- Shen et al. (2003) Shen, S., Mo, H. J., White, S. D. M., et al. 2003, MNRAS, 343, 978
- Szomoru et al. (2012) Szomoru, D., Franx, M., & van Dokkum, P. G. 2012, ApJ, 749, 121
- Szomoru et al. (2010) Szomoru, D., Franx, M., van Dokkum, P. G., et al. 2010, ApJ, 714, L244
- Taylor et al. (2010) Taylor, E. N., Franx, M., Glazebrook, K., et al. 2010, ApJ, 720, 723
- Toft et al. (2007) Toft, S., van Dokkum, P., Franx, M., et al. 2007, ApJ, 671, 285
- Trujillo et al. (2009) Trujillo, I., Cenarro, A. J., de Lorenzo-Cáceres, A., et al. 2009, ApJ, 692, L118
- Trujillo et al. (2007) Trujillo, I., Conselice, C. J., Bundy, K., et al. 2007, MNRAS, 382, 109
- Valentinuzzi et al. (2010) Valentinuzzi, T., Fritz, J., Poggianti, B. M., et al. 2010, ApJ, 712, 226
- van der Wel et al. (2012) van der Wel, A., Bell, E. F., Häussler, B., et al. 2012, ApJS, 203, 24
- van der Wel et al. (2008) van der Wel, A., Holden, B. P., Zirm, A. W., et al. 2008, ApJ, 688, 48
- van der Wel et al. (2011) van der Wel, A., Rix, H.-W., Wuyts, S., et al. 2011, ApJ, 730, 38
- van Dokkum & Brammer (2010) van Dokkum, P. G., & Brammer, G. 2010, ApJ, 718, L73
- van Dokkum et al. (2008) van Dokkum, P. G., Franx, M., Kriek, M., et al. 2008, ApJ, 677, L5
- Williams et al. (2014) Williams, C. C., Giavalisco, M., Cassata, P., et al. 2014, ApJ, 780, 1
- Williams et al. (2010) Williams, R. J., Quadri, R. F., Franx, M., et al. 2010, ApJ, 713, 738
- Wuyts et al. (2010) Wuyts, S., Cox, T. J., Hayward, C. C., et al. 2010, ApJ, 722, 1666
- Yoon et al. (2011) Yoon, I., Weinberg, M. D., & Katz, N. 2011, MNRAS, 414, 1625