The Galactic Center: A PeV Cosmic-Ray Acceleration Factory
Abstract
The multi-TeV -rays from the Galactic Center (GC) have a cutoff at tens of TeV, whereas the diffuse emission has no such cutoff, which is regarded as an indication of PeV proton acceleration by the HESS experiment. It is important to understand the inconsistency and study the possibility that PeV cosmic-ray acceleration could account for the apparently contradictory point and diffuse -ray spectra.
In this work, we propose that the cosmic rays are accelerated up to PeV in GC. The interaction between cosmic rays and molecular clouds is responsible for the multi-TeV -ray emissions from both the point source and diffuse sources today. Enhanced by the small volume filling factor (VFF) of the clumpy structure, the absorption of the -rays leads to a sharp cutoff spectrum at tens of TeV produced in the GC. Away from galactic center, the VFF grows and the absorption enhancement becomes negligible.
As a result, the spectra of -ray emissions for both point source and diffuse sources can be successfully reproduced under such self-consistent picture. In addition, a “surviving-tail” at 100 TeV is expected from the point source, which can be observed by future projects CTA and LHAASO. Neutrinos are simultaneously produced during proton-proton (PP) collision. With 5-10 years observations, the KM3Net experiment will be able to detect the PeV source according to our calculation.
1. Introduction
It is well known that the GC, with a supermassive black hole (4 ), is a good laboratory for the study of astrophysical phenomena. Historically, there have been many discussions on the possibility that the GC is a dominant source of galactic cosmic rays (Ptuskin & Khazan, 1981; Said et al., 1981; Giler, 1983; Guo et al., 2013a, b). With state-of-art technologies, current -ray observations provide unprecedented sensitivity in studying the acceleration activities in the GC.
Very high energy -rays from hundreds of GeV to tens of TeV in the direction of the GC have been observed by several atmospheric Cerenkov telescopes, such as CANGAROO (Tsuchiya et al., 2004), VERITAS (Kosack et al., 2004; Smith & for the VERITAS Collaboration, 2015), HESS (Aharonian et al., 2004, 2006a, 2006b, 2008), and MAGIC (Albert et al., 2006). Later observations by HESS found the source spectrum has an exponential cutoff at about tens of TeV with the implication of intrinsic origin (Aharonian et al., 2009). This implies that the maximum accelerated energy for a proton is 200 TeV as shown (Guo et al., 2013b). The diffuse -ray emission is also observed at GC disk range by the HESS experiment (Aharonian et al., 2006a). The more interesting thing is that the -ray emission is correlated with the density of molecular hydrogen, which is generally regarded as a hadronic source. Simultaneously, the spectrum for the GC point source is the same as the diffuse one, and they may possibly share the same origin: the GC supermassive black hole. Just recently, the diffuse -ray emissions around the GC have been observed by the HESS experiment (HESS Collaboration et al., 2016). The results support that the -ray emissions come from PeV energy proton and the most plausible accelerator is the GC (HESS Collaboration et al., 2016). Several models have been proposed to explain the -ray emission and discuss the PeV acceleration at the GC region (Fujita et al., 2016; Celli et al., 2016). The direct criterion to PeV CR acceleration in the GC region is the observation of high-energy neutrinos. Several 30 TeV to 2 PeV neutrinos have been observed from the GC direction by the IceCube experiment (Aartsen et al., 2013; IceCube Collaboration, 2013). Some works have been discussed the possibility of the GC origin (Ahlers & Murase, 2014; Bai et al., 2014; Kimura et al., 2015; Fujita et al., 2015).
The problem is how to understand the cutoff in the spectrum of the central source. One possible reason is the absorption of -rays by interactions with the ambient infrared radiation field. But calculations showed that the absorption effect is not sufficient (Aharonian et al., 2009). It is possible that the absorption of -rays is underestimated because the infrared radiation field near the GC may be irregular. As a matter of fact, the material in the GC region is clumpy, dense, and fragmented (Etxaluze et al., 2011). The degree of irregularity can be described by the VFF, which is defined as the ratio of the volume of clumpy structure to the total volume of the GC. When the VFF is much smaller, the material density of the clumpy structure is much higher than the fixed total material.
The VFF in circumnuclear disk is at the level of 1 (Vollmer & Duschl, 2001b, 2002; Fryer et al., 2007). At the central cavity (Jackson et al., 1993; Guesten et al., 1987), the gas density is large enough for self-gravity to form a clumpy structure to overcome the strong tidal shear of the black hole, and this will make the VFF even smaller, (Jackson et al., 1993; Genzel et al., 1985). One important consequence is that the infrared radiation component of interstellar radiation field (ISRF) should have a VFF similar to the gas material. The reason is that the infrared background light comes from the reemitting of the gas after absorbing the starlight. A small VFF means that the -rays experience much many more background photons being generated or passing through the dense gas region. That causes a much stronger absorption and attenuation at high energy. So the observed -ray cutoff at tens of TeV can possibly be due to the attenuation of the ISRF. Away from the GC, the VFF grows, the absorption will become less and less important.
In this work, we propose that the CR could have been accelerated to PeV during the GC activity in past and are producing the high-energy -rays by -collision today. We further suggest that observed the sharp cutoff -ray spectrum is due to the absorption of the ISRF enhanced by the dense clumpy structure in the GC. Considering the density of the ISRF and absorption efficiency, the higher-energy -ray around 100 TeV can escape and the surviving tail is predicted, which can be tested by future projects, such as CTA and LHAASO experiments. Simultaneously, neutrinos can be produced during the -collision and can be observed by the KM3Net experiment in a few years of operation. The paper is organized in the following way. In Sec. 2, we present the detailed modeling of this picture. Sec. 3 is the discussions and Sec. 4 gives the conclusions.
2. Model and results
During the violent activities, the accretion of stars and gas by the supermassive black hole could be effective in accelerating particles. The maximum energy that protons can achieve for diffusive shock acceleration is (Aharonian & Neronov, 2005)
| (1) |
where is the magnetic field and is the size of the acceleration region. As in (Aharonian & Neronov, 2005), we assume the acceleration takes place within Schwarzschild radii ( cm) of the black hole. To accelerate protons to above PeV requires magnetic field strength of tens of G in the acceleration region (Dodds-Eden et al., 2009; Markoff et al., 2001). Such a condition could be reached in the very central region of the GC (Aharonian & Neronov, 2005; Eatough et al., 2013). On the other hand, if the acceleration takes place in larger regions, the required magnetic field could be smaller. When the accelerated CRs diffuse out of the GC, the hadronic interaction with interstellar medium (ISM) will occur and produce similar amounts of -rays and neutrinos. The detailed model calculations are discussed in the following.
2.1. The -ray emission in the GC with the break spectrum of protons in high energy
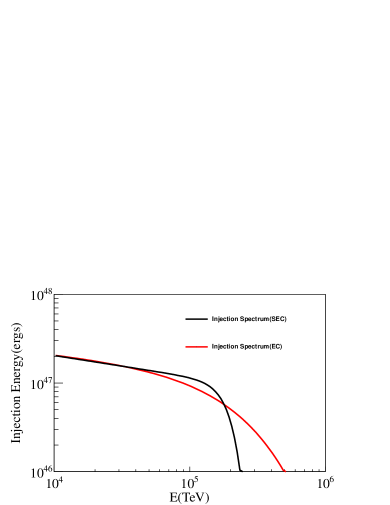
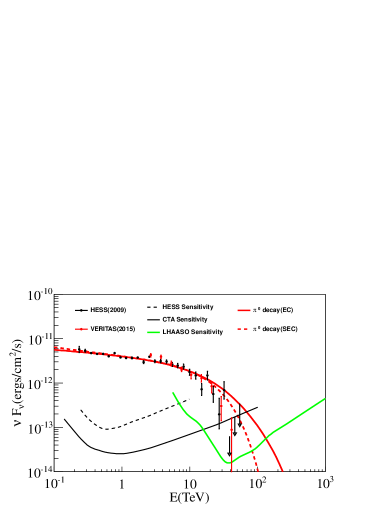
The -ray emission from the point source in the GC has a broken power law spectrum at tens of TeV. The best fit of the cutoff can be described by exponential function in high energy (Aharonian et al., 2009). While adopting the traditional model of the ISRF, the absorption effect is too small to explain the observed cutoff spectrum of HESS J1745-290 (Aharonian et al., 2009). The alternative solution attributes it to the intrinsic cutoff, which characterizes the acceleration limit of the flaring event. For comparison, the broken spectrum of protons can be simply adopted to exponential cutoff (EC) as or superexponential cutoff (SEC) as , where E is the proton energy, TeV is the critical energy and denotes the sharp break. The key points are the density distribution of CRs and the ISM distribution in the GC region. For sake of simplicity, the average density = is assumed in the GC point and diffuse regions (Chernyakova et al., 2011; Linden et al., 2012). The total energy of the CRs is dependent on its spectral index. Due to the energy break at 200 TeV, the spectrum of CRs becomes soft at tens of TeV. Here the spectral index 2.15 (2.24) and total energy of 0.86(1.86) erg is adopted for the EC (SEC) mode. Under such scenario, the spectrum of -rays are calculated as shown in Fig.1. From this figure, it is clear that the proton spectrum with SEC is much better to fit the observation.
Although the -ray emission in the point source of the GC can be explained by adopting the SEC of injection CRs, it is hard to reproduce the diffuse one around GC region under the same scenario. The alternative method, like the absorption in the heavy ISRF, should be considered to understand the possible physical mechanism in one unified way.
2.2. -ray absorption with an inhomogeneous ISRF in the GC
The Galaxy is not transparent to very high energy -rays. The main three processes resulting in energy losses of photons are the photoelectric effect, Compton scattering and pair production. The photoelectric effect and Compton scattering are negligible for the -ray with the energy higher than tens of TeV (Guo et al., 2014). So the dominant contribution to the attenuation comes from pair production, which leads to the change in the -ray spectrum. In this work, the absorption can be divided into two components: within the source region and on the way from the source region to the Earth. For the latter, previous studies (Zhang et al., 2006; Moskalenko et al., 2006) have shown that the absorption is just 10 for 20 TeV -rays and 20 for 50 TeV -rays, which is far less than what is required in order to explain the cutoff spectrum of the point source at the GC (Aharonian et al., 2009). Absorption in the source region might be more complicated and need special consideration.
The energy-dependent absorption of -ray can be described as , where is the optical depth for -ray in energy E. Similar to previous work (Zhang et al., 2006; Moskalenko et al., 2006), can be described in the source region as
| (2) | |||||
where is the energy of the ISRF photon, is the pair production cross section and can be precisely derived (Gould & Schréder, 1967). Then the attenuation is only dependent on the the differential number density and the size of the ISRF region with the value of 2 pc.
The average photon intensity at the far-infrared band from the GC region has been measured by Herschel PACS and SPIRE (Etxaluze et al., 2011) and can be defined as . In the traditional way, the attenuation of -rays is calculated by adopting this homogeneous radiation field. In fact, the radiation field can be described by the point source formula, as . So the photon density in the GC region can be approximately estimated as . However, the radiation field is very clumpy with a VFF (denoted as ). We can consider the effect of the clumpy structure by replacing . Under such situation, the photon density in the clumpy structure should be corrected to and the corresponding integration of is the radius of the clumpy structure as . In this work, the attenuation of -rays is calculated by adopting this enhanced differential number density . So compared with the traditional calculation, the absorption should be enlarged by a factor of after considering the VFF based on Equation 2. One special case of our model is that the -rays are produced in the very center of the GC and the attenuation is similar to the work (Aharonian & Neronov, 2005; Celli et al., 2016).
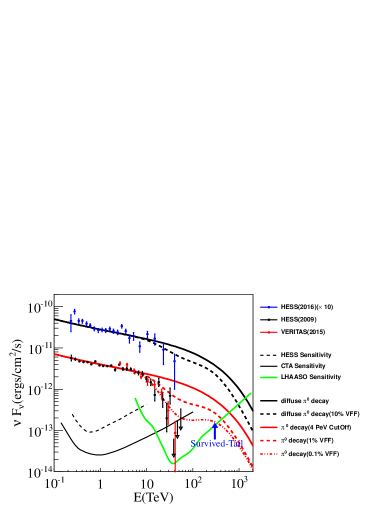
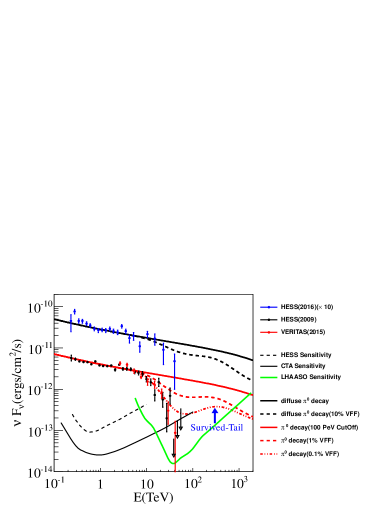
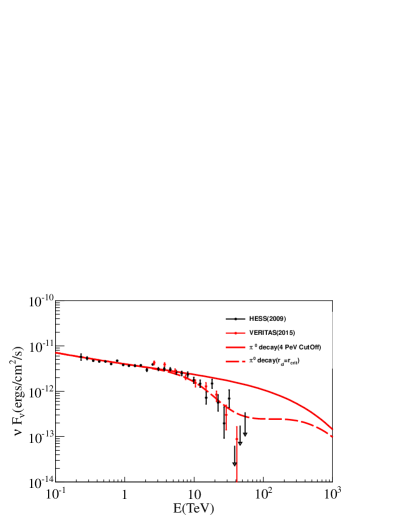
Fig.2 shows the attenuation with different VFFs. In this calculation, the injection spectrum of protons is assumed as a power law with a break energy at 4 PeV (left panel of Fig.2) and 100 PeV (right panel of Fig.2). The break energy reflects the maximum energy that protons can achieve in the GC activity. The choice of 4 PeV originates from the knee position of all particle spectra and 100 PeV comes from the newest observation of light nuclei (Buitink et al., 2016). The spectral index is assumed to be 2.3 for both point and diffuse one. The total energy and erg is fixed for the point and diffuse one respectively. The gas density is adopted after considering the VFF, which keeps the same amount as the above calculation with an average density of . It is clear that the attenuation effect can be significantly enlarged in case of the VFF. Taking into account the newly estimated photon density and by adopting a VFF of about , the observed spectrum from the point source of GC can be well described. Away from the GC, the VFF will grow, which leads to the weaker of ISRF. In the diffuse emission of the GC, a similar calculation is performed with VFF, which is roughly consistent with the observation. The typical features of a surviving tail is expected at 100 TeV for the point source. We hope that the high precise measurements of the -ray spectrum from TeV to hundreds of TeV will be performed by future projects, such as CTA (CTA Consortium, 2011) and LHAASO (Cao, 2010), and can give the ultimate answer to our model.
2.3. Neutrino emission
When the observed -rays are mainly from the decay of the neutral pions which are the products of hadronic interaction between CRs and the ambient gas, a similar amount of neutrinos are expected to be produced from the charged pion decay. The -ray spectrum may be distorted by the absorption interaction, and neutrinos can carry the spectrum of the parent CR interaction. The neutrino spectrum can thus provide decisive information to distinguish whether intrinsic acceleration or absorption of the ISRF should be responsible for the cutoff spectrum of the -rays.
On average, -collisions an produce equal number of neutral pion and charged pion. Each neutral pion decays to a pair of -rays and each charged pion decays into two muon neutrinos and one electron neutrino. The initial neutrino flux ratio is approximately = 1:2:0 from charged pion decay. However, the flavor ratio is close to = 1:1:1 at the Earth after vacuum oscillation through traversal of astrophysical distances. So the typical energy of the neutrino() coming from charged pion decay is 0.5 of the -ray energy from neutral pion decay.
High-energy neutrinos can be detected by neutrino telescopes which use either ice or water as target and detector medium. Neutrinos undergo charge current or neutral current interaction with target matter and produce leptons inside the detector (as a contained event) or in the vicinity of the detector (through-going event). The high-energy muons can generate Cerenkov light while electrons and tau particles may develop to shower which can also generate Cerenkov light for further detection.
There are two modes of muon event rates: one is the contained event, and the other is the through-going event. The contained event is described as the interaction for neutrinos with nucleons inside the detector and given by (Gandhi et al., 1996, 1998; Gonzalez-Garcia et al., 2005; Kistler & Beacom, 2006)
| (3) |
where is the detector volume, which is adopted to be 1 km3; is the high-energy cutoff of the neutrino spectrum; the term = takes into account observation time (T), normalization of the muon spectrum, and the molar density of water (KM3Net) or ice (IceCube). The through-going event is described as the interaction for neutrinos with nucleons outside the detector and is given by (Gandhi et al., 1996, 1998; Gonzalez-Garcia et al., 2005; Kistler & Beacom, 2006)
| (4) |
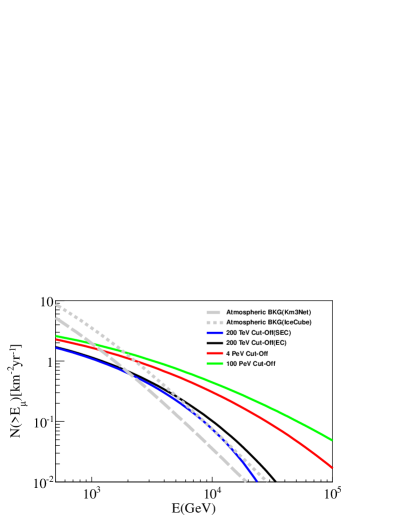
Based on the above formula, the total muon event number is calculated for the KM3Net experiment. As shown in Fig.3, it is obvious that the KM3Net has the potential ability to observe GC neutrinos with a few years of operation when the break energy of the protons is more than PeV. On the contrary, if the break energy of the protons is at 200 TeV, the GC neutrino events can not be separated from atmospheric neutrino background. The observation years to reach a 3 significance level for different cases are estimated and listed in Table 1.
| Mode | yrs(3) | |||
|---|---|---|---|---|
| 200 TeV energy | 1 | 1.04 | 1.90 | 29.6 |
| cut-off | 5 | 0.26 | 0.13 | 35.2 |
| 10 | 0.11 | 0.03 | 56.4 | |
| 4 PeV energy | 1 | 1.65 | 1.90 | 12.1 |
| cut-off | 5 | 0.57 | 0.13 | 10.0 |
| 10 | 0.3 | 0.03 | 6.9 | |
| 100 PeV energy | 1 | 1.92 | 1.90 | 8.9 |
| cut-off | 5 | 0.75 | 0.13 | 5.1 |
| 10 | 0.45 | 0.03 | 5.7 |
3. Discussion
The open question is how to distinguish the production mechanism of the -ray cutoff between the intrinsic acceleration ability of CRs and the attenuation of the ISRF. One possible way is to observe the typical feature of the surviving tail. The other effective way is to find an instance of the clumpy structure. If the line shape of the calculated spectrum of -ray emission in the clumpy structure is consistent with the result observed by the HESS experiment, this can further support our model of adopting the VFF.
In the central region, the minispiral is a region with a stellar population cluster and density structure, which consists of four main components: the northern arm, the western arc, the eastern arm and the bar (Kunneriath et al., 2012). In those streamers, it is very bright in the near-infrared wave band and possible -collision regime. Recently, ALMA has also observed some separated clumpy structures (Yusef-Zadeh et al., 2013). We take clump 3 as an instance of the clumpy structure to estimate the attenuation of high-energy -rays. The clumps in the vicinity of the GC are exposed to strong tidal forces that tend to disrupt the clouds, except that the self-gravity is large enough to overcome the tidal shear. The tidal limit for the clump mass and the clump radius is given (Mathews & Murray, 1987; Vollmer & Duschl, 2001a):
| (5) |
where is the derivative of , and is the clump’s distance to the GC. The mass distribution can be defined as , where and pc-1.25. Consider =0.12 pc, 30 M⊙, the critical clump radius AU. In this calculation, we take the critical radius as the clump size. In addition, the radiation field of clump 3 is given by the ALMA experiment (Yusef-Zadeh et al., 2013). The attenuation of -rays can be estimated based on Equation 2 as shown in Figure 4. It is obvious that our calculation of the -ray spectrum is consistent with the HESS observation line shape. This further gives the possibility that the enhanced density of photons by the VFF leads to the cutoff of the -ray spectrum for the GC point source.
In addition, the overall behavior of the GC is quite silent now, except for some continuous weak activities (Becklin et al., 1982; Davidson et al., 1992; Dodds-Eden et al., 2009, 2011; Yuan & Wang, 2016). It is obvious that such weak activities cannot supply enough energy to satisfy the power requirement of the -ray emission observed by the HESS experiment. However, there is sufficient evidence to prove that the GC had the violent activities in the past, such as X-ray outbursts (Clavel et al., 2013) and Fermi-Bubbles (Su et al., 2010). The HESS Collaboration also proposed that the activity should operate for about 1000 years to satisfy their observations. In our calculation, we also think that such past activity supplied the required the power required to accelerate the protons to PeV energy.
4. Conclusion
The GC is a unique laboratory for studying the origin, acceleration, and propagation of CRs. Considering the inhomogeneous distribution of the ISRF in the GC, -ray absorption is found to be enhanced largely. If the VFF of the clumpy structure is assumed to be 0.1, the absorption of the -rays can lead to the sharp cut-off at about tens of TeV and a ”survived-tail” at about 100 TeV and sharp cutoff for -ray spectrum are expected. Away from GC, the VFF grows up and the attenuation becomes less important. The ”surviving tail” as the tagged feature can be observed by future projects, such as CTA and LHAASO. High-energy neutrino detection is crucial in distinguishing whether the absorption or the intrinsic acceleration is the cause of the -ray spectrum cutoff. If our model is right, the KM3Net experiment will reach a 3 observation for multi-TeV muon track neutrinos in about years of observation. Owing to the higher background numbers of atmospheric neutrinos for IceCube than KM3Net, the sensitivity to GC region for IceCube is a little lower than for KM3Net (Aartsen et al., 2014). More years of operation would be required for the IceCube experiment to reach a 3 significance level of observation.
Acknowledgements
We thank Prof. Hong-Bo Hu and Qiang Yuan for helpful discussion. This work is supported by the Ministry of Science and Technology of China, Natural Sciences Foundation of China (11405182, 11135010, 11663006, 11647311)
Note added:At the same time, a similar study was submitted that draws a consistent conclusion concerning gamma ray absorption (Celli et al., 2016).
References
- Aartsen et al. (2013) Aartsen, M. G., Abbasi, R., Abdou, Y., et al. 2013, Physical Review Letters, 111, 021103
- Aartsen et al. (2014) Aartsen, M. G., Ackermann, M., Adams, J., et al. 2014, ApJ, 796, 109
- Aharonian & Neronov (2005) Aharonian, F., & Neronov, A. 2005, ApJ, 619, 306
- Aharonian et al. (2004) Aharonian, F., Akhperjanian, A. G., Aye, K.-M., et al. 2004, A&A, 425, L13
- Aharonian et al. (2006a) Aharonian, F., Akhperjanian, A. G., Bazer-Bachi, A. R., et al. 2006a, Nature, 439, 695
- Aharonian et al. (2006b) —. 2006b, Physical Review Letters, 97, 221102
- Aharonian et al. (2008) Aharonian, F., Akhperjanian, A. G., Barres de Almeida, U., et al. 2008, A&A, 492, L25
- Aharonian et al. (2009) Aharonian, F., Akhperjanian, A. G., Anton, G., et al. 2009, A&A, 503, 817
- Ahlers & Murase (2014) Ahlers, M., & Murase, K. 2014, Phys. Rev. D, 90, 023010
- Albert et al. (2006) Albert, J., Aliu, E., Anderhub, H., et al. 2006, ApJ, 638, L101
- Bai et al. (2014) Bai, Y., Barger, A. J., Barger, V., et al. 2014, Phys. Rev. D, 90, 063012
- Becklin et al. (1982) Becklin, E. E., Gatley, I., & Werner, M. W. 1982, ApJ, 258, 135
- Buitink et al. (2016) Buitink, S., Corstanje, A., Falcke, H., et al. 2016, Nature, 531, 70
- Cao (2010) Cao, Z. 2010, Chinese Physics C, 34, 249
- Celli et al. (2016) Celli, S., Palladino, A., & Vissani, F. 2016, ArXiv e-prints, arXiv:1604.08791
- Chernyakova et al. (2011) Chernyakova, M., Malyshev, D., Aharonian, F. A., Crocker, R. M., & Jones, D. I. 2011, ApJ, 726, 60
- Clavel et al. (2013) Clavel, M., Terrier, R., Goldwurm, A., et al. 2013, A&A, 558, A32
- CTA Consortium (2011) CTA Consortium, T. 2011, ArXiv e-prints, arXiv:1111.2183
- Davidson et al. (1992) Davidson, J. A., Werner, M. W., Wu, X., et al. 1992, ApJ, 387, 189
- Dodds-Eden et al. (2009) Dodds-Eden, K., Porquet, D., Trap, G., et al. 2009, ApJ, 698, 676
- Dodds-Eden et al. (2011) Dodds-Eden, K., Gillessen, S., Fritz, T. K., et al. 2011, ApJ, 728, 37
- Eatough et al. (2013) Eatough, R. P., Falcke, H., Karuppusamy, R., et al. 2013, Nature, 501, 391
- Etxaluze et al. (2011) Etxaluze, M., Smith, H. A., Tolls, V., Stark, A. A., & González-Alfonso, E. 2011, AJ, 142, 134
- Fryer et al. (2007) Fryer, C. L., Liu, S., Rockefeller, G., Hungerford, A., & Belanger, G. 2007, ApJ, 659, 389
- Fujita et al. (2015) Fujita, Y., Kimura, S. S., & Murase, K. 2015, Phys. Rev. D, 92, 023001
- Fujita et al. (2016) Fujita, Y., Murase, K., & Kimura, S. S. 2016, ArXiv e-prints, arXiv:1604.00003
- Gandhi et al. (1996) Gandhi, R., Quigg, C., Hall Reno, M., & Sarcevic, I. 1996, Astroparticle Physics, 5, 81
- Gandhi et al. (1998) Gandhi, R., Quigg, C., Reno, M. H., & Sarcevic, I. 1998, Phys. Rev. D, 58, 093009
- Genzel et al. (1985) Genzel, R., Crawford, M. K., Townes, C. H., & Watson, D. M. 1985, ApJ, 297, 766
- Giler (1983) Giler, M. 1983, Journal of Physics G Nuclear Physics, 9, 1139
- Gonzalez-Garcia et al. (2005) Gonzalez-Garcia, M. C., Halzen, F., & Maltoni, M. 2005, Phys. Rev. D, 71, 093010
- Gould & Schréder (1967) Gould, R. J., & Schréder, G. P. 1967, Physical Review, 155, 1404
- Guesten et al. (1987) Guesten, R., Genzel, R., Wright, M. C. H., et al. 1987, ApJ, 318, 124
- Guo et al. (2013a) Guo, Y.-Q., Feng, Z.-Y., Yuan, Q., Liu, C., & Hu, H.-B. 2013a, New Journal of Physics, 15, 013053
- Guo et al. (2014) Guo, Y. Q., Hu, H. B., Yuan, Q., Tian, Z., & Gao, X. J. 2014, ApJ, 795, 100
- Guo et al. (2013b) Guo, Y.-Q., Yuan, Q., Liu, C., & Li, A.-F. 2013b, Journal of Physics G Nuclear Physics, 40, 065201
- HESS Collaboration et al. (2016) HESS Collaboration, Abramowski, A., Aharonian, F., et al. 2016, Nature, 531, 476
- IceCube Collaboration (2013) IceCube Collaboration. 2013, Science, 342, 1242856
- Jackson et al. (1993) Jackson, J. M., Geis, N., Genzel, R., et al. 1993, ApJ, 402, 173
- Kimura et al. (2015) Kimura, S. S., Murase, K., & Toma, K. 2015, ApJ, 806, 159
- Kistler & Beacom (2006) Kistler, M. D., & Beacom, J. F. 2006, Phys. Rev. D, 74, 063007
- Kosack et al. (2004) Kosack, K., Badran, H. M., Bond, I. H., et al. 2004, ApJ, 608, L97
- Kunneriath et al. (2012) Kunneriath, D., Eckart, A., Vogel, S. N., et al. 2012, A&A, 538, A127
- Linden et al. (2012) Linden, T., Lovegrove, E., & Profumo, S. 2012, ApJ, 753, 41
- Markoff et al. (2001) Markoff, S., Falcke, H., Yuan, F., & Biermann, P. L. 2001, A&A, 379, L13
- Mathews & Murray (1987) Mathews, W. G., & Murray, S. D. 1987, ApJ, 312, 66
- Moskalenko et al. (2006) Moskalenko, I. V., Porter, T. A., & Strong, A. W. 2006, ApJ, 640, L155
- Ptuskin & Khazan (1981) Ptuskin, V. S., & Khazan, Y. M. 1981, AZh, 58, 959
- Said et al. (1981) Said, S. S., Wolfendale, A. W., Giler, M., & Wdowczyk, J. 1981, International Cosmic Ray Conference, 2, 344
- Smith & for the VERITAS Collaboration (2015) Smith, A. W., & for the VERITAS Collaboration. 2015, ArXiv e-prints, arXiv:1508.06311
- Su et al. (2010) Su, M., Slatyer, T. R., & Finkbeiner, D. P. 2010, ApJ, 724, 1044
- Tsuchiya et al. (2004) Tsuchiya, K., Enomoto, R., Ksenofontov, L. T., et al. 2004, ApJ, 606, L115
- Vollmer & Duschl (2001a) Vollmer, B., & Duschl, W. J. 2001a, A&A, 367, 72
- Vollmer & Duschl (2001b) —. 2001b, A&A, 377, 1016
- Vollmer & Duschl (2002) —. 2002, A&A, 388, 128
- Yuan & Wang (2016) Yuan, Q., & Wang, Q. D. 2016, MNRAS, 456, 1438
- Yusef-Zadeh et al. (2013) Yusef-Zadeh, F., Royster, M., Wardle, M., et al. 2013, ApJ, 767, L32
- Zhang et al. (2006) Zhang, J.-L., Bi, X.-J., & Hu, H.-B. 2006, A&A, 449, 641