11email: patricia.tissera@unab.cl 22institutetext: Millennium Institute of Astrophysics, Chile. 33institutetext: Institute of Astronomy, Av. Vicuña Mackena, Pontificia Universidad Católica de Chile. 44institutetext: Instituto de Astronomía y Física del Espacio, CONICET-UBA, Casilla de Correos 67, Suc. 28, C1428ZAA, Ciudad Autónoma de Buenos Aires, Argentina. 55institutetext: Instituto de Astronomía, Universidad Nacional Autónoma de México, A.P. 70-264, 04510 México D.F., Mexico 66institutetext: School of Physics, Korea Institute for Advanced Study, 85 Hoegiro, Dongdaemun-gu, Seoul 02455, Republic of Korea 77institutetext: Instituto de Astrofísica de Andalucía (CSIC), Glorieta de la Astronomía s/n, E-18008 Granada, Spain.
The stellar metallicity gradients in galaxy discs
in a cosmological scenario
Abstract
Context. The stellar metallicity gradients of disc galaxies provide information on the disc assembly, star formation processes and chemical evolution. They also might store information on dynamical processes which could affect the distribution of chemical elements in the gas-phase and the stellar components. Understanding their joint effects within a hierarchical clustering scenario is of paramount importance.
Aims. We studied the stellar metallicity gradients of simulated discs in a cosmological simulation. We explored the dependence of the stellar metallicity gradients on stellar age and the size and mass of the stellar discs.
Methods. We used a catalogue of galaxies with disc components selected from a cosmological hydrodynamical simulation performed including a physically-motivated Supernova feedback and chemical evolution. Disc components were defined based on angular momentum and binding energy criteria. The metallicity profiles were estimated for stars with different ages. We confront our numerical findings with results from the CALIFA Survey.
Results. The simulated stellar discs are found to have metallicity profiles with slopes in global agreement with observations. Low stellar-mass galaxies tend to have a larger variety of metallicity slopes. When normalized by the half-mass radius, the stellar metallicity gradients do not show any dependence and the dispersion increases significantly, regardless of the galaxy mass. Galaxies with stellar masses around M⊙ show steeper negative metallicity gradients. The stellar metallicity gradients correlate with the half-mass radius. However, the correlation signal is not present when they are normalized by the half-mass radius. Stellar discs with positive age gradients are detected to have negative and positive metallicity gradients, depending on the relative importance of the recent star formation activity in the central regions.
Conclusions. Our results suggest that the inside-out formation is the main process reponsible for the metallicity and age profiles. The large dispersions in the metallicity gradients as a function of stellar mass could be ascribed to the effects of dynamical processes such as mergers/interactions and/or migration as well as those regulating the conversion of gas into stars. The fingerprints of the inside-out formation seem better preserved by the stellar metallicity gradients as a function of the half-mass radius.
Key Words.:
galaxies: abundances, galaxies: evolution, cosmology: dark matter1 Introduction
Chemical patterns such as the mass-metallicity relation, the age-metallicity relation and the metallicity gradients store relevant information on the history of galaxy assembly. Among them, observational results show that slope of the gas-phase metallicity gradients correlates with stellar mass if expressed in but that this correlation is erased if the metallicity gradients are renormalized by adopting a characteristic scale-length for the disc component (e.g. Garnett et al. 1997; Sánchez et al. 2014; Ho et al. 2015; Sánchez-Menguiano et al. 2016). Similar results are found for discs formed in hydrodynamical cosmological simulations (Tissera et al. 2016) and by using analytical models (Prantzos & Boissier 2000; Ho et al. 2015). Both observational and theoretical results favour the existence of metallicity gradients the origin of which would be linked to the joint action of gas outflows and inflows which regulate the star formation activity and the chemical abundances (e.g. Chiappini et al. 2001; Mollá & Díaz 2005; Gibson et al. 2013; Mott et al. 2013). However, an important fraction of the synthesized chemical elements is locked into stellar populations (SPs) as the gas is transformed into stars. Hence, the chemical abundances of the SPs provide complementary information to understand the chemical loop between the gas-phase medium and the SPs within a context of galaxy formation (e.g. Calura et al. 2012; Tissera et al. 2012).
Most observational studies are devoted to the gas-phase abundances in discs traced by HII regions since the study of the chemical properties of the underlying SPs is more difficult. Estimations for the Milky Way and some nearby galaxies suggested the existence of negative metallicity slopes (e.g. Bland-Hawthorn & Freeman 2003; Carraro et al. 2007; Hughes et al. 1994; Kudritzki et al. 2008). The metallicity properties of the SPs in galaxies outside the Local Group have been studied by using colour distributions. In these works, the colour gradients are interpreted as the result of the contribution of younger and less enriched stars to the outer parts (e.g. de Jong 1996; MacArthur et al. 2004; Muñoz-Mateos et al. 2007). 2D observations of nearby galaxies with detailed information on the age and metallicities of the stellar populations are being gathered. As a result, more robust properties of the SPs in nearby galaxies are available (e.g. Rosales-Ortega et al. 2010). In particular, Sánchez-Blázquez et al. (2014) reported normalized metallicity gradients of SPs in the disc components for a set of face-on Spirals in the CALIFA survey. Similar to the results reported for the gas-phase normalized metallicity gradients (Sánchez et al. 2014), the SP normalized metallicity slopes were not found to correlate with the global properties of galaxies such as stellar mass or luminosity. A weak trend for the old stellar population ( Gyr) to show steeper metallicity gradients than younger ones ( Gyr) was reported. The metallicity and age gradients of galaxies with a variety of morphology are analysed by González Delgado et al. (2015). These authors also find a dependence of both gradients on stellar mass (or the potential well). In particular they found that Spiral galaxies have negative metallicity and age profiles in agreement with an inside-out formation. For disc-dominated galaxies, they identified the steeper negative metallicity slopes to take place for intermediate stellar mass galaxies (Mollá & Díaz 2005).
The metallicity gradients of the SPs are the result of the combination of stars formed at different epochs from gas in the interstellar medium (ISM) which have different physical and chemical properties. Disentangling their contributions is a complex task, albeit crucial to build up a comprehensive understanding of how star formation, chemical production and mixing take place in galaxies. Mergers and interactions are known to be efficient mechanisms to redistribute angular momentum and as a consequence they could affect the metallicity distribution of the gas and stars. The action of migration has been also claimed to be important in shaping the metallicity gradients, flattening the abundance profiles of the SPs, principally of the old ones (e.g. Friedli et al. 1994; Roškar et al. 2008; Di Matteo et al. 2013). However, more realistic simulations where the vertical velocity of the stars is taken into account, suggest that strong migration might be prevented (Minchev et al. 2014).
In the current cosmological paradigm, galaxy formation is a complex process which involves the action of different physical mechanisms acting with different temporal and spatial scales. In this context, hydrodynamical simulations which include chemical evolution are powerful tools to study the relation between chemical patterns and the history of galaxy assembly (e.g. Mosconi et al. 2001; Scannapieco et al. 2006; Tissera et al. 2012; Vogelsberger et al. 2014; Schaye et al. 2015). Similarly, chemodynamical models have extensively analysed the formation of metallicity gradients in disc galaxies (e.g. Chiappini et al. 1997; Mollá et al. 1997; Ho et al. 2015). Within a hierarchical clustering scenario, different mechanisms play a role in the assembly history of galaxies, however most numerical works suggest the inside-out formation for the disc components (Scannapieco et al. 2009; Brook et al. 2012; Few et al. 2012; Minchev et al. 2014). Particularly, Pilkington et al. (2012) analysed the metallicity gradients of the young stellar populations as tracers of the gas-phase metallicity, finding that the efficiency of star formation as a function of radius was a main factor determining the metallicity gradients. And as expected, different Supernova (SN) feedback models produced different results (Gibson et al. 2013; Snaith et al. 2013). Tissera et al. (2016) analysed the metallicity gradients of the gas-phase of the same set of simulated galaxies analyzed in our work. They detected a trend for the gas-phase metallicity slopes to correlate with stellar mass. These authors found a relationship between the efficiency of star formation and the slope of the gas-phase metallicity profile in agreement with the observations of Stott et al. (2014). According to detailed numerical simulations of prepared merger events, these relationships could be the result of the action of violent events in the regulation of the star formation and chemical mixing (Tissera et al. 2016, and Sillero in preparation).
In this work, we focused on the study of the metallicity gradients of the SPs in the disc components of the same simulated galaxies whose gas-phase components were analysed by Tissera et al. (2016) in the redshift range [0,2). We use the 12 +log O/H abundance ratios and explore correlations with other physical parameters such as the stellar mass and the half-mass radius. We also extended the analysis of the metallicity gradients for SPs with different ages. We performed this analysis with a two-fold goal: searching for clues for galaxy formation and setting contraints on our galaxy formation model.
The paper is organized as follows. Section 2 explains the main characteristics of the numerical models and the galaxy catalogue. Section 3 is dedicated to the analysis of the SP metallicity gradients. Conclusions summarizes the main findings.
2 Numerical Experiments
We analysed the stellar disc components of simulated galaxies selected from a cosmological simulation performed with a version of the code GADGET-3, an update of GADGET-2 (Springel 2005), optimized for massive parallel simulations of highly heterogeneous systems. This version includes treatments for metal-dependent radiative cooling, stochastic star formation (SF), chemical enrichment, and the multiphase model for the ISM and the SN feedback scheme of Scannapieco et al. (2005, 2006). The SN feedback model is able to successfully trigger galactic mass-loaded winds without introducing mass-scale parameters.
Our code considered energy feedback by Type II (SNII) and Type Ia (SNIa) Supernovae. These processes are grafted into a multiphase model for the ISM described in detail by Scannapieco et al. (2006). Briefly, the energy released by each SN event is distributed between the cold and the hot phases of the simulated ISM. The adopted ISM multiphase model allows the coexistence of diffuse and denses gas phases. In this model, each gas particle defines the cold and hot phases by using a local entropy criteria. This scheme allows particles to decouple hydrodynamically from particular low-entropy ones if they are not part of a shock front. Each cold gas particle stores the SN energy received from nearby SN events until it fullfils the conditions to join their local hot phase. It is worth mentioning that this SN feedback scheme does not include parameters that depend on the global properties of the given galaxy (e.g. the total mass, size) thus making it suitable for cosmological simulations, where systems with different masses form in a complex way. The SN energy is equally distributed between the cold and hot gas-phases, surrounding a stellar source.
As mentioned in the Introduction, we analysed the SPs of the simulated disc components whose gas-phase medium was studied by Tissera et al. (2016). They were selected from the so-called S230D simulation, whose initial conditions are consistent with the concordance model with , , , a normalization of the power spectrum of and , with . The simulated volume represents a box of Mpc comovil side, resolved with initial particles, achieving a mass resolution of and for the dark matter and initial gas particles, respectively. The gravitational softening is kpc. We acknowledge the fact that the initial condition represents a small volume of the Universe. It was chosen to represent a typical region, with no large structure nearby. De Rossi et al. (2013) verified that the growth of the haloes was well-reproduced by confronting the halo mass function with those obtained from the Millennium simulation (Fakhouri et al. 2010).
Simulation S230D used a high gas density threshold for the star formation and an energy per SN event of erg. This combination diminishes the over transformation of gas into stars at very high redshift. Simulation S230D injects per cent of the new synthesized chemical elements into the cold phase (the remaining is pumped directly into the hot phase). Our code also includes the chemical evolution model developed by Mosconi et al. (2001). SNII and SNIa events contribute with chemical elements estimated by adopting the chemical yields of Woosley & Weaver (1995) and Iwamoto et al. (1999), respectively. Note that we follow twelve individual chemical elements (such as 16O, 56Fe) and that SNII yields are metallicity dependent (Mosconi et al. 2001).
2.1 The simulated galaxy sample
The simulated galaxy sample was constructed by using a Friends-of-Friends algorithm to identify the virialized structures. Then the substructures were selected by using the SUBFIND scheme (Springel et al. 2001). In order to identify the disc components, we used the angular momentum content of each particle defined as , where is the angular momentum component in the direction of the total angular momentum, and is the maximum over all particles at a given binding energy, . The details are explained in Tissera et al. (2012) and Pedrosa & Tissera (2015) We considered star particles with higher than to be part of the stellar disc. The star particles that did not satisfy this requirement were taken to belong to the spheroidal component and are not analysed in this paper. We do not distinguish between thin and thick discs. They are both included in the analysed stellar disc components. To diminish resolution issues, we restricted our study to systems with a number of star particles larger than in the disc components. With this criterium, 37 galaxies were selected at .
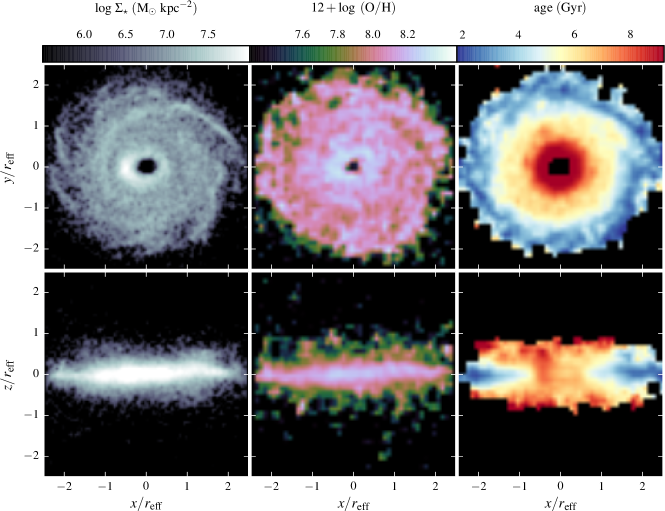
For illustration purposes, in Fig. 1 we show face-on and edge-on projected distributions of the stellar mass, the oxygen abundances and the stellar ages for one of the simulated disc components. The bulge has been extracted by applying the procedure described above. From this figure, we can see that existence of spiral arms which are populated mainly by young stars. In this example, there are clear age and metallicity profiles, although there are also local inhomogenities, revealing a complex structure which varies from system to system.
The simulated galaxies analysed in this paper were also studied by Pedrosa & Tissera (2015). These authors focused on the angular momentum content of the discs and bulges components, finding that the simulated galaxies are able to reproduce observed trends reported by Romanowsky & Fall (2012). Hence, we expect the sizes of the simulated galaxies to be in agreement with observations. Tissera et al. (2016) studied the gas-phase metallicity gradients of the same galaxies we analyse in this paper, in relation to the specific star formation of the galaxies. These authors reported that these galaxies reproduced observational trends at . In agreement with observations, Tissera et al. (2016) showed that simulated gas-phase metallicity slopes of these low stellar-mass galaxies exhibit a larger variety. As a function of redshift these authors found an increasing fraction of gas-phase metallicity profiles with negative slopes (dex kpc-1 in galaxies with M). More massive galaxies showed larger frequency of positive metallicity slopes for higher redshifts.
We use the CALIFA sample of Sánchez-Blázquez et al. (2014) to confront the simulated trends at since it is a self-consistent sample and the stellar mass range covered is similar to our simulated mass range. For the purpose of comparison, we use the mass-weighted metallicity gradients. We note that the observed half-mass radii are defined from the surface luminosity distributions while we use the half-mass radius of the stellar disc components. This should be bore in mind when comparing the normalized gradients.
3 Metallicity and age gradients of the SPs
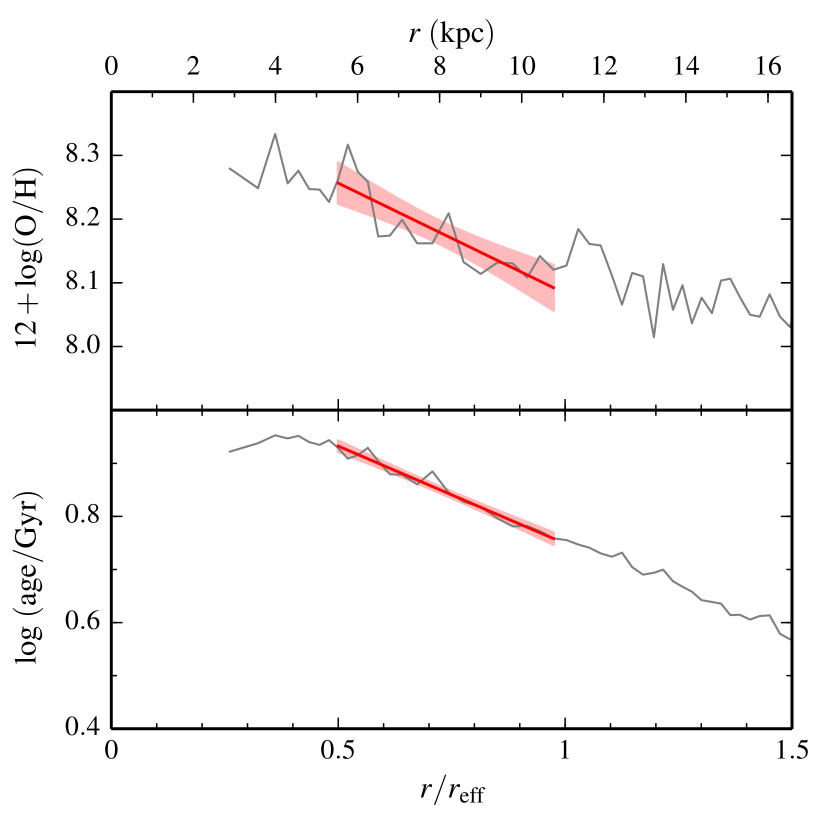
We estimated the radial abundance gradients and age profiles of the disc SP. We performed linear regression fits to the profiles in the range where is the radius which enclosed half the stellar mass of the disc components. We find that this radial region provides stable and good fits for our profiles and it is within the radial range chosen by Sánchez-Blázquez et al. (2014) for the analysis of the SP gradients in a set of face-on spiral galaxies of the CALIFA survey which will be used to compare with our simulated data. This is also the spatial range adopted to fit the gas-phase metallicity gradients by Tissera et al. (2016). The linear regressions are performed by applying a bootstrap technique. In Fig. 2 we show the metallicity and age profiles (upper and lower panels, respectively) for the same galaxy depicted in Fig. 1. The goodness of the fittings are shown by the shaded areas (95 per cent confidence bands).
3.1 Metallicity gradients
Figure 3 displays the metallicity slopes in units of dex kpc-1 (upper panel) and the renormalized ones by using (lower panel) as a function of the stellar mass of the galaxies. For comparison, we also include the observational estimations reported by Sánchez-Blázquez et al. (2014).
In order to quantify a possible dependence on the stellar mass, we define two subsamples by adopting the stellar mass limit, M, similarly to the analysis carried out by Tissera et al. (2016) for the gas-phase metallicity profiles. From Fig. 3 and Table 1, we can see that the non-normalized metallicity slopes show a very weak dependence on stellar mass. Galaxies in the low-stellar mass subsample have a median metallicity slope of while those in the high-stellar mass subsample have . The median slopes and errors have been estimated by applying a bootstrap resampling technique. In Table 1 we also include the standard dispersions. The most significant variation with stellar mass is the increase of the dispersion of the metallicity slopes measured in the low stellar-mass galaxies.
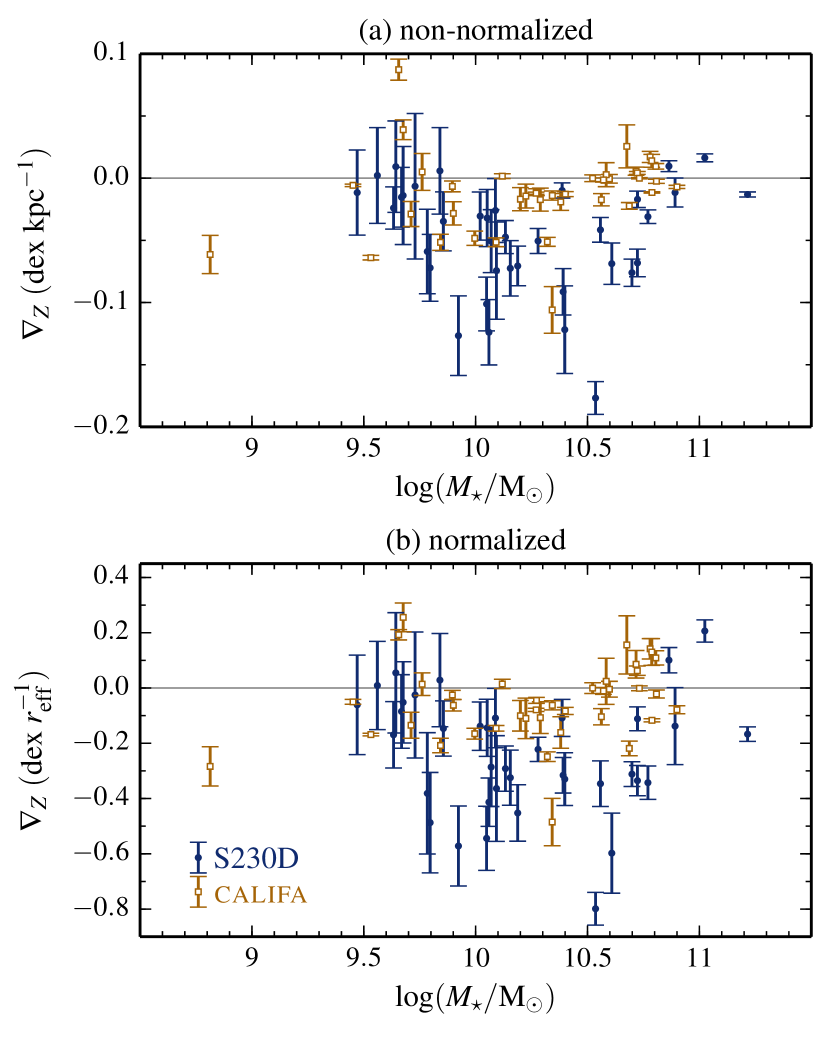
Similar estimations for the normalized SP metallicity gradients have been carried (). As can be seen from the lower panel of from Fig. 3, there is no dependence on stellar mass and the dispersion increases significantly for all galaxies (Table 1). It is also interesting to note that there are galaxies with normalized metallicity profiles with positive slopes at the two extreme of the stellar-mass range. And a similar behaviour is also present for the CALIFA slopes. In the case of those at the lower mass end, the fittings have a larger dispersion. The Spearman test of correlation yields no signal of correlation for both distributions ( for the non-normalized relation and ( for the normalized relation). We note that the gas-phase metallicity gradients of these simulated galaxies show clear trends with stellar mass as reported by Tissera et al. (2016). The weakness of the signal could be due to the action of dynamical processes or different star formation efficiencies. The SN feedback adopted for this simulation is able to regulate the transformation of gas into stars naturally in different potential wells (de Rossi et al. 2010). Interestly, the simulated discs are able to reproduce a trend to have the steeper negative metallicity gradients for masses around as shown by Sánchez-Blázquez et al. (2014) and González Delgado et al. (2015) (see also Mollá & Díaz 2005, for similar results by using analytical models.). De Rossi et al. (2013) showed that there is a change in the effects of the SN feedback around this stellar mass due to combined effects of the SN strengths and the potential well of the systems. These changes affect the gas cooling time, star formation activity and the amount of metals ejected in galactic winds. We speculate that these processes might also leave an imprint in the chemical gradients. A large stastistical sample is needed to confirm these trends.
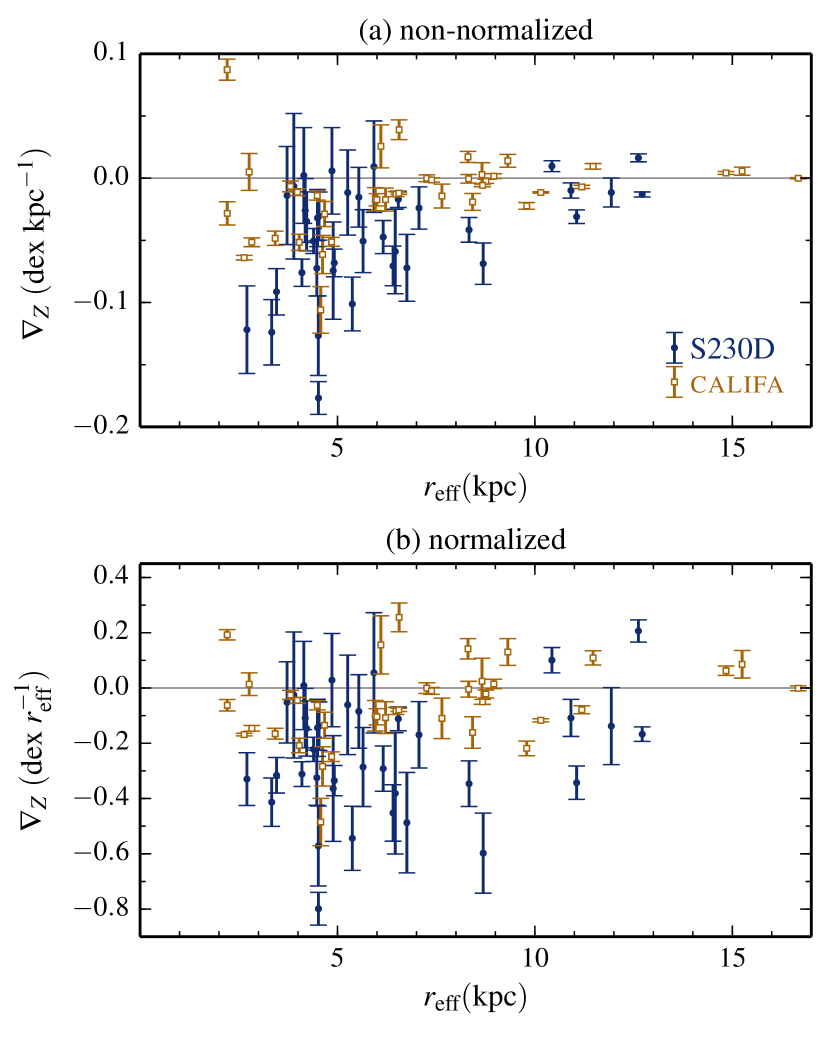
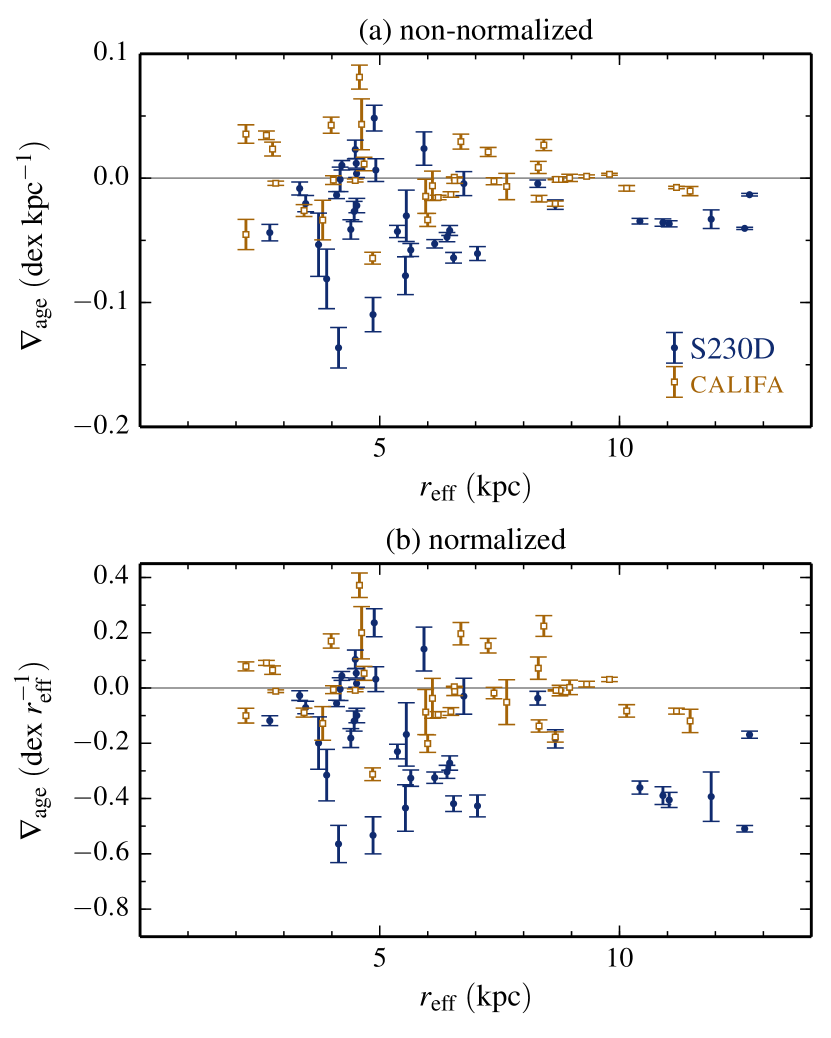
Prantzos & Boissier (2000, see also ()) reported a correlation of the metallicity gradients of the gas-phase with the which got erased if the gradients were normalized by a characteristic scale-length. In order to test the existence of such a correlation for the simulated SPs, we show in Fig. 4 the relation for the simulated discs. In this case, we find a clearer signal of correlation for the non-normalized gradients: . The correlation signal significantly decreases for the normalized gradients: .
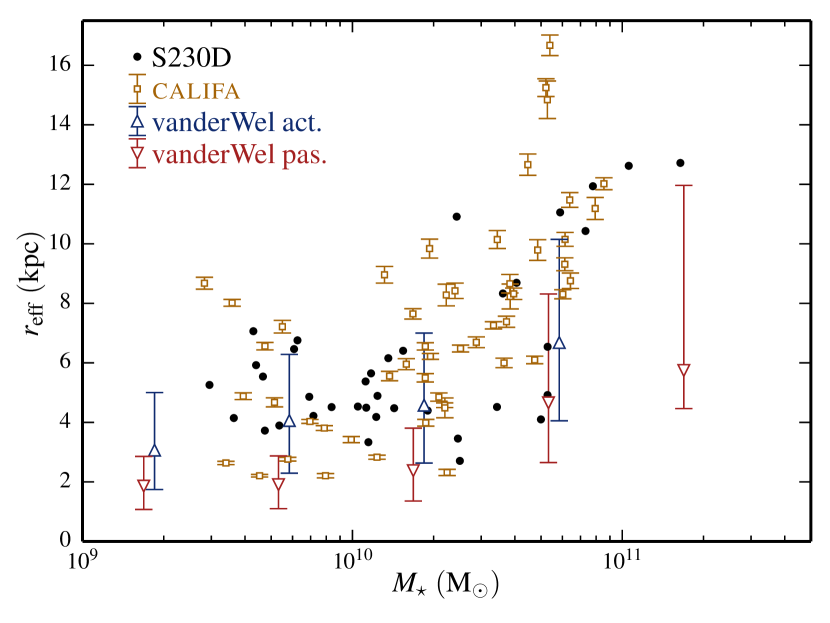
Since the characteristic radius seems to play an important role, it is important to show that the simulated are in agreement with observations. In Fig. 5 we display them a function of stellar mass together with recent observations by van der Wel et al. (2014) and Sánchez-Blázquez et al. (2014). As it can be seen from this plot, the mean values are consistent with observations by van der Wel et al. (2014) within a standard deviation for late-type galaxies as expected since most of our galaxies have active star formation (Tissera et al. 2016). However, at the more massive end, our simulated systems show larger values than the reported averages. The simulated are in very good agreement with those estimated from the CALIFA survey111 We also fitted exponential discs to the mass surface density and calculated the from the disc scale-lengths. These values agreed with those estimated directly from the mass distributions..
3.2 Age gradients
The stellar age profiles store information on the formation history of the stellar disc. In an inside-out disc formation scenario negative age gradients are expected since the central regions formed first and have higher density gas to feed the star formation activity. Although this might be the case on global terms, mergers and interactions as well as secular evolution could contribute to flatten or to build positive age and/or metallicity profiles as shown in previous works (e.g. Rupke et al. 2010; Perez et al. 2011). Migration could also cause old stars to populate outer regions, flattening the age and metallicity distributions. Minor mergers might also add old stars to the outer parts of the discs (Abadi et al. 2003; Tissera et al. 2012).
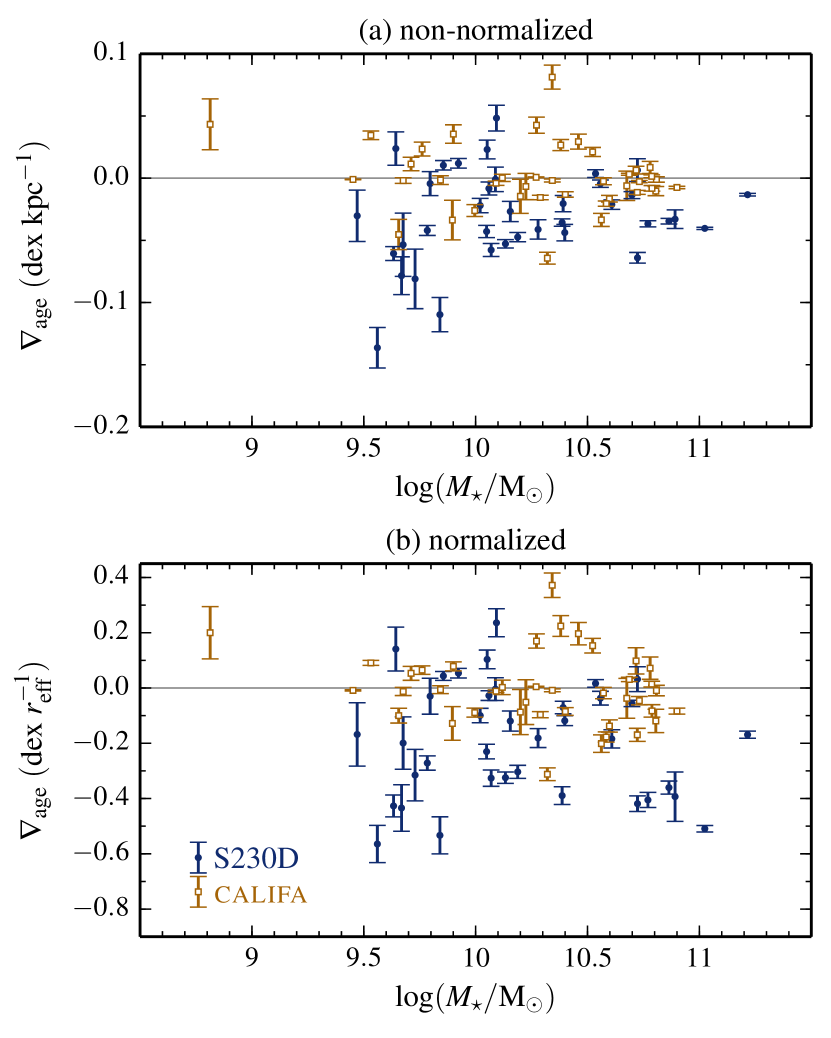
We fit linear regressions to the age profiles following the same procedure as in the case of the metallicity profiles. In Fig. 6, we show the age gradients as a function of the stellar mass of the simulated galaxies. On average, the mean age gradients are negative as expected for inside-out histories of formation. The slopes of the age profiles show a very mild dependence on stellar mass. In Table 1 we show the median age gradients for the two stellar-mass subsamples. The normalized age slopes show a similar behaviour, again with a large dispersion. The Spearman test show very weak signal for the non-normalized relations (; upper panel) and no signal at all for the normalized one (; lower panel).
As a function of the age gradients show no clear signal of correlation. This might be caused by the intrinsic dispersion in stellar age or by the low number of galaxies. In analytical models, a parallel behaviour between metallicity and age could be expected but when the non-linear assembly of structure is considered, then the relations are more complex. And in fact the age profiles could be more affected by fraction of young stars as a function of radius. In our simulation as we will see later on, there are high metallicity stars of all ages, although on average, they tend to be younger compared to low-metallicity ones.
We note that there are steeper negative normalized age gradients in the simulation than in the observations reported by Sánchez-Blázquez et al. (2014). These age profiles with steeper negative slopes could be the result of a difference in the estimation of the , and/or of the action of physical processes poorly described in our model or differences in the galaxy sample.
The inside-out disc formation scenario seem to be the common formation path for our discs in agreement with observations. However, there are few of them which show positive age profiles (less than ten per cent). We found that these discs have higher fractions of recent new-born stars within which are responsible for the flattening or changing in the slope of the age profiles as expected. However, we found that not all of them show positive metallicity slopes. In previous works, the positive metallicity slopes of the gas-phase components were shown to appear as a result of the effects of mergers or interactions which drove gas infalls triggering star formation. These gas inflows are expected to have lower metallicity than the gas present in the central regions (e.g. Perez et al. 2006; Rupke et al. 2010; Perez et al. 2011; Tissera et al. 2016). However, if these inflows took place very recently, the gas-phase disc would be already enriched (Tissera et al. 2016). So the new-born stars would be young but not so metal-poor with respect to the underlying SPs. Hence the age profiles would reflect the recent star formation activity in the central regions more efficiently than the the metallicity gradients. Our simulations suggest that there might be a variety of situations, depending on the metallicity of the infalling gas (i.e. the slope of the gas-phase metallicity gradients) and the relative fraction of young-to-old stars present in the central regions.
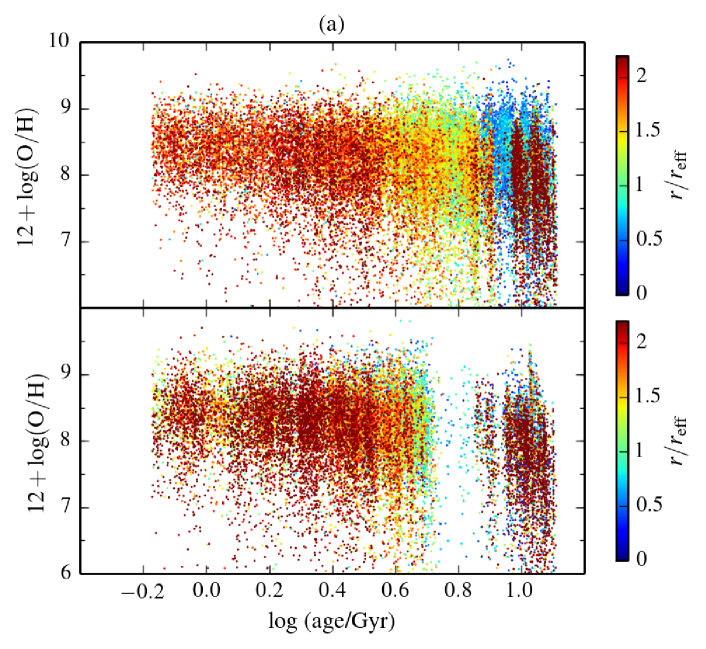
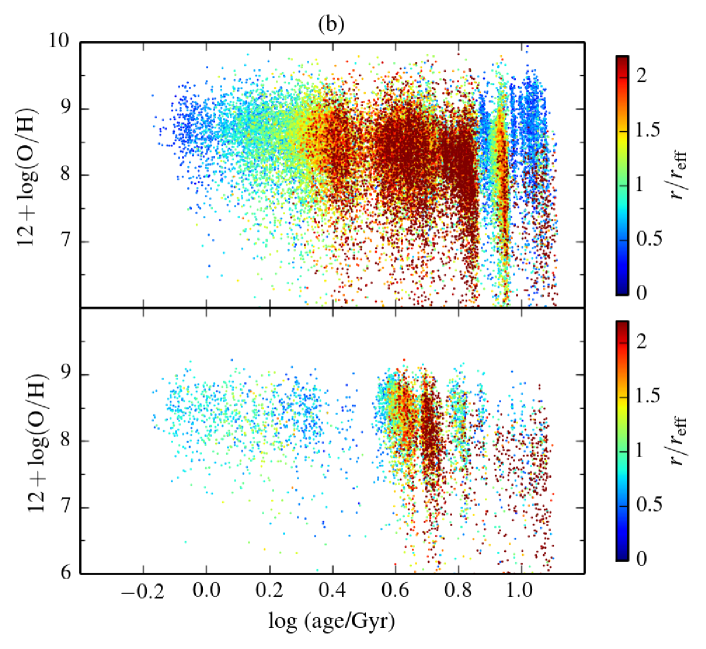
For illustration in Fig. 7, we show the age-metallicity relation for two galaxy discs with positive (right panel) and negative (left panel) age gradients, which have negative metallicity slopes. From this figure we can see that the galaxies with positive age slopes have a larger fraction of young stars within . Those with negative age slopes have young stars formed mainly in the outer parts of the discs or more evenly distributed along the discs. We expect positive age slopes if there is available gas to form stars in the central regions, and this might happen if the gas is transported inward by tidal torques produced during interactions with nearby satellites or galaxies.
We also find that old stars are present at all radii. In particular, in Fig. 7 the presence of old stars in the outer regions can be clearly seen. This could be ascribed in part to migration processes (e.g. Spitoni et al. 2015) or bar diffusion (Brunetti et al. 2011). It should be also mentioned that the accretion of satellite galaxies could also contribute with old stars in the outer parts (Abadi et al. 2003; Tissera et al. 2012).
Hence, it might be possible to have galaxies with positive age profiles which have experienced secular evolution recently but their metallicity gradients still show negative slopes. This situation adds noise to observations and may prevent drawing clear conclusions in relation to the presence of bars and their impact on metallicity slopes (Sánchez-Blázquez et al. 2014).
3.3 Metallicity gradients for old and young stars
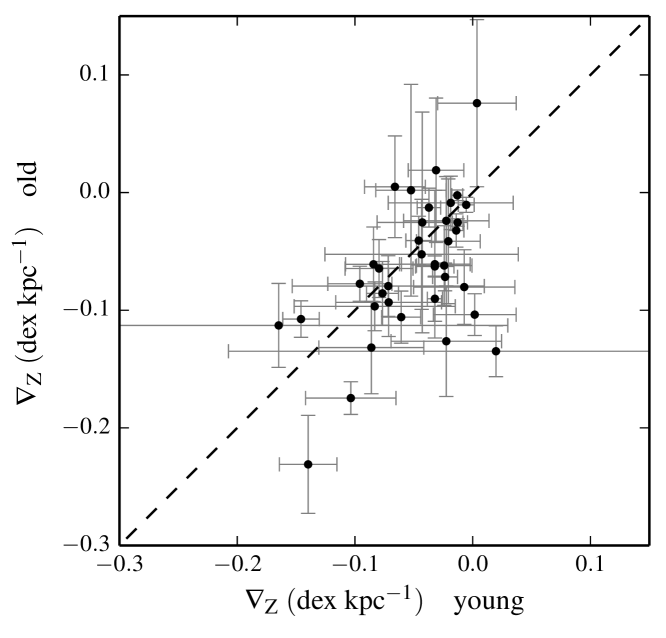
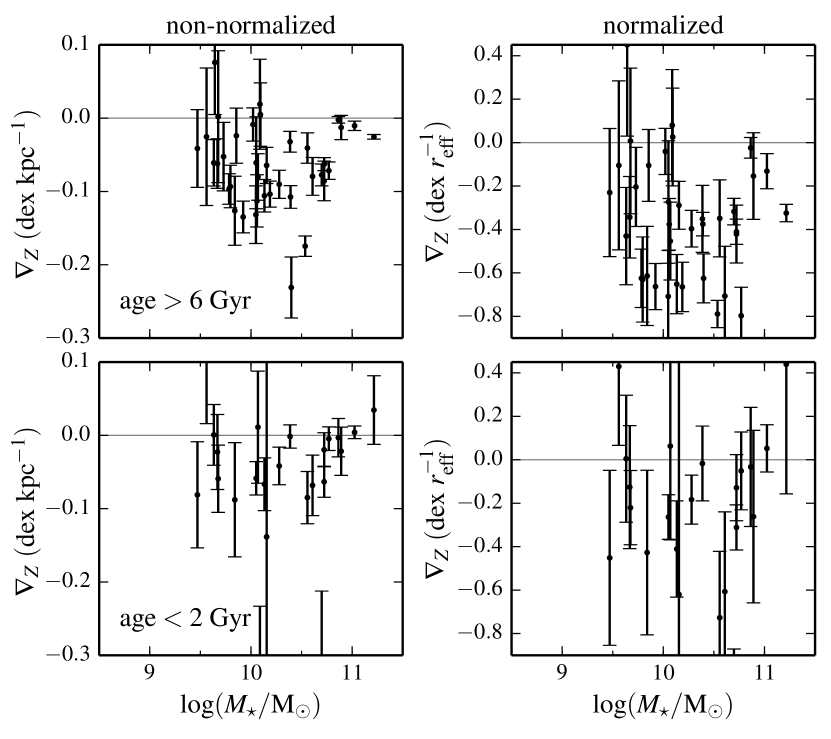
Sánchez-Blázquez et al. (2014) reported a trend, albeit weak, for old stellar population to have normalized metallicity profiles with steeper negative slopes than those determined by young stars. To evaluate this aspect in our simulated galaxies, we estimated the metallicity profiles for stars older than 6 Gyr and younger than 2 Gyr for both normalized and non-normalized profiles. Figure 8 shows the estimated metallicity gradients. The median values have a mild trend for the old populations to have steeper metallicity gradients ( dex kpc-1) compared to the young ones ( dex kpc-1). A stronger trend is found for the normalized metallicity slopes although with larger bootstrap errors and dispersions (Table 2).
For both age subsamples, we estimated the slopes of the stellar metallicity profiles as a function of the galaxy stellar mass as shown in Fig. 9. The non-normalized gradients show a very weak correlation with stellar mass for the young SPs The slopes of the normalized metallicity profiles show no correlations for the old and young SPs with stellar mass (Table 2). The normalization of the metallicity profiles by the corresponding erases any dependence on the stellar mass that might have been imprinted on the metallicity profiles of the young stellar population. Note that the Spearman tests provide no clear signal of correlations. Hence, the trends estimated above should be taken as indicative and be confirmed with a larger sample. We note that both the non-normalized and the normalized metallicity gradients of the old SPs show a clear U-shape distribution (the young populations are noiser). From these trends it seems that the old populations are the primarly responsible for this behaviour in the simulation (Fig 3 and Fig. 4).
The gas-phase metallicity profiles show a clearer dependence on stellar mass as reported by Tissera et al. (2016). However the SPs are not able to preserve this correlation in our simulations and even for the younger stars, the signal is very weak. This suggests the action of mechanisms which contribute to mix up stars such as mergers/interactions and/or migration as previously mentioned.
| Simulation | |||||
|---|---|---|---|---|---|
| Age 6 Gyr | |||
|---|---|---|---|
| All masses | |||
| Age 2 Gyr | |||
| All masses |
4 Conclusions
We studied the metallicity and age gradients of the stellar discs in a hierarchical clustering scenario with the aim of analysing if they reproduce observational trends and how they depend on stellar mass. The metallicity gradients reflect the enrichment of the ISM at the time of star formation and hence, can store information which is relevant to understand the star formation process, the enrichment cycle and the effects of galaxy assembly.
Our results can be summarized as follows:
-
•
The non-normalized metallicity gradients of the SPs show a very weak dependence on stellar mass of the galaxies which is erased when normalized by . There is a large variety of normalized metallicity gradients. The results are in global agreement with those reported by CALIFA survey (Sánchez-Blázquez et al. 2014), considering the differences in the definition of the scale-lengths (Section 3). Our simulated discs show the steeper metallicity gradients for galaxies with stellar masses around M⊙ in agreement with observational results (e.g. González Delgado et al. 2015).
-
•
The simulated of the stellar discs as a function of stellar mass are consistent with observational estimations by van der Wel et al. (2014) and by (Sánchez-Blázquez et al. 2014), within a standard deviation. Our simulated stellar discs formed by conserving the specific angular momentum content (Pedrosa & Tissera 2015) with mean values in agrement with observations (Romanowsky & Fall 2012). These are important achievements for the our simulations considering that the free parameters were not fixed to reproduce them.
-
•
We also find a correlation between the metallicity gradients and the which is erased if the profiles are normalized by this characteristic scale-length. As pointed out by previous works (Prantzos & Boissier 2000), this suggests that the building up of the metallicity profiles is strongly linked with the formation of discs. Other processes such as galaxy mergers, secular evolution, migration, accretion of small satellites could perturbate the discs and mix the gas and stellar populations producing changes in the relation. As reported in previous works, we expect mergers to be the one of the most important mechanisms responsible for driving inflows which contribute to produce positive metallicity and/or age profiles (Rupke et al. 2010; Perez et al. 2006, 2011). In fact, the metallicity gradients may change back to negative but they tend to remain with values above the original ones. Also, the ejection of enriched material from the central regions by SN outflows which could be re-accreted in the external regions of the discs later on, and contribute to flatten the metallicity profiles (Perez et al. 2011).
-
•
The simulated stellar discs show negative age profiles consistent with an inside-out history of formation, on average. There are some discs with positive (or close to flat) age gradients which can be linked to the recent formation of stars in the central region . These cases could be related to galaxies with recent history of galaxy interactions which have driven gas inflows. The metallicity profiles are weakly modified since recent gas infalls would tend to transport already enriched material. Conversely the age profiles are strongly modified by these new stars since the dynamical range covered by age is much larger. Our results suggest that, in some cases, relating the presence of a bar as responsible for gas inflow, with the slope of metallicity profile might not be so direct.
-
•
The stellar populations show metallicity profiles with different slopes when they are separated according to age. The metallicity gradients of young ( Gyr) stars tend to be slightly flatter than those of the old ( Gyrs) stars. These trends are in agreement with results from CALIFA survey and the Milky Way (Maciel et al. 2003).
Overall, our findings suggest that the underlying process responsible for determining the age and metallicity profiles is the inside-out formation of disc, with specific angular momentum conservation. In spite of this, dynamical processes which can disturbe the stellar distributions together with those that affect the transformation of gas into stars play an important role.
Acknowledgements.
Support for PBT is provided by the Ministry of Economy, Development, and Toursim’s Millennium Science Initiative through grant IC120009, awarded to The Millennium Institute of Astrophysics, MAS. REGM acknowledges support from Ciência sem Fronteiras (CNPq, Brazil). This work was partially supported by PICT 2011-0959 (ANCyT, Argentina) and PIP 2012-0396 (Conicet, Argentina). PBT acknowledges partial support from the Regular Grant UNAB 2014, Nucleo UNAB 2015 (DI-677-15/N) of Universidad Andres Bello and Fondecyt 1150334 (Conicyt).References
- Abadi et al. (2003) Abadi, M. G., Navarro, J. F., Steinmetz, M., & Eke, V. R. 2003, ApJ, 591, 499
- Bland-Hawthorn & Freeman (2003) Bland-Hawthorn, J. & Freeman, K. C. 2003, in Astronomical Society of the Pacific Conference Series, Vol. 297, Star Formation Through Time, ed. E. Perez, R. M. Gonzalez Delgado, & G. Tenorio-Tagle, 457–+
- Brook et al. (2012) Brook, C. B., Stinson, G. S., Gibson, B. K., et al. 2012, MNRAS, 426, 690
- Brunetti et al. (2011) Brunetti, M., Chiappini, C., & Pfenniger, D. 2011, A&A, 534, A75
- Calura et al. (2012) Calura, F., Gibson, B. K., Michel-Dansac, L., et al. 2012, MNRAS, 427, 1401
- Carraro et al. (2007) Carraro, G., Geisler, D., Villanova, S., Frinchaboy, P. M., & Majewski, S. R. 2007, A&A, 476, 217
- Chiappini et al. (1997) Chiappini, C., Matteucci, F., & Gratton, R. 1997, ApJ, 477, 765
- Chiappini et al. (2001) Chiappini, C., Matteucci, F., & Romano, D. 2001, ApJ, 554, 1044
- de Jong (1996) de Jong, R. S. 1996, A&S, 313, 45
- De Rossi et al. (2013) De Rossi, M. E., Avila-Reese, V., Tissera, P. B., González-Samaniego, A., & Pedrosa, S. E. 2013, MNRAS, 435, 2736
- de Rossi et al. (2010) de Rossi, M. E., Tissera, P. B., & Pedrosa, S. E. 2010, A&A, 519, A89
- Di Matteo et al. (2013) Di Matteo, P., Haywood, M., Combes, F., Semelin, B., & Snaith, O. N. 2013, A&A, 553, A102
- Fakhouri et al. (2010) Fakhouri, O., Ma, C.-P., & Boylan-Kolchin, M. 2010, MNRAS, 406, 2267
- Few et al. (2012) Few, C. G., Gibson, B. K., Courty, S., et al. 2012, A&A, 547, A63
- Friedli et al. (1994) Friedli, D., Benz, W., & Kennicutt, R. 1994, ApJL, 430, L105
- Garnett et al. (1997) Garnett, D. R., Shields, G. A., Skillman, E. D., Sagan, S. P., & Dufour, R. J. 1997, ApJ, 489, 63
- Gibson et al. (2013) Gibson, B. K., Pilkington, K., Brook, C. B., Stinson, G. S., & Bailin, J. 2013, A&A, 554, A47
- González Delgado et al. (2015) González Delgado, R. M., García-Benito, R., Pérez, E., et al. 2015, A&A, 581, A103
- Ho et al. (2015) Ho, I.-T., Kudritzki, R.-P., Kewley, L. J., et al. 2015, MNRAS, 448, 2030
- Hughes et al. (1994) Hughes, S. M. G., Stetson, P. B., Turner, A., et al. 1994, ApJ, 428, 143
- Iwamoto et al. (1999) Iwamoto, K., Brachwitz, F., Nomoto, K., et al. 1999, ApJS, 125, 439
- Kudritzki et al. (2008) Kudritzki, R.-P., Urbaneja, M. A., Bresolin, F., et al. 2008, ApJ, 681, 269
- MacArthur et al. (2004) MacArthur, L. A., Courteau, S., Bell, E., & Holtzman, J. A. 2004, ApJS, 152, 175
- Maciel et al. (2003) Maciel, W. J., Costa, R. D. D., & Uchida, M. M. M. 2003, A&A, 397, 667
- Minchev et al. (2014) Minchev, I., Chiappini, C., & Martig, M. 2014, A&A, 572, A92
- Mollá & Díaz (2005) Mollá, M. & Díaz, A. I. 2005, MNRAS, 358, 521
- Mollá et al. (1997) Mollá, M., Ferrini, F., & Díaz, A. I. 1997, ApJ, 475, 519
- Mosconi et al. (2001) Mosconi, M. B., Tissera, P. B., Lambas, D. G., & Cora, S. A. 2001, MNRAS, 325, 34
- Mott et al. (2013) Mott, A., Spitoni, E., & Matteucci, F. 2013, MNRAS, 435, 2918
- Muñoz-Mateos et al. (2007) Muñoz-Mateos, J. C., Gil de Paz, A., Boissier, S., et al. 2007, ApJ, 658, 1006
- Pedrosa & Tissera (2015) Pedrosa, S. E. & Tissera, P. B. 2015, A&A, 584, A43
- Perez et al. (2011) Perez, J., Michel-Dansac, L., & Tissera, P. B. 2011, MNRAS, 417, 580
- Perez et al. (2006) Perez, M. J., Tissera, P. B., Scannapieco, C., Lambas, D. G., & de Rossi, M. E. 2006, AA, 459, 361
- Pilkington et al. (2012) Pilkington, K., Gibson, B. K., Brook, C. B., et al. 2012, MNRAS, 425, 969
- Prantzos & Boissier (2000) Prantzos, N. & Boissier, S. 2000, MNRAS, 313, 338
- Romanowsky & Fall (2012) Romanowsky, A. J. & Fall, S. M. 2012, ApJS, 203, 17
- Rosales-Ortega et al. (2010) Rosales-Ortega, F. F., Kennicutt, R. C., Sánchez, S. F., et al. 2010, MNRAS, 405, 735
- Roškar et al. (2008) Roškar, R., Debattista, V. P., Stinson, G. S., et al. 2008, ApJL, 675, L65
- Rupke et al. (2010) Rupke, D. S. N., Kewley, L. J., & Chien, L.-H. 2010, ApJ, 723, 1255
- Sánchez et al. (2014) Sánchez, S. F., Rosales-Ortega, F. F., Iglesias-Páramo, J., et al. 2014, A&A, 563, A49
- Sánchez-Blázquez et al. (2014) Sánchez-Blázquez, P., Rosales-Ortega, F. F., Méndez-Abreu, J., et al. 2014, A&A, 570, A6
- Sánchez-Menguiano et al. (2016) Sánchez-Menguiano, L., Sánchez, S. F., Pérez, I., et al. 2016, A&A, 587, A70
- Scannapieco et al. (2005) Scannapieco, C., Tissera, P. B., White, S. D. M., & Springel, V. 2005, MNRAS, 364, 552
- Scannapieco et al. (2006) Scannapieco, C., Tissera, P. B., White, S. D. M., & Springel, V. 2006, MNRAS, 371, 1125
- Scannapieco et al. (2009) Scannapieco, C., White, S. D. M., Springel, V., & Tissera, P. B. 2009, MNRAS, 396, 696
- Schaye et al. (2015) Schaye, J., Crain, R. A., Bower, R. G., et al. 2015, MNRAS, 446, 521
- Snaith et al. (2013) Snaith, O. N., Tissera, P. B., Pedrosa, S., de Rossi, M. E., & Vílchez, J. M. 2013, Asociacion Argentina de Astronomia La Plata Argentina Book Series, 4, 129
- Spitoni et al. (2015) Spitoni, E., Romano, D., Matteucci, F., & Ciotti, L. 2015, ApJ, 802, 129
- Springel (2005) Springel, V. 2005, MNRAS, 364, 1105
- Springel et al. (2001) Springel, V., Yoshida, N., & White, S. D. M. 2001, New Astronomy, 6, 79
- Stott et al. (2014) Stott, J. P., Sobral, D., Swinbank, A. M., et al. 2014, MNRAS, 443, 2695
- Tissera et al. (2016) Tissera, P. B., Pedrosa, S. E., Sillero, E., & Vilchez, J. M. 2016, MNRAS, 456, 2982
- Tissera et al. (2012) Tissera, P. B., White, S. D. M., & Scannapieco, C. 2012, MNRAS, 420, 255
- van der Wel et al. (2014) van der Wel, A., Franx, M., van Dokkum, P. G., et al. 2014, ApJ, 788, 28
- Vogelsberger et al. (2014) Vogelsberger, M., Genel, S., Springel, V., et al. 2014, MNRAS, 444, 1518
- Woosley & Weaver (1995) Woosley, S. E. & Weaver, T. A. 1995, ApJS, 101, 181