Observation of hard radiations in a laboratory atmospheric high-voltage discharge
Abstract
The new results concerning neutron emission detection from a laboratory high-voltage discharge in the air are presented. Data were obtained with a combination of plastic scintillation detectors and 3He filled counters of thermal neutrons. Strong dependence of the hard x-ray and neutron radiation appearance on the field strength near electrodes, which is determined by their form, was found. We have revealed a more sophisticated temporal structure of the neutron bursts observed during of electric discharge. This may indicate different mechanisms for generating penetrating radiation at the time formation and development of the atmospheric discharge.
pacs:
28.20.-v, 29.40.Gx, 52.80.Mg, 24.10.-iI Introduction
The high-energy emissions of electrons, gamma rays, and neutrons produced in association with lightning and thunderclouds have been observed in a number of space and ground-based experiments. Elucidation of the mechanisms of high-energy radiation arising at the time of atmospheric discharge is an increasingly expanding area, both of experimental and theoretical research. A comprehensive review of the physical phenomena occurring in the thunderstorm atmosphere is presented in dwy where this field of study comes under designation of “high-energy atmospheric physics”.
Of particular interest are occasional observations of temporary enhancement of the neutron flux inside thunderstorm atmosphere. The first evidences of a surplus neutron radiation at thunderstorm time have been reported in sha . In recent years, some papers discuss the possibility of neutron generation in connection with powerful lightning discharges on the basis of experimental observations made at the mountain heights at Tien Shan gur ; gur2 , Aragats chi ; chi2 , Tibet tsu , so as at the sea level in MSU kuzh and Yakutsk koz . Up to date, the different physical mechanisms were being discussed for explanation of thunderstorm related neutron production, but the nature this phenomenon still remains unknown.
Recently we reported our first measurements of neutron emission originated by atmospheric lightning like discharge in a laboratory installation aga . Experiments were carried out inside an electric field with the average strength of the order of 1 MVm-1 and with neutron detectors of two independent kinds: the CR-39 type tracers and the plastic scintillators. The neutrons were registered within the range from thermal energies up to the energies above 10 MeV. It was found that the neutron generation takes place at the initial phase of electric discharge and is correlated with generation of x-ray radiation. The estimations of the average density of neutron flux lay in the range of (0.2–1)106 cm-2 per a discharge shot. We did not found any convincing explanation for observed high values of neutron flux according to the registration in the CR-39 track detectors. A detailed theoretical analysis of various nuclear reactions which could contribute to this flux is presented in bab , and it ends with conclusion that the “known fundamental interactions cannot allow prescribing the observed events to neutrons”.
Insufficient knowledge on physical processes which could take place at the initial stage of the atmospheric discharge and the complexity of any self-consistent numerical simulation of this phenomenon determines the need for a comprehensive experimental study of the formation of discharge and diagnosis of different accompanying radiations. The use of a laboratory installation with its parameters sufficient for a precise temporal and spatial separation of running processes allows to establish general laws and to check expected hypothesis on discharge formation. In present article we report the new results concerning detection of neutron emission from a controlled electric discharge in the air which was made with a combination of plastic scintillation detectors and 3He filled proportional ionization counters of thermal neutrons. This study has revealed a more sophisticated temporal structure of the neutron bursts observed at the time of electric discharge. It was found that the flash of hard x-rays generated by discharge is not always accompanied by any appearance of neutron signal as well as both the single and multiple neutron pulses were recorded which do not overlap with any x-ray pulses at all. In some rather rare events the neutron pulses appear at the final stage of discharge, when the voltage has just fell down to zero, or even after polarity change of accelerating voltage, and do not correlate with any x-ray radiation.
II Experimental setup, detector calibration, and the time structure of radiation pulses
Experiments were held with a high current electron accelerator ERG destined for investigation of the high-voltage discharge in the air n1 . The main characteristics of generated discharge and procedure of electrophysical diagnostics were the same as in the measurements described in aga . High voltage pulses with a 1 MV amplitude were applied to a discharge air gap of the 450–750 mm width (the latter was changed in various runs). The current pulse amplitude was about 10–12 kA, and the total duration of pulses was about 350–1000 ns, in dependence on the gap width. In successive experimental series were used the electrodes of different configurations: the cathode and anode of hemispherical shape, 80 mm and 90 mm in diameter, and the semispherical 90 mm mesh anode in combination with cathode needle. The scheme of the current experimental set-up with a set of plastic scintillation detectors, the 3He filled thermal neutron counters, optic sensors, and radio antenna is shown in the Fig. 1.
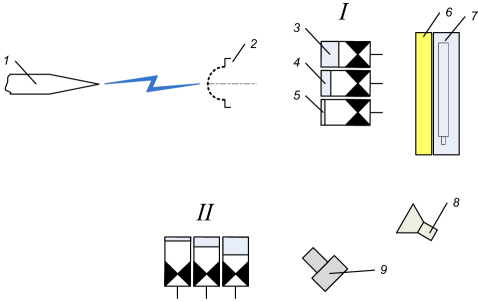
In both experimental series one and the same assembly of three plastic scintillation detectors (SD1–SD3) was used which is shown in positions I and II in the Fig. 1. All detectors are build on the basis of cm3 scintillator blocks optically coupled with the FEU30 type photomultiplier tube (PMT); the detector SD1 is shielded with a 10 cm thick wall of the stacked lead bricks from all its sides (even at 100-fold attenuation of gamma radiation threshold energy it is approximately E MeV), SD2 is wrapped by the two layers of sheet lead with sum thickness of 6 mm (which corresponds to a gamma rays cutoff energy E keV), and SD3 is covered by an aluminum foil with the thickness of 50 m (cutoff energy E keV).
Location I of scintillation assembly was used in the most part of experiments. In this position, the SD1 detector was placed at the distance of 100 mm from the axis of the system, and 470 mm behind the anode; SD2 just on the axis and at the distance of 470 mm from the anode; and SD3 at the distance of 880 mm from anode and 110 mm aside the axis, and below the level of SD1 by the values of its height. The position II was used to measure the weakening of radiation intensity and to estimate its energy in supposition if all generated emission is considered as gamma rays. In second position all SD were located in one vertical plane 900 mm aside of discharge axis, and the detector SD3 was placed between SD1 and SD2.
All three scintillation detectors were calibrated with a standard x-ray source RINA n2 and have approximately one and the same sensitivity relative to electromagnetic radiation. X-ray tube of IMA6 D type powered by 0.15 J pulses with peak voltage of 100 kV. Angular divergence of x-rays is 30∘, the pulse duration is about 10 ns with repetition rate of 8 Hz. The diameter of the effective focal spot is 2.5 mm.
For continuous (not pulsed) mode estimation their registration efficiency relative to neutron flux the scintillation detectors were irradiated by a 252Cf neutron source with overall yield of neutrons per second. In the case where the source is placed in the center point of the scintillator plane the detection efficiency of the detector was 0.17. When the scintillation detector was placed inside a 10-cm lead box and the source was at the anode (at a distance of about 0.5 m) scintillator cannot record signal (background level) because of small average intensity of neutron flux from the source.
As an alternative and independent method of neutron registration in the present experiment was applied the multichannel detector on ionization neutron counters. This detector is based on the 3He-filled neutron counters of SNM-18 type which were operating in proportional mode. Twelve cm cm counters together with all necessary electronics were put into a 2 mm thick duraluminium casing covered by the discharge (front) side with a 7 cm thick paraffin layer for moderation of anticipated neutrons. The total area of the neutron detection block is 1000 cm2; the counters are filled with the pure 3He gas under the pressure of 2 atm. When operating, the detector was placed in position at 70 cm from the anode and 130 cm from the cathode as shown in Fig. 1, with its front moderator cover being turned against the generator. The pulses from all neutron counters were recorded separately, so the average intensity of neutron flux could be calculated as a sum of these counts.
When using the ionization counters based detectors in the vicinity of a powerful electrical installation, it is a general problem to suppress the strong electromagnetic interference on their counts from the nearby electric discharges. Therefore, the neutron counters together with their signal acquisition electronics were especially locked inside an electrically shielded volume. Also, in a part of experiments the whole counter assembly was placed inside an additional tight box of welded 3 mm thick iron, and in this position another 43 mm thick layer of light material (perplex) — a neutron reflector — was put against the back (opposite to discharge generator) side of the counter case.
Absolute calibration of neutron detector was made experimentally with the use of 252Cf neutron source. With the source placed in vicinity of cathode the net neutron detection efficiency of described 3He counters assembly occurred to be 0.076%, and with the source in anode region — 0.12%.
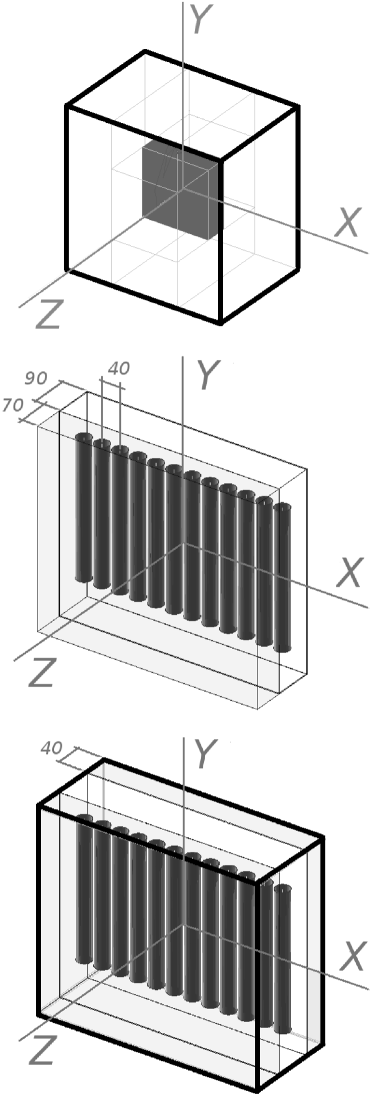
Besides these experimental measurements, efficiency of neutron registration was defined in complete simulation of the neutron propagation process both inside the neutron detectors and in surrounding materials with the use of Geant4 toolkit geant4 . For the purpose, three detector models were built which took into account specific features of detector set-ups used in reality (see the Fig. 2).
The model I corresponds to the typical configuration of SD1 scintillation detector: a cm3 plastic scintillator block surrounded by 10 cm thick lead walls. In the model II a set of 12 3He filled cylindrical “counters” having the size of a real SNM-18 type detector (3 cm in diameter and 30 cm long) were put into a box of Al material with a 7 cm thick paraffin moderator layer placed at its front side. In model III this counter assembly was supplemented with a backward neutron reflector of 4 cm thick perspex, and the whole set-up was placed inside a solid metallic box of a 3 mm thick iron sheets.
The particle physics module of simulation program took into consideration the following processes of neutron interaction: the Geant4 models of elastic coincidences in the range from thermal energies (of the order of eV) up to 4 eV, so as the elastic coincidence models of the intermediate (4 eV–20 MeV) and high-energy neutrons (above 20 MeV); the models of inelastic interaction in the ranges of thermal, intermediate and high energies; the models of radiative neutron capture. For the protons, besides analogous processes of their elastic and inelastic interactions the models of multiple scattering and ionization losses were considered; and for the positive and negative pions the decay process (the physics of negative pions included also the process of their absorption at rest). The fact of neutron registration was signalled either by appearance of any charged particle (mostly, a recoil proton) with the energy above 0.5 MeV inside the scintillator volume of the model I, or by a 3H nucleus born inside the volume of any neutron counter for the case of models II and III (correspondingly to nuclear reaction He H which is used in the real SNM-18 type detectors). In turn, the overall efficiency of neutron registration was defined as a relation of the number of “registered” neutrons to the total number of primary particles put into simulation.
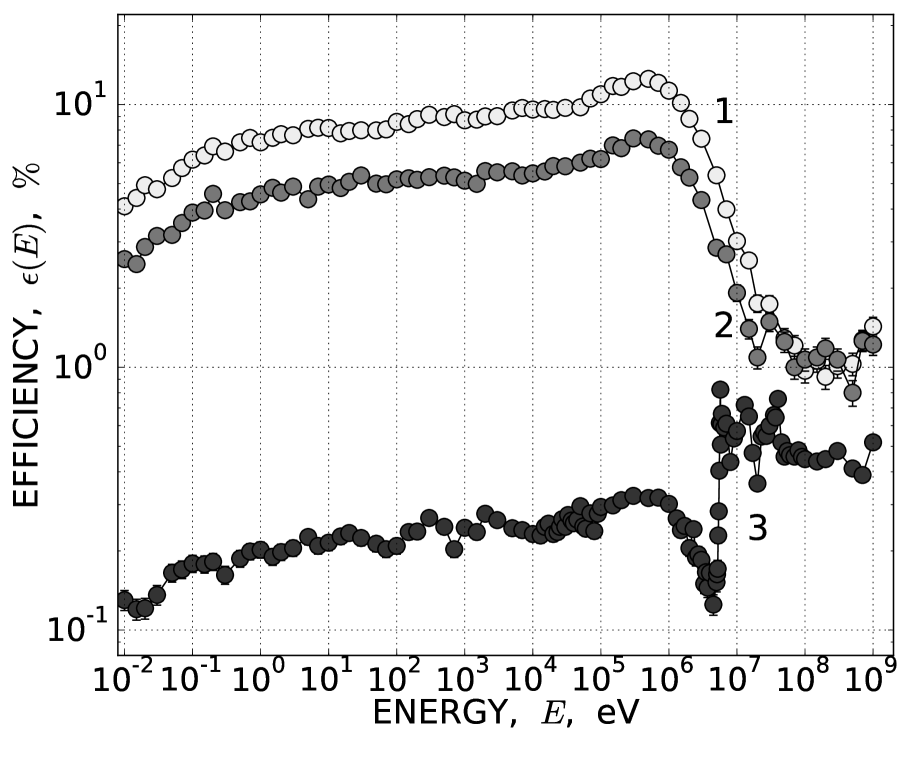
Three distribution variants of primary neutron particles were accepted in simulation series for every detector model I, II, and III. In first turn, a parallel beam of monoenergetic primary neutrons was falling on center point of detector front perpendicularly to its surface (an ideal case of primary geometry and upper limit of possible registration efficiency). In second (intermediate) variant the position of primary neutrons was randomly selected on the front surface while their momenta remain always perpendicular to it. In the third (realistic) simulation the primary neutrons were emitted with isotropic direction distribution from a spherical point source displaced 70 cm apart from the front surface, similarly to geometry of real experiment were origination of neutrons is supposed to have place somewhere around electrodes of high voltage generator. A number of succeeding simulation runs with constantly increasing energies of primaries was fulfilled for every combination “detector model/primary geometry”, and a set of registration efficiency distributions was calculated in dependence on neutron energy. These results are presented in the Fig. 3.
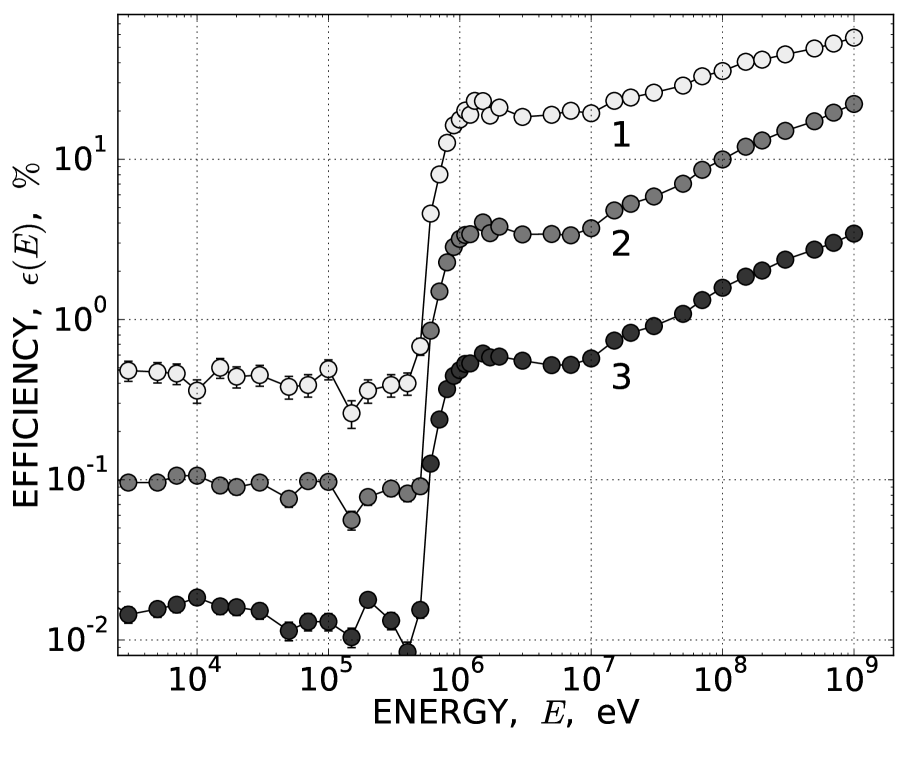
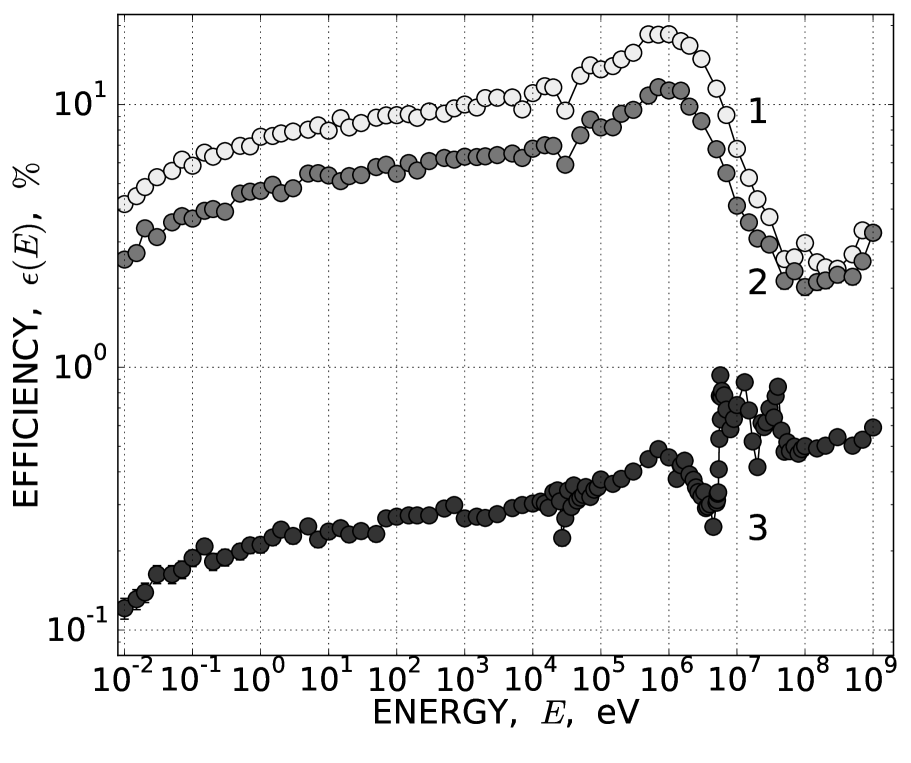
As is known, the energy spectrum of neutron emission from 252Cf isotope fission does spread up to 13 MeV with its mean value being 2.3 MeV and the most probable value 1.2 MeV. According to the upper frame of Fig. 3 the maximum average efficiency of neutron registration by scintillation detector in the energy range of some MeV must be confined by the curves 1 and 2, i.e. somewhere between 5–20%. For the “realistic” configuration of a distant isotropic neutron source the curve 3 predicts an efficiency about 0.4–0.5%.
The simulation results made for a ionization neutron counter based detector in the middle and bottom frames of Fig. 3 have rather irregular behaviour in MeV energy range for the case of a distant point source (the curve 3). This can be explained through manifestation of an additional neutron multiplication mechanism due to recoil process in surrounding materials around the neutron counters; this effect starts to be feasible just around the MeV energy threshold and occurs being noticeable in the curves 3 because of their generally low efficiency level.
In the case of the neutron detector model II the simulation predicts the mean registration efficiency about 0.15-0.20% for a distant primary source (curve 3) which is close to 0.12% efficiency measured with location of californium source in anode region. The presence of additional backward neutron reflector in the case of model III reveals itself through the increase of resulting registration efficiency up to the values of 0.30-0.45%.
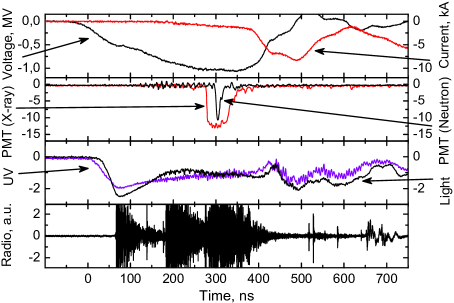
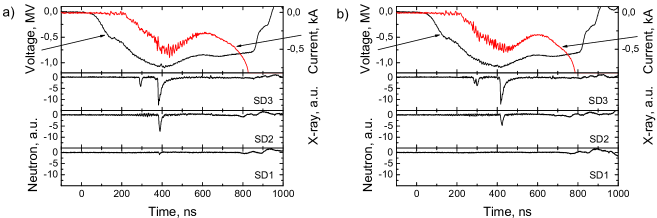
Discharge development in the real-time experiment was controlled by its photographing at different angles with the use of multichannel digital photo-recorder and application of the neutral and colored optical glass filters, and trough the fast oscilloscope recording of characteristic electric parameters and radiation intensities. The Fig. 4 presents the typical time behavior of the electric current and voltage on the discharge gap, so as the intensity of 1–3 GHz radio-emission, optic light, ultraviolet and x-ray radiation, and neutron pulse. It is seen that the moment of x-ray pulse usually is delayed up to 200–300 ns relative to the voltage jump, and coincides with the time of increasing pre-pulse current; most often, the neutron signals do occur within the time of the x-ray radiation pulse.
III The real-time neutron and x-ray measurements
The lightning discharges are recorded simultaneously with neutrons and gamma radiation using scintillation detectors. Detection of neutrons and/or hard gamma rays in a laboratory experiment requires a clear analysis.
Firstly, we have identified a strong dependence of the appearance of the hard (neutron or gamma) radiation from the electric field strength near the electrodes, which is determined by their form. Statistics of events with the advent of x-rays and neutrons are presented in Table 1.
| Geometry of the electrodes | Shots with x-ray | Shots with x-ray | Shots with |
| and the total number of shots | ( keV)(SD2) | ( keV)(SD3) | neutron pulses (SD1) |
| Hemishpere (cathode)- | |||
| hemishpere (anode) | |||
| 341 | 39% | 33% | 1.4% |
| including “cut-off” | |||
| 96 | 36% | 35% | 2% |
| Needle (cathode)- | |||
| hemishpere (anode) | |||
| 950 | 100% | 87% | 15% |
| including “cut-off” | |||
| 20 | 100% | 92% | 15% |
It is necessary underline very large amplitudes spread of signals registered by SD1. Although 15% is indicated in second line of Table 1, only 5% of pulses have its amplitude exceeding a third of maximum one.
Secondly, we investigated in detail the temporal structure of the appearance of neutron pulses. In a previous paper aga we noted that the momentum of the neutron radiation, the detected scintillation detector placed behind a lead shield, is correlated with the occurrence of x-ray pulse and is located within it. That is, the neutron pulse was observed in the initial “dark” phase of the discharge until closure of cathode and anode streamers. However, the structure of the neutron pulse was more complicated.
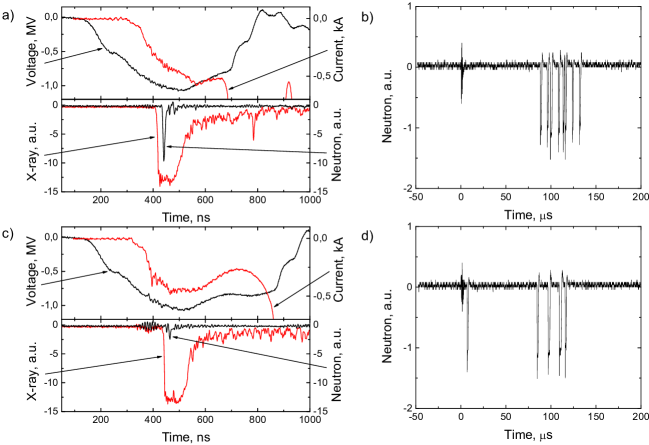
New measurements have shown that the structure and characteristics relative arrangement pulses of x-rays and neutron radiation has been quite diverse (Fig. 5). The emergence of x-ray radiation is not always accompanied by the appearance of neutrons (Fig. 5a). The most common occurrence of neutron pulses clearly correlated with the x-rays pulse and are located inside (Fig. 5b). Recorded both single and binary neutron pulses inside x-ray(Fig. 5c,d), and near the x-ray pulses (Fig. 5e). In some rare cases, the neutron pulse appears at the final stage of the discharge (Fig. 5f) in the absence of x-ray radiation. In most cases, the neutron impulses occur near the peak voltage to the main phase of the discharge (at the peak of pre-pulse current).
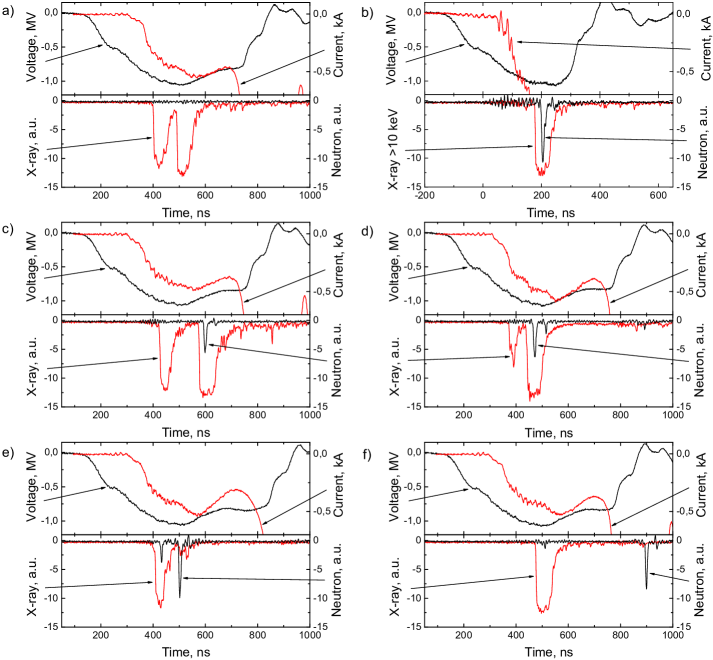
However, there are cases where the neutron pulse is generated at the beginning of the main phase (Fig. 6a) or at the peak of the discharge current and correlated with the x-ray pulse (Fig. 6b). In Fig. 6 unlike Fig. 5 instead of initial part (pre-pulse) total discharge current is shown.
Various provisions of the neutron radiation pulse relative to the pulse voltage and discharge current leads to the assumption of possible different mechanisms of neutron generation in the initial stage of discharge (until the end of streamer-leader stage) and its main stage.
The amplitude of the neutron signals in a variety of shots can vary by an order of magnitude. Taking into account the efficiency of the neutron detection by the scintillation detector and under the conditions that the flow is isotropic spectrum and the energy does not differ greatly from the spectrum of the source 252Cf, maximum observed flux of fast neutrons in a single shot can be estimated at the level of up to neutrons in sr. In a shift pulse of neutron radiation with respect to the x-ray energy neutrons could be estimated under the assumption about strong correlation x-rays and neutrons. These estimates give the neutron energy at the level of a few MeV.
We also used data on multiplicities weakening wide beams of gamma radiation for 10 cm protection of Pb n4 . Fig. 7 shows the waveform of the pulses detected by all three scintillation detectors placed in position II (see Fig. 1). In Fig. 7a the ratio of the amplitudes of the signal on the waveform SD3/SD1, ratio of the amplitudes SD2/SD1. With this weakening of multiplicities correspond to the energy of gamma rays E MeV, which is more than an order of magnitude “applied voltage” 1 MeV. Since the emission spectrum is not known, an estimate gives a lower bound. Of course, such a possibility can not be rejected completely, however, with high probability we can assume that this signal (with SD1) is formed by fast neutrons. Moreover most part of experiments with laboratory discharges give the energy of gamma rays at level of 150–200 keV m1 ; m2 ; m3 ; m4 . At the same time, for another shot (Fig. 7b, which is very similar to Fig. 7a) of this run signal from SD1 is absent, and ratio of the amplitudes SD3/SD2 . It corresponds to the energy of gamma rays E MeV in all.
Finally for a detailed study of radiation in the initial leader-streamer or dark phase of the discharge were carried out a series of measurements in which especially not a complete discharge formed. For this purpose, the cathode is installed by radial rod of adjustable length with a groove which develops on the outer cylindrical discharge electrode system (reversing switch). By varying the length of the rod, it is possible to switch the current from the main (longitudinal) groove on the discharge gap at a preset time interval, thus interrupting the discharge development in usual longitudinal direction.
Experiments on the production of integrated image of the initial phase of atmospheric discharge by interrupting the longitudinal discharge when current switching to radial discharge were carried out for two variants of electrode geometry: a cathode and an anode in the form of a hemisphere with a diameter of 90 mm and a semispherical anode and cathode needle. In the first case, it was done 96 shots, of which 34 shots x-rays with photon energies above 10 keV and only 2 pulses of neutrons have been recorded (See Table 1). In the second series were only 20 shots. In each of these shots were recorded x-ray photons with energies above 100 keV and three shots had pulses of neutrons. Therefore, we can conclude that the radiation shown in Fig. 8d are formed incomplete discharge in the longitudinal gap configuration is shown in Fig. 8c.

IV Neutron registration in the atmospheric discharge using 3He-detector
To confirm these findings, it was used 3He-detector. Fig. 9 shows the correlated events, when neutrons produced per one shot at a time recorded as scintillation detectors and 3He-detector. The left column shows the waveform from the scintillation detectors, the right column shows the waveform of the sum signal from the comparator 3He-detector (1 block, 10 tubes).
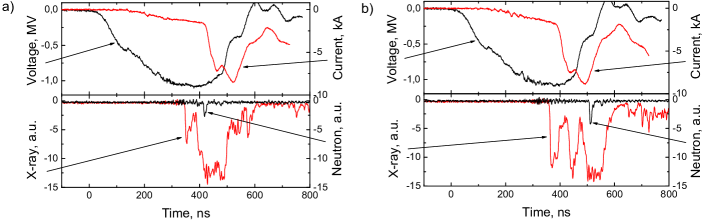
The first panel shows a case where scintillation detector detects a neutron signal of large amplitude, which lies inside the x-ray pulse (left) and a series of neutron pulses recorded 3He- counters (right). The second panel shows a case where there is neutron signal of small amplitude in the scintillation detector and the neutrons are also present in the 3He-counters.
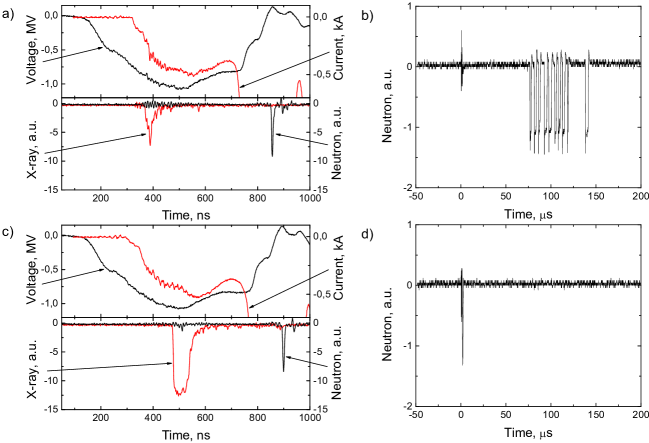
The next two panels are shown in Fig. 10 for shot cases in which there is neutron signal of large amplitude in the scintillation detector at the final stage of the discharge and recorded neutrons in the 3He-counters (first right panel) and no neutrons case (second right panel).
Table 2 shows data for all the shots in which neutrons were detected by scintillation detectors and neutron counters. Experiments have been carried out in configuration semispherical mesh anode of 90 mm and cathode needle.
| Total shots | Shots with x-ray ( keV) | Shots with neutrons on SD (10 cm Pb) | Shots with neutrons on 3He-counters |
|---|---|---|---|
| 340 (100%) | 296 (87%) | 35 (10%) | 44 (13%) |
V Conclusion
New data using various combinations of scintillation detectors and neutron 3He counters fully confirmed the neutron radiation in a laboratory atmospheric discharge.
After analyzing a large discharge statistics, we have established a strong dependence of the hard x-ray and neutron radiation appearance on the shape of the electrode. In the configuration of electrodes in which the anode and cathode is a hemisphere, in 33% of the shots have been found hard x-ray radiation and only 1.4% of the shots have been registered neutron radiation. In the configuration of the electrodes in the form of a hemispherical anode and cathode needle appearance emissions were significantly more likely to: hard x-ray radiation has appeared in 87% of the shots, and neutron emission – in 15% of the shots.
In this study, we focused on the temporal structure of neutron bursts at the time of discharge. Discovered in previous work the appearance of neutrons in the initial “dark” phase of the discharge was confirmed, however, the temporal structure of neutron radiation generation was much more diverse. This may indicate different mechanisms for generating penetrating radiation during the formation and development of the atmospheric discharge.
Direct evidence for the detection of neutron radiation was obtained with the use of 3He neutron counters and analog recording of neutron pulses generated at the time of discharge. The close coincidence of measured and calculated neutron detection efficiencies of He-counters, allows us to estimate the maximum value of the flux of neutrons emitted in shots at to in 4 sr, depending on the place of neutrons generation (near the anode or near the cathode, respectively). At the same time, scintillation detector placed in 10-cm lead shield does register neutrons, if their energy exceeds a few hundred keV. With such small flows is very difficult to talk about isotropic radiation, so the real overall neutron flux may be even less. Indirect evidence of this statement can serve the shots in which the neutrons are recorded only scintillation or 3He detector.
References
- (1) Dwyer J.R., Uman M.A. The physics of lightning. Phys. Rep. V. 534, (2014) 147–241.
- (2) G. N. Shah, H. Razdan, G.L. Bhat et al. Nature 313, (1985) 773.
- (3) A.V. Gurevich, V. P. Antonova, A. P. Chubenko et al. PRL 108 (2012) 125001.
- (4) A.V. Gurevich, V. P. Antonova, A. P. Chubenko et al. Atmospheric Research 164 (2015) 339.
- (5) A. Chilingarian, A. Daryan, K. Arakelyan et al., Phys. Rev. D 82, (2010) 043009.
- (6) A. Chilingarian, N. Bostanjyan, and L. Vanyan, Phys. Rev. D 85, (2012) 085017.
- (7) H. Tsuchiya, K. Hibino, K. Kawata et al., Phys. Rev. D85, (2012) 092006.
- (8) V. M. Kuzhevsky, Bulletin of Moscow University: Physics, Astronomy 5, (2004) 14.
- (9) V. I. Kozlov, V. A. Mullayarov, S. A. Starodubtsev, and A. A. Toropov, J. Phys. Conf. Ser. 409, (2013) 012210.
- (10) A. V. Agafonov, A. V. Bagulya, O. D. Dalkarov et al., PRL 111, (2013) 115003.
- (11) L. P. Babich, Phys.Rev. C, 92, (2015) 044602.
- (12) A.V. Agafonov, A.V. Oginov and K.V. Shpakov K.V. Physics of Particles and Nuclei Letters. V. 9, (2012), 380–383.
- (13) G.A. Mesyats, High current pulsed electron beam technology, Nauka, Novosibirsk (1983) 130 (in Russian).
- (14) Geant4 Collaboration, NIM A, 506, (2003) 250.
- (15) I. K. Kikoin, Tables of Physical Values, Atomizdat, Moscow (1976) (in Russian).
- (16) J. R. Dwyer, H. K. Rassoul, Z. Saleh et al., Geophys. Res. Lett. 32, (2005) L20809.
- (17) J. R. Dwyer , Z. Saleh, H. K. Rassoul et al., J. Geophys. Res., Vol. 113, (2008) D23207.
- (18) V. March, J. Montany, Geophys. Res. Lett., 37, (2010) L19801.
- (19) P. O. Kochkin, C. V. Nguyen, A. P. J. van Deursen et al., J. Phys. D: Appl. Phys. 48, (2015) 025205.