Generating potassium abundance variations in the Solar Nebula
Abstract
An intriguing aspect of chondritic meteorites is that they are complementary: while their separate components have wildly varying abundances, bulk chondrites have nearly solar composition. This implies that the nearly-solar reservoirs in which chondrites were born were in turn assembled from sub-reservoirs of differing compositions that birthed the different components. We focus on explaining the potassium abundance variations between chondrules even within a single chondrite, while maintaining the observed CI 41K to 39K ratios. This requires physically separating potassium and chondrules while the temperature is high enough for K to be in the gas phase. We examine several mechanisms which could drive the dust through gas and show that to do so locally would have required long (sub-orbital to many orbits) time scales; with shortest potassium depletion time scales occurring in a scenario where chondrules formed high above the midplane and settled out of the evaporated potassium. While orbital time scales are at odds with laboratory chondrule cooling rate estimates, any other model for the origin for the potassium abundance variation has to wrestle with the severe logistical difficulty of generating a plethora of correlated reservoirs which varied strongly in their potassium abundances, but not in their potassium isotope ratios.
keywords:
hydrodynamics – turbulence – meteorites, meteors, meteoroids – planets and satellites: composition – planets and satellites: formation – protoplanetary discs1 Introduction
Of all the planetary systems known, our own is the only one where we have detailed elemental and isotopic data for any solid body. The dominant story told by that data is that, excluding objects with exceptionally traumatic histories (e.g. Mercury and the Moon), and focusing on the more refractory elements, solid objects throughout the solar system have loosely comparable bulk abundances (Palme, 2000). This is not surprising as protoplanetary disks are expected to be quite active, and hence well mixed (Shakura & Sunyaev, 1973; Lynden-Bell & Pringle, 1974). Indeed, even if there is a magnetic dead zone (Gammie, 1996; Bai, 2014), turbulence from surface layers can penetrate and mix an otherwise quiescent midplane (Oishi & Mac Low, 2009). Further, macroscopic solids in the solar nebula were made of vast numbers of sub-micron interstellar grains, erasing any stochastic compositional variations between said grains (Draine, 2003).
However, when examined in finer detail there are significant variations which point to the solar nebula having contained separate reservoirs with different abundances from which different classes of solids were formed (McDonough, 2003). In particular for this paper, different chondrite classes have modestly different abundances (Weisberg et al., 2006). Because chondrites are undifferentiated, and sometimes only slightly thermally or aqueously altered, meteorites, they provide an accessible record of the chemical and isotopic environments in which they and their components formed (Van Schmus & Wood, 1967).
There is growing evidence for complementarity: chondrite components with strongly varying compositions combine to form chondrites with overall solar bulk composition (Hezel & Palme, 2010; Palme et al., 2015). This implies that distinctly different parts of a chondrite, such as its chondrules and its matrix, were correlated with one another. While complementarity between chondrules and matrix can be maintained in the face of turbulent mixing for thousands of orbits assuming that the matrix and chondrules originated from a single reservoir, it cannot be produced after the fact by fortuitous radial transport (Goldberg et al., 2015). Complementarity therefore implies that the separate larger scale reservoirs with mostly solar bulk composition from which the different chondrite classes were assembled were, themselves, either divided into or assembled from smaller scale reservoirs with quite different, strongly non-solar, compositions. In particular for this work, potassium abundances vary by factors of many between different chondrules even within a given chondrite (Hewins, 1991).
As noted above, the sets of small scale reservoirs implied by meteoritic components of differing compositions were correlated as is implied by complementarity. If they were not themselves drawn in some fashion from initial overarching large scale reservoirs of nearly solar composition which were preserved by the chondrite assemblage process, then their very existence across multiple chondrite classes would require an awkward degree of fine tuning. As we will develop in greater detail, the differing potassium abundances imply the existence of small scale reservoirs which were alternately strongly depleted of, and weakly enriched in K. In this paper we examine the conditions, and crucially the time scales, required for splitting an initially solar abundance reservoir into sub-reservoirs with differing potassium abundances. The results are generalizable and can be used to understand the lack of potassium isotope signatures throughout the Solar System, even between objects with wildly varying bulk potassium abundances (Humayun & Clayton, 1995). The calculations further apply for generating any condensation temperature dependent depletions during planet formation although the temperature histories implied would differ.
2 Chondrules and chondrites
Chondrites are a set of classes of undifferentiated meteorites composed of a mix of chondrules, matrix, and other inclusions including Ca-, Al-rich inclusions (CAIs) (Weisberg et al., 2006). Chondrules are sub-mm glassy clasts which were produced by melting dust in the solar nebula, the protoplanetary disk in which our Solar System formed (Hewins, 1997). While the mechanism through which chondrules were made is as yet uncertain, the melting required temperatures above K (Hewins & Radomsky, 1990). Much of the space between chondrules is filled with fine-grained matrix material which was not heated to such a degree. Indeed, evidence suggests that only a small fraction of the matrix material could have been heated above K (Huss & Lewis, 1995; Mendybaev et al., 2002) which means that models for chondrule and chondrite formation must allow for solids that experienced very different thermal histories to have ended up in close proximity (Hubbard & Ebel, 2015).
Researchers have amassed a range of evidences arguing that different classes of chondrites sampled different chondrule or chondrule precursor reservoirs (Jones, 2012). These include differences in oxygen isotope ratios, bulk compositions, chondrule sizes, abundances of relic grains, and chondrule textural types. While taken individually, these lines of evidence are not conclusive but combined they are persuasive enough that in this paper we assume that different chondrite classes did indeed form from distinct reservoirs. Note however that these distinct reservoirs could have had identical bulk abundances and have differed primarily how in the chondrules were processed or how the chondrites were assembled: what matters for this paper is merely the logistical difficulty of generating a multitude of large scale reservoirs which in turn contain a large number of correlated small scale reservoirs.
Among the classification schemes used for chondrules is one that depends on their olivine fayalite (Fe2SiO4) fraction: the more common Type I chondrules have less than mol % fayalitic olivine while the rarer Type II chondrules have Fa mol % (McSween, 1977a, b). A further difference between the two types of chondrules is their moderate volatile content: Type I chondrules are strongly depleted in moderately volatile elements such as sodium and potassium, while Type II chondrules are weakly enriched in those same elements (McSween, 1977a, b; Jones & Scott, 1989; Jones, 1990). This potassium abundance difference will be our focus.
3 Need for sub-reservoirs
Potassium is moderately volatile, with a condensation temperature of approximately K under nebular conditions (Lodders, 2003). That is far lower than the chondrule melting temperature of K, so it is reasonable to imagine that differing thermal histories acting on two separate regions of the solar nebula with identical bulk compositions led to the potassium depletion seen in Type I chondrules. In this paper we will show that the time scales required for such processes are not insignificant.
Importantly, potassium has two abundant stable isotopes, 39K and 41K. Therefore, straightforward partial evaporation would Rayleigh fractionate those isotopes by preferentially evaporating the lighter 39K, leaving a heavy isotopic signature. Neither heavy, nor indeed light, isotopic signatures have been found in chondrules for potassium, or for iron either (Alexander et al., 2000; Alexander & Wang, 2001). There are several broad categories of processes which could explain the differing elemental abundances without leaving behind an isotopic signature.
Firstly, there are processes where the gas and dust were out of isotopic and elemental equilibrium with each other when cooling through the potassium condensation temperatures. In such cases Raleigh fractionation was unavoidable when and where condensation occurred, but only to the degree said condensation actually occurred. For Type I chondrules, that means that they either formed from reservoirs which were tuned to result in both the observed elemental (potassium depleted with respect to CI) and isotopic (not potassium fractionated with respect to CI) abundances, or that their chondrule melting process must have been too short for meaningful evaporation and recondensation to have taken place. Given the spread in the chemical signatures seen across chondrules, it is implausible that so many different initial reservoirs existed whose elemental and isotopic abundances were carefully tuned such that their isotopic compositions converged upon melting, evaporation and recondensation (Hewins, 1991; Humayun & Clayton, 1995).
If on the other hand the heating and cooling associated with chondrule formation was so fast that no evaporation (and subsequent recondensation) occurred, then chondrules explicitly preserve the composition of their precursors. In that case Type I and II chondrules still had to have sampled different reservoirs, but the reservoirs would have only differed in their elemental, but not isotopic, abundances. In this case, the heating and cooling would have had to have been extremely fast: more than K/hr (Yu & Hewins, 1997; Alexander et al., 2000; Alexander, 2004), while current models for chondrule formation struggle to reach even K/hr (Boley et al., 2013). Further, experimental work has established that such cooling rates are too hight to be consistent with the crystallization textures of most chondrules (Desch et al., 2012, and references therein).
Secondly, the gas and dust could have been in equilibrium during at least the cooling phase of chondrule formation, in which case there would be no isotopic signature as long as the total system never developed one (Davis et al., 2005; Alexander et al., 2008). In equilibrium, as condensation occurs solids reabsorb evaporated species; so different equilibrium solid abundances require different system abundances during cooling. This case therefore requires reservoirs which differed in their elemental, but not isotopic, abundances. We divide this case into two: either equilibrium was maintained by not having evaporation and recondensation occur, or it was maintained by having a sufficiently slow process. It would have been possible to avoid evaporation and recondensation if the ambient gas had maintained exactly the correct amount of potassium (perhaps by moving through a planetesimal atmosphere Morris et al. 2012) to match the correct vapor pressure to avoid evaporation and condensation over the thermal history of a given chondrule and for a range of observed potassium depletion patterns in chondrules. That scenario does not seem plausible. It would more naturally arise if the solids were so concentrated that only a negligible degree of K evaporation was needed to reach equilibrium K vapor pressures.
Such large (factors of more than ) increases in the dust concentration are difficult to achieve, especially for chondrule precursors which were presumably porous and therefore at least as well coupled to the gas as chondrules (Jacquet et al., 2012). While turbulence can preferentially concentrate same-sized dust grains (Cuzzi et al., 2001), this requires narrow dust size distributions (Hubbard, 2013). The meteoritic record shows modest but still significant scatter in chondrule sizes even within a given meteorite (Friedrich et al., 2015), so large turbulent dust concentrations are not expected to have occurred. Worse, at the size and densities invoked the dust clouds would have been gravitationally unstable (Alexander et al., 2008), and gravitational collapse occurs quickly, on orbital time scales (Johansen et al., 2009). If the chondrule formation mechanism did not itself generate such dust concentrations, it would require excessive fine tuning for chondrule melting events to have occurred only just before gravitational collapse at a rate sufficient to explain chondrules, while leaving the matrix untouched. Shock models for chondrule melting do concentrate the dust, but only by factors of order ten (Morris et al., 2012); and even if such a coincidence of chondrule heating and dust concentration occurred, it is difficult to imagine how the matrix, which was not heated and makes up a significant fraction of even the ordinary chondrites, could have been evenly mixed in during the gravitational collapse stage of planetesimal formation (Hubbard & Ebel, 2015).
In the cases of both rapid heating and cooling and extreme solid enrichment the initial dust composition matches the final dust composition, so the origin of the reservoirs cannot be due to the chondrule formation process itself. This merely pushes the origin of the Type I and II chondrule potassium difference back in time, and raises the question of how different reservoirs with identical isotopic but different elemental abundances could have been generated without invoking evaporation and condensation. If the elemental composition differences were inherited from pre-solar gas, the lack of an isotopic signature would be quite surprising; but any evaporation and recondensation of K in the solar nebula would have required temperatures on the order of K, high enough to have thermally processed matrix material. That has been ruled out by laboratory analysis (Huss & Lewis, 1995; Mendybaev et al., 2002).
Finally, we are left with the gas and dust having cooled slowly through the condensation temperatures. If they cooled slowly enough, isotopic equilibrium would have been maintained. Further, local processes would have had time to split the large scale reservoir from which a given chondrite was assembled into sub-reservoirs with differing total system (gas plus solids) potassium abundances. In this case the chondrule formation process itself would generate the different potassium elemental abundances without raising isotopic questions, greatly simplifying the logistical difficulties associated with generating many reservoirs with varying elemental abundances.
4 Generating sub-reservoirs
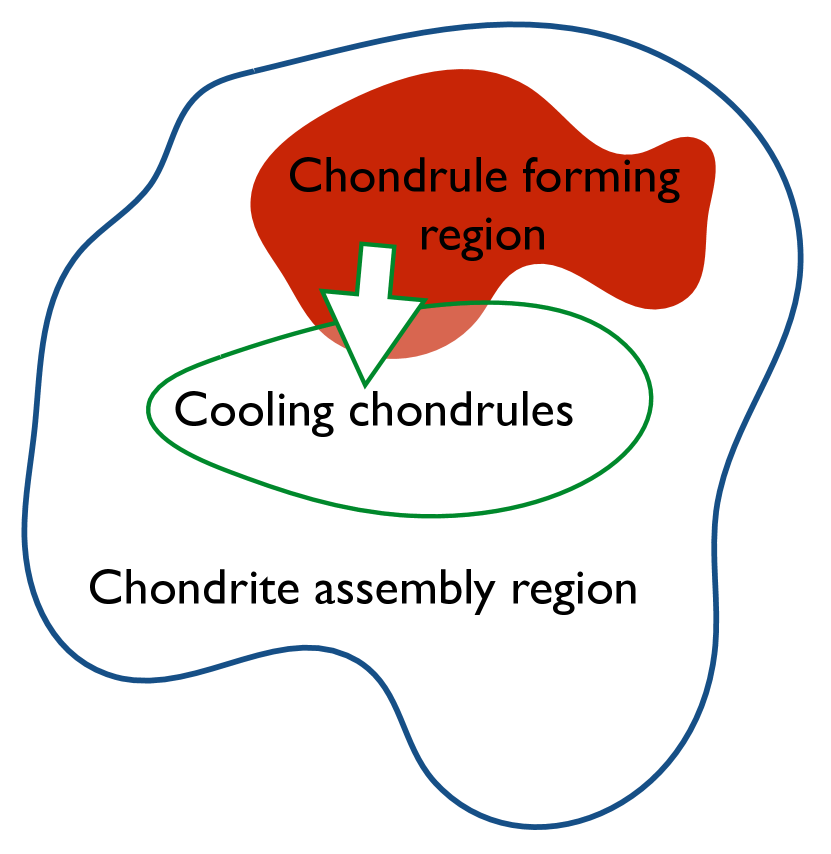
To enrich or deplete the eventual solids in a region of the solar nebula in a moderately volatile element such as K, that element needs to move relative to the “bulk” less volatile elements. The bulk elements can be well represented by Si or Mg, which have similar volatility (% condensation temperatures of order K), and which each provide approximately of the non-oxygen mass of a chondrule (Lodders, 2003). Note that because we are interested in the K/Si or K/Mg ratios, moving potassium out of a region is equivalent to moving Si and Mg into that region, and vice-versa. At this stage we do not need to know the source of the drift speed, but only its strength. We sketch a cartoon of this process in Figure 1. In it, we show a chondrite assembly region of CI composition. A subsection of it heats to make chondrules, which then drift out of the heating area slowly, leaving the evaporated potassium behind. When they finally cool, they do so in a region with only a small amount of potassium, so only a small amount of potassium recondenses into the chondrules. Once that chondrule forming region also cools, most of the evaporated potassium would instead recondense onto matrix grains. Because the chondrules and the evaporated potassium stay within the larger chondrite assembly area, complementarity is maintained, and if the drift is slow enough, isotopic equilibration would be maintained.
For simplicity, we assume that the relative motion occurs along a single direction, which we label with the coordinate . If we assume that one participant (volatile or refractory) is tied to the nebular gas and well mixed, while the other participant has a drift speed and experiences a turbulent diffusion , then a steady state is reached when the drift balances diffusion, i.e., when
| (1) |
where is the concentration (with respect to the nebular gas) of the mobile element. Solving Equation (1) we find
| (2) |
where is the concentration at . Equation (2) leads us to define the length scale
| (3) |
Depletion or enrichment patterns then can be generated only on length scales . Diffusion is extremely effective at erasing small scale structures so large drift velocities are required to maintain small scale structures, while large scale structures are easier to preserve in the face of diffusion.
However, steady states are not achieved instantly, and it will take a time of order
| (4) |
to generate the depletions or enrichments: while large scale structures can achieve significant concentration differences with only moderate drift speeds, those concentration differences require a long time to set up.
To make contact with standard disk theory we scale
| (5) |
and
| (6) |
where is the gas background sound speed, measures in terms of , is the Shakura-Sunyaev parameter (Shakura & Sunyaev, 1973), the gas scale height, and is the Keplerian frequency. Note that we will use to refer to the background disk sound speeds; and for the gas thermal speed in the potassium condensation regions: the existence of cold matrix implies that most of the solar nebula remained cold, well below K condensation temperatures so chondrule forming regions are expected to contain only a small fraction of the total volume (Hubbard & Ebel, 2015).
With those scalings, we have
| (7) |
where is the local orbital period. Note that disks with turbulence driven by orbital shear assume turbulent speeds of order
| (8) |
If the drift speed is due to turbulence, we would expect and so and .
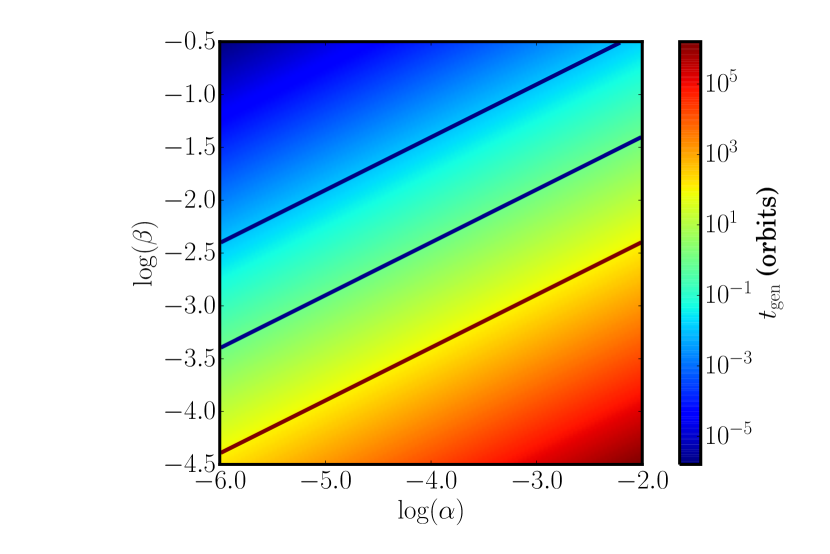
We plot Equation (7) in Figure 2, showing curves of orbits. We use as a lower cut-off for the turbulent diffusion because even very laminar disks are expected to be somewhat turbulent and said turbulence will propagate from the turbulent surface layers to the midplane (Oishi & Mac Low, 2009). Note that to manage Orb for we require .
5 Drift Speeds
As discussed in Section 3, the different reservoirs that produced Type I and II chondrules respectively must have existed within the already different reservoirs that produced the different chondrite classes. To avoid a fine tuning problem we have adopted the assumption that chondrule formation itself naturally produced sub-reservoirs with differing levels of potassium. This process must occurred slowly enough that K isotopic equilibration between gas and dust was continuously maintained. We will also assume elemental equilibration between gas and solids, i.e. that the composition of the solids is only a function of the total (gas and solids) composition and the temperature. This assumption only applies during chondrule formation and any subsequent thermal processing; and is relaxed for temperatures well below K, when equilibration would take such long time scales that compositions can be considered frozen.
Generating such sub-reservoirs required moving K with respect to Si and Mg, without moving potassium isotopes with respect to one another. The mobile element(s) could have been in the solid or gas phase. If all the elements were in the solid phase, this requires both that there existed categories of dust rich in and depleted in potassium, and that these categories of dust had different aerodynamical properties. We neglect that possibility because this merely pushes the sub-reservoir problem back to the dust growth stage. Note that a mm (Friedrich et al., 2015) chondrule made from m interstellar grains would contain the record of of them, while chondrule precursors would have have K mass fractions of order (Lodders, 2003). This means that K is far too abundant for nugget effects to explain its abundances variations between chondrule sized samples.
In what follows we will assume a Hayashi Minimum Mass Solar Nebula (MMSN, Hayashi, 1981) normalized to AU, the location of the asteroid belt:
| (9) | |||
| (10) | |||
| (11) | |||
| (12) | |||
| (13) |
where . Unless otherwise specified, we will assume that the local (hot) gas had a temperature K with associated thermal speed
| (14) |
where
| (15) |
was the mean molecular mass of the gas (). Combining Equations (10) and (14), we find
| (16) |
Because we are interested only in the potassium signal, and can take chondrule formation as a laboratory given, the details of the dust dynamics prior to chondrule formation, and the details of the chondrule formation scenarios themselves are not vital. Different chondrule formation scenarios naturally allow for different drift speeds, and requirements on will limit the space of viable chondrule formation scenarios.
5.1 Gas motion
If two species were in the gas phase, then for one to have moved with respect to another at meaningful speeds there needs to have existed a force acting differently on two species. An atom of a given species of mass will encounter its own mass in other atoms in a time
| (17) |
where
| (18) |
is number density of the gas and is the effective collisional cross-section.
A force density exerted on species (and only on species ) would then drive a drift velocity
| (19) |
Most forces in protoplanetary disks act on the bulk fluid (e.g. thermal pressure and gravity), and would only drive drift due to smaller differential velocities between different species with differing masses and collisional cross-sections. However, magnetic pressure offers a possible force which could act on potassium differently than on Mg or Si.
Neutral particle do not feel magnetic forces, so magnetic pressure acts on the disk’s gas by exerting a force on charged ions which in turn collide with the mostly neutral gas. Because the ion/neutral coupling is not quite perfect, the ions undergo a slow ambipolar drift through the gas according to Equation (19). Chondrule forming regions are hot enough to thermally ionize potassium. If K+ is the dominant ion, then the potassium will experience that drift. Note however that type I and II chondrules also differ in their sodium abundances, and sodium is significantly harder to thermally ionize than potassium, and so would drift less.
We can place limits on by comparing it to
| (20) |
the force density required to maintain a bulk gas density variation over a local gas scale height. For , we find
| (21) |
In that case, and for cm2 and , we have
| (22) |
which corresponds to
| (23) |
That value for is too low to be included on Figure 2, and thanks to the weak radial dependence requires Orb at any orbital position for which the MMSN model applies.
Even in the presence of an extreme magnetic pressure force, and with only extremely weak turbulence, generating elemental abundance differences purely in the gas phase requires many century-scale times. In practice magnetic pressures are lower than assumed in this calculation, and other ions also bear part of the burden (which is important because if K is the only species providing ions, then only the K abundances would be altered through ambipolar drift), both of which would act to reduce and increase even further.
5.2 Dust motion
At temperatures between about K K, where potassium is partially or fully in the gas phase while Si and Mg are fully condensed, moving the solids through the gas will alter the K/Si and K/Mg ratios. The motion will not inherently generate an isotopic signature because the motion of a dust grain does not meaningfully depend on the difference between even a significant fraction of 39K or 41K atoms. However, if the gas and dust are not in isotopic equilibrium, then dust motion will transport one isotope preferentially. We must therefore assume long enough time scales for the solid motion that equilibration between gas and dust occurs continuously (for a similar process, see Hubbard & Ebel 2014). Further, to reproduce the degree of potassium depletion seen in Type I chondrules (, Hewins 1991), the temperature must have been elevated enough for K to have mostly evaporated while the dust was in motion with respect to the gas.
5.2.1 Settling
Dust embedded in gas tends to drift towards pressure maxima (Weidenschilling, 1977). The strongest non-transient pressure gradient in a protoplanetary disk is the vertical one: residual gravity pulls gas and dust towards the midplane, and while a vertical pressure gradient can maintain the gas in hydrostatic equilibrium, the dust does not feel the pressure forces and settles downwards. Other pressure maxima exist in disks, such as zonal flows (Dittrich et al., 2013), although their strength is comparatively limited and they are not expected to last for the entire disk life time. As such, barring extreme examples which are unlikely to have been correlated with chondrule formation (perhaps a radial gap opened by a planet, Zhu et al. 2012), settling can be taken as the strongest drift speed due to gas pressure gradients.
Dust motion through gas is controlled by drag. The equation of motion for dust is
| (24) |
where is the dust velocity, the gas velocity at the dust grain’s position, the gravitational acceleration and the drag time.
Chondrules have radii significantly smaller than the expected gas molecular mean free path (tens of centimeters for g cm-3), which places them in the Epstein drag regime, with
| (25) |
where and are the dust grain radius and solid density, and is the actual local gas thermal speed rather than the background disk sound speed . We non-dimensionalize through
| (26) |
the dust Stokes number.
Noting that for a gas disk in vertical hydrostatic equilibrium
| (27) | |||
| (28) |
where is the midplane gas density, we can write
| (29) |
where
| (30) |
is the dust Stokes number at the midplane. Combining Equations (12) and (30) we find that an mm, g cm-3 chondrule would have had
| (31) |
For a dust grain of radius at constant mass ,
| (32) |
From Equation (25) we can see that at constant mass then,
| (33) |
and note that more porous particles are better coupled to the gas. The porosity of collisionally grown aggregates is as yet uncertain, but in the absence of thermal processing is certainly significant (%) (Zsom et al., 2010) and if compaction is inefficient, could be almost arbitrarily close to unity (Wada et al., 2008).
From Equation (31), we can see that chondrule-sized grains are small enough that terminal velocity can be assumed:
| (34) |
The vertical force of gravity in disks is
| (35) |
which results in a settling speed
| (36) |
Using and Equation (29) we arrive at
| (37) |
Equations (33) and (37) show how chondrule formation events would be correlated with settling: thermal processing of high porosity dust leads to compaction, reducing drag, and raising St (Hubbard & Ebel, 2014).
Estimating
| (38) |
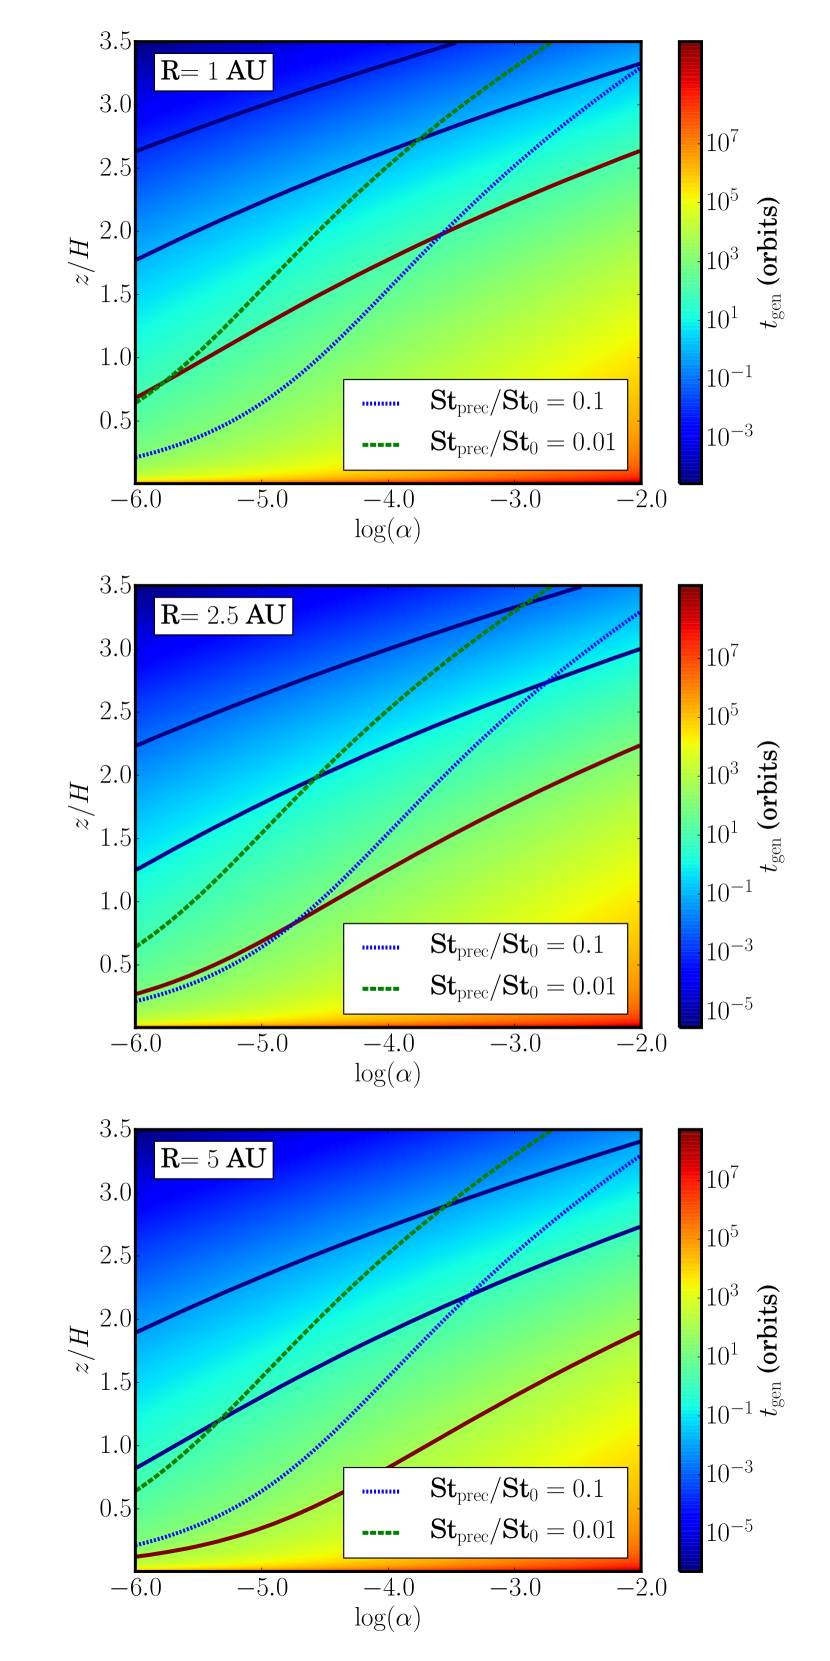
we can use Equations (7) and (37) to calculate as a function of and as shown in Figure 3 for and AU. As might be expected, the lower gas densities at larger orbital positions leads to settling being faster. While could be less than Orb for low levels of turbulence at modest altitude, such weak turbulence would be unable to strongly loft the chondrule precursors. Takeuchi & Lin (2002) found that the maximum height to which turbulence will loft grains is approximately
| (39) |
Chondrule precursor grains with initial porosities of would have had . The dotted and dashed lines in Figure 3 show the maximum height to which such precursors grains could have been lofted.
In this scenario, values of Orb were therefore possible only for extremely porous precursor grains (porosities above ) at very high altitudes () at significant ( AU) orbital positions, although the altitude and porosity constraints would relax for very large . Even values of Orb still require highly () porous grains and high () altitudes at AU although again, those constraints are somewhat relaxed by AU. Note that only about of the gas mass was at heights above H, and even less of the partially settled, dust mass, so chondrule formation would need to have been quite efficient if restricted to that altitude.
While Figure 3 shows that settling is more effective at larger orbital positions, it measure in units of the local orbit, which also increases with . While measuring in orbits is useful for comparisons to disk dynamical (e.g. turbulent) time scales, it is less useful for comparison to chemical time scales. For those purposes, we invoke Equation (38) to write
| (40) |
so for settling, larger is associated with shorter absolute time scales as well.
5.2.2 Photophoresis
Photophoresis is a process in which differences in the illumination on two sides of a dust grain generates and maintains a temperature gradient through the grain (Ehrenhaft, 1918). As a result, gas molecules rebound faster from the hot side than the cold side, creating a net force that pushes the dust towards its cold side. Photophoresis depends strongly on the details of dust grains’ internal thermal conduction. While that can become extremely involved for porous grains (Matthews et al., 2016), chondrule forming regions were by definition hot enough to melt the dust, leaving only comparatively simple solid silicate spheres.
To trap their heat, chondrule forming regions were presumably optically thick, and unable to feel stellar irradiation. However, they were also hot enough to generate their own strong radiation fields that could have driven photophoresis. Recently McNally & Hubbard (2015) derived the photophoretic velocity in the optically thick limit, finding that for solid chondrules with thermal diffusivity erg s-1 cm-1 K-1,
| (41) |
where is the Rosseland mean opacity and
| (42) |
measures the temperature gradient in units of optical depths. McNally et al. (2014) found for MRI turbulence, although those models assumed a temperature independent opacity and larger values could easily occur under more realistic assumptions, and could have driven much larger values of .
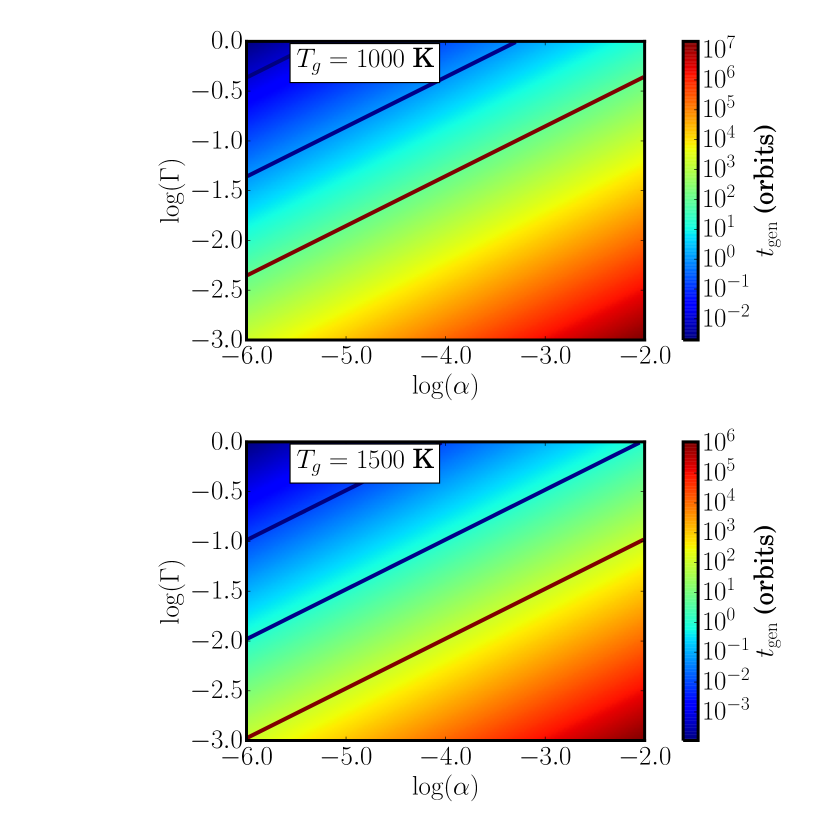
In Figure 4 we show the time scale as a function of and for K at AU. Values of Orb were possible only for extremely large () temperature gradients combined with the weakest turbulence we consider (). Values of Orb are more plausible, but still required significantly larger values of than have been seen to date combined with extremely laminar disks. In Equation (41), is due to the chondrule forming event, rather than the background disk temperature, so is independent of orbital position. From Equation (7), we therefore have
| (43) |
and
| (44) |
In terms of dynamical time scales, photophoresis is more effective at larger , but in terms of absolute time scales, it is more effective at smaller . Neither of the dependencies is strong enough to alter the above conclusions for reasonable ranges of .
5.2.3 Turbulent thermal diffusion
Turbulent thermal diffusion (TTD) is a process where turbulence preferentially transports moderately well coupled dust grains down gas temperature gradients (from hot to cold) (Elperin et al., 1996). A quick reading of Hubbard (2015b) would suggest that the regions we are considering are warm enough that thermal relaxation would halt the TTD: if turbulent eddies rapidly thermally equilibrate with their surroundings the effects of the temperature gradient are reduced. However, regions associated with chondrule formation are often quite rarified. A AU MMSN midplane at K would have a gas density of g cm-3, and higher temperature or altitude regions would be expected to be even less dense. Further, during chondrule formation we expect nebular fines to evaporate, and large grains to compactify, resulting in relatively poor gas-dust thermal coupling, and the gas-dust thermal coupling time can dominate over turbulent time scales.
In high temperature regions, without ices, the gas-to-dust ratio for a mixture of nebular composition is approximately (Lodders, 2003). Accordingly, a single grain of mass mediates the radiative thermal relaxation for a parcel of gas of mass . A temperature perturbation of for that parcel corresponds to a thermal energy perturbation of
| (45) |
where is the adiabatic index. Even if the dust temperature is set by radiative equilibrium with the surroundings, the gas will take a time
| (46) |
to thermally equilibrate with the dust, where the factor of is rate at which gas impinges on the dust grain, and is the thermal accommodation coefficient. Equation (46) can be expanded to find
| (47) |
This implies
| (48) |
From appendix A6 of (Hubbard, 2015b), the turbulent thermal diffusion velocity is
| (49) |
where and are the limiting wavenumbers of the turbulence which contributes to the TTD, and is a constant of order unity. The upper limit, is set by the stopping time of the dust grains: turbulent motions with shorter correlation times than the dust stopping time do not contribute. The thermal relaxation time sets the lower limit : turbulent motion with correlation times longer than the thermal relaxation time do not contribute. For a Kolmogorov cascade, the wavenumber scales with the turbulent correlation time as
| (50) |
so Equation (49) becomes
| (51) |
We can estimate
| (52) |
If we further assume that the temperature gradient was comparable to the local scale height, then , and at AU,
| (53) |
which corresponds to
| (54) |
That value of would have been sufficient to allow for short Orb for weak, , turbulence. However, Equation (49) does not apply when would be comparable to the turbulent speed at the length scale . Assuming that the largest scale turbulence has a velocity scale and a time scale , we have
| (55) |
We therefore have the further constraint that , which implies and hence
| (56) |
and
| (57) |
6 Comparison to cooling constraints
As shown in Section 5, for reasonable ranges of , values of Orb were only achievable through settling, and even then, only if chondrule formation were limited to extreme altitudes () and chondrule precursors were extremely porous (less than volume filling fraction). Values of on the order of an orbit was possible through settling at more reasonable, if still high altitudes () and for significantly more compacted precursors ( porosities). At the midplane, turbulent thermal diffusion can drive , but significantly smaller values are not expected except for very small . On the other hand, we do not expect hot thermal structures in the disk to have been extremely long lived, so Orb would seem a reasonable upper limit.
Accordingly, generating chondrules with significant potassium depletion through evaporation required timescales
| (58) |
If those time scales were not available or are otherwise ruled out, the origin of the potassium abundance variation between chondrules becomes a significant logistical problem. While the details do depend on the orbital position, the dependencies are not extreme, and these conclusions easily hold for AU AU.
6.1 Chondrule cooling times
These time scales required in Equation (58) are in significant tension with laboratory chondrule cooling constraints. While the experimental limits on chondrule cooling rates vary significantly: K/hr (Desch et al., 2012, and references therein). Even a very low rate of Khr would cool from K to K in under three days, approximately Orb at AU; and the upper end of the cooling rate are far faster, with corresponding far shorter . The laboratory constrained cooling time scales put upper limits on the cooling time which are far too short to have allowed particles time to move through the gas and set up potassium abundance variations (i.e. Orb ).
However, these cooling times are not strictly incompatible with because the cooling rate limits primarily measure thermal histories at crystallization temperatures well above the K condensation temperature which constrains . The two constraints can be simultaneously satisfied if the chondrules cooled rapidly through their liquidus temperatures ( K, Hewins & Radomsky, 1990), matching observed crystallization patterns; but then lingered for orbital time scales at K recondensation temperatures ( K) allowing the chondrules to move sufficiently through the gas to generate the observed potassium abundance variations.
7 Isotopic equilibrium and zoning
A further constraint comes from the lack of a potassium isotopic signature. In the above analysis leading to Equation (58) we have only calculated the time scale required to move chondrules to low potassium regions while the K is entirely evaporated. This means that we have assumed that , where is potassium’s partial pressure were it entirely in the gas phase, and its saturation vapor pressure. However, when the potassium recondensed the system moved to the opposite limit, with . This transition was presumably due to cooling, either because the chondrules moved to regions of lower ambient temperature, or the entire region cooled.
Note that once began to recondense, the chondrules contributed to the net transport of potassium; and it is imaginable that, were they to have drifted sufficiently rapidly through the gas, they could have entered a region where would evaporate. We will therefore assume that, especially given the long we predict, the chondrules drifted sufficiently slowly that the system only experienced condensation, i.e. that at all time , where is K’s actual partial partial pressure.
We can follow the results of Richter (2004), invoking a thermal time scale which measures the time for the chondrules to have cooled from being just cool enough for meaningful recondensation to occur to temperatures sufficiently low that complete recondensation can be assumed. We assume that the gas and chondrule fluid densities were high enough that Richter’s ; and note that Richter’s residence time is conceptually similar to our (although we have the solid, not the gas phase, moving through space). We will also consider the time for K to diffusion through the chondrules near its condensation temperature.
To avoid generating an isotopic signature we need at least one of:
| (59) |
in which case the chondrules were in continuous equilibrium with the gas; or
| (60) |
in which case all the available potassium would have recondensed at once, avoiding any isotopic signatures. In this latter case however, if
| (61) |
we would expect the deposition of a potassium layer on the surface of the chondrules, and significant zoning within the chondrules. That is significant because when chondrule precursors melted, they lost potassium proportional to their mass, while when K recondensed it did so at a rate proportional to the surface area: large grains would have become depleted compared to small grains.
7.1 Alkali diffusion times
In general, for element ,
| (62) |
where is the appropriate diffusion coefficient for that element. Unfortunately, diffusion coefficient measurements for K and Na through different minerals differ by orders of magnitude depending on the mineral. In Table 1 we list the diffusion coefficients for K and Na in rhyolite and albite (Brady, 2013, and references therein), as well as the associated diffusion timescales through mm spheres. We can see that, in general, Na diffuses rapidly and is expected to satisfy , but, depending on the minerals involved, K may not.
| Mineral | Na | K |
|---|---|---|
| s | s | |
| s | s | |
This means that the lack of Na zoning seen by Alexander et al. (2008) is not unexpected for a locally generated depletion/enhancement of Na (which would be expected to track that of K given their similar volatility): chondrules are expected to internally equilibrate Na on time scales . The “a few” orders of magnitude difference between Na and K diffusivities also suggests that any observed difference in K and Na zoning within a given chondrule would, if combined with a detailed internal diffusion model for that chondrule, provide a direct measure for : the condensation temperatures for Na and K are sufficiently close that the two elements experienced similar values of and .
8 Conclusions
The observed strongly varying degrees of potassium depletion between chondrules required the existence of separate reservoirs with different alkali metal abundances. We have explored how such different reservoirs could have been locally created in the solar nebula, concluding that while they might have been straightforwardly produced by heating the gas enough to evaporate the alkalis and subsequently transporting the solids through the gas, leaving the alkalis behind, the time scales required were significant: sub-orbital to hundreds of orbits. Further, the lower end of the time scales are only available if chondrule formation occurred at altitude, and chondrule precursors were very porous. This porosity requirement is problematic because high dust porosities are not expected to survive temperatures K (far below chondrule processing temperatures): silicate grains are expected to rapidly coalesce at such temperatures, reducing their porosity (Hubbard, 2015a). If chondrule formation occurred at the midplane, the minimum time scales balloon to tens of orbits. This is not entirely surprising: chondrules are very small, and hence were very well tied to the gas (Jacquet et al., 2012; Hubbard & Ebel, 2015). Moving chondrules through the gas was hence a laborious process.
Such long time scales are in significant tension with laboratory estimates of chondrule cooling rates, which were much faster. That tension would be resolved if newly formed chondrules rapidly cooled enough to lock in their petrology ( K, Hewins & Radomsky, 1990), but subsequently stayed warm ( K) for long enough for them to have slipped through the gas. On the other hand, long timescales could simplify the puzzling lack of Na zoning in chondrules seen by Alexander et al. (2008): if the chondrules stayed warm long enough for Na (and possibly K) to have fully diffused through its host, then there would have been no need for extreme concentrations of solids in chondrule forming regions. Staying at K for prolonged periods is significant because that temperature is associated with thermal ionization of alkali metals which are significantly evaporated, allowing the MRI to be active (Gammie, 1996). This would support the case for MRI turbulent dissipation as a chondrule heating mechanism (Hubbard et al., 2012; McNally et al., 2013, 2014).
If, however, such time scales spent warm were not available, then the origin of the different reservoirs with differing elemental, but not isotopic, abundances becomes a major logistical problem. The lack of a potassium isotopic signature rules out a pre-solar source for the different reservoirs, and any other model will have to wrestle with the improbabilities associated with generating many reservoirs. That difficulty is compounded by complimentarity, which argues that the reservoirs from which chondrules in a given chondrite formed were correlated. Further, the presence of cold matrix strongly constrains the amount of thermal processing that could have occurred in the solar nebula: most of the solids were never thermally processed enough to evaporate potassium (Hubbard & Ebel, 2015), so if the potassium abundance variations were thermal in origin, and were generated in the solar nebula, they must have been correlated with chondrule formation, lest the thermally processed material show up in the matrix.
The long time scales required to have generated potassium abundance variations in the solar nebula can also explain the lack of potassium isotope signatures throughout the Solar System, even between bodies with wildly varying potassium abundances (Humayun & Clayton, 1995). Isotopic equilibration is to be expected if, as in the case of chondrules, the time scales required to physically move the solids through gas (which is required to deplete or enhance the potassium abundances) are long compared to K’s evaporation or recondensation time scales. Indeed, a potassium isotopic signature would be of great use in determining the time scale of physical processes in the solar nebula.
Acknowledgements
The research leading to these results received funding from NASA OSS grant NNX14AJ56G.
References
- Alexander (2004) Alexander, C. M. O. . 2004, Geochimica Cosmochimica Acta, 68, 3943
- Alexander et al. (2008) Alexander, C. M. O. ., Grossman, J. N., Ebel, D. S., & Ciesla, F. J. 2008, Science, 320, 1617
- Alexander et al. (2000) Alexander, C. M. O., Grossman, J. N., Wang, J., et al. 2000, Meteoritics and Planetary Science, 35, 859
- Alexander & Wang (2001) Alexander, C. M. O., & Wang, J. 2001, Meteoritics and Planetary Science, 36, 419
- Bai (2014) Bai, X.-N. 2014, ApJ, 791, 137
- Boley et al. (2013) Boley, A. C., Morris, M. A., & Desch, S. J. 2013, ApJ, 776, 101
- Brady (2013) Brady, J. B. 2013, Diffusion Data for Silicate Minerals, Glasses, and Liquids (American Geophysical Union), 269
- Cuzzi et al. (2001) Cuzzi, J. N., Hogan, R. C., Paque, J. M., & Dobrovolskis, A. R. 2001, ApJ, 546, 496
- Davis et al. (2005) Davis, A. M., Alexander, C. M. O., Nagahara, H., & Richter, F. M. 2005, in Astronomical Society of the Pacific Conference Series, Vol. 341, Chondrites and the Protoplanetary Disk, ed. A. N. Krot, E. R. D. Scott, & B. Reipurth, 432
- Desch et al. (2012) Desch, S. J., Morris, M. A., Connolly, H. C., & Boss, A. P. 2012, Meteoritics and Planetary Science, 47, 1139
- Dittrich et al. (2013) Dittrich, K., Klahr, H., & Johansen, A. 2013, The Astrophysical Journal, 763, 117
- Draine (2003) Draine, B. T. 2003, ARA&A, 41, 241
- Ehrenhaft (1918) Ehrenhaft, F. 1918, Annalen der Physik, 361, 81
- Elperin et al. (1996) Elperin, T., Kleeorin, N., & Rogachevskii, I. 1996, Physical Review Letters, 76, 224
- Friedrich et al. (2015) Friedrich, J. M., Weisberg, M. K., Ebel, D. S., et al. 2015, Chemie der Erde - Geochemistry, 75, 419
- Gammie (1996) Gammie, C. F. 1996, ApJ, 457, 355
- Goldberg et al. (2015) Goldberg, A. Z., Owen, J. E., & Jacquet, E. 2015, MNRAS, 452, 4054
- Hayashi (1981) Hayashi, C. 1981, Progress of Theoretical Physics Supplement, 70, 35
- Hewins (1991) Hewins, R. H. 1991, Geochimica Cosmochimica Acta, 55, 935
- Hewins (1997) Hewins, R. H. 1997, Annual Review of Earth and Planetary Sciences, 25, 61
- Hewins & Radomsky (1990) Hewins, R. H., & Radomsky, P. M. 1990, Meteoritics, 25, 309
- Hezel & Palme (2010) Hezel, D. C., & Palme, H. 2010, Earth and Planetary Science Letters, 294, 85
- Hubbard (2013) Hubbard, A. 2013, MNRAS, 432, 1274
- Hubbard (2015a) Hubbard, A. 2015a, Icarus, 254, 56
- Hubbard (2015b) Hubbard, A. 2015b, ArXiv e-prints, arXiv:1512.02538 [astro-ph.EP]
- Hubbard & Ebel (2014) Hubbard, A., & Ebel, D. S. 2014, Icarus, 237, 84
- Hubbard & Ebel (2015) Hubbard, A., & Ebel, D. S. 2015, Icarus, 245, 32
- Hubbard et al. (2012) Hubbard, A., McNally, C. P., & Mac Low, M.-M. 2012, ApJ, 761, 58
- Humayun & Clayton (1995) Humayun, M., & Clayton, R. N. 1995, Meteoritics, 30, 522
- Huss & Lewis (1995) Huss, G. R., & Lewis, R. S. 1995, Geochimica Cosmochimica Acta, 59, 115
- Jacquet et al. (2012) Jacquet, E., Gounelle, M., & Fromang, S. 2012, Icarus, 220, 162
- Johansen et al. (2009) Johansen, A., Youdin, A., & Mac Low, M.-M. 2009, ApJ, 704, L75
- Jones (1990) Jones, R. H. 1990, Geochimica Cosmochimica Acta, 54, 1785
- Jones (2012) Jones, R. H. 2012, Meteoritics and Planetary Science, 47, 1176
- Jones & Scott (1989) Jones, R. H., & Scott, E. R. D. 1989, in Lunar and Planetary Science Conference Proceedings, Vol. 19, Lunar and Planetary Science Conference Proceedings, ed. G. Ryder & V. L. Sharpton, 523
- Lodders (2003) Lodders, K. 2003, ApJ, 591, 1220
- Lynden-Bell & Pringle (1974) Lynden-Bell, D., & Pringle, J. E. 1974, MNRAS, 168, 603
- Matthews et al. (2016) Matthews, L. S., Kimery, J. B., Wurm, G., et al. 2016, MNRAS, 455, 2582
- McDonough (2003) McDonough, W. F. 2003, Treatise on Geochemistry, 2, 547
- McNally & Hubbard (2015) McNally, C. P., & Hubbard, A. 2015, ApJ, 814, 37
- McNally et al. (2013) McNally, C. P., Hubbard, A., Mac Low, M.-M., Ebel, D. S., & D’Alessio, P. 2013, ApJ, 767, L2
- McNally et al. (2014) McNally, C. P., Hubbard, A., Yang, C.-C., & Mac Low, M.-M. 2014, ApJ, 791, 62
- McSween (1977a) McSween, Jr., H. Y. 1977a, Geochimica Cosmochimica Acta, 41, 477
- McSween (1977b) McSween, Jr., H. Y. 1977b, Geochimica Cosmochimica Acta, 41, 1843
- Mendybaev et al. (2002) Mendybaev, R. A., Beckett, J. R., Grossman, L., et al. 2002, Geochimica Cosmochimica Acta, 66, 661
- Morris et al. (2012) Morris, M. A., Boley, A. C., Desch, S. J., & Athanassiadou, T. 2012, ApJ, 752, 27
- Oishi & Mac Low (2009) Oishi, J. S., & Mac Low, M.-M. 2009, ApJ, 704, 1239
- Palme (2000) Palme, H. 2000, Space Sci. Rev., 92, 237
- Palme et al. (2015) Palme, H., Hezel, D. C., & Ebel, D. S. 2015, Earth and Planetary Science Letters, 411, 11
- Richter (2004) Richter, F. M. 2004, Geochimica Cosmochimica Acta, 68, 4971
- Shakura & Sunyaev (1973) Shakura, N. I., & Sunyaev, R. A. 1973, A&A, 24, 337
- Takeuchi & Lin (2002) Takeuchi, T., & Lin, D. N. C. 2002, ApJ, 581, 1344
- Van Schmus & Wood (1967) Van Schmus, W. R., & Wood, J. A. 1967, Geochimica Cosmochimica Acta, 31, 747
- Wada et al. (2008) Wada, K., Tanaka, H., Suyama, T., Kimura, H., & Yamamoto, T. 2008, ApJ, 677, 1296
- Weidenschilling (1977) Weidenschilling, S. J. 1977, MNRAS, 180, 57
- Weisberg et al. (2006) Weisberg, M. K., McCoy, T. J., & Krot, A. N. 2006, Systematics and Evaluation of Meteorite Classification, ed. D. S. Lauretta & H. Y. McSween, 19
- Yu & Hewins (1997) Yu, Y., & Hewins, R. H. 1997, in Lunar and Planetary Inst. Technical Report, Vol. 28, Lunar and Planetary Science Conference, 1613
- Zhu et al. (2012) Zhu, Z., Nelson, R. P., Dong, R., Espaillat, C., & Hartmann, L. 2012, ApJ, 755, 6
- Zsom et al. (2010) Zsom, A., Ormel, C. W., Güttler, C., Blum, J., & Dullemond, C. P. 2010, A&A, 513, A57