Interacting social processes on interconnected networks
Abstract
We propose and study a model for the interplay between two different dynamical processes –one for opinion formation and the other for decision making– on two interconnected networks and . The opinion dynamics on network corresponds to that of the M-model, where the state of each agent can take one of four possible values (), describing its level of agreement on a given issue. The likelihood to become an extremist () or a moderate () is controlled by a reinforcement parameter . The decision making dynamics on network is akin to that of the Abrams-Strogatz model, where agents can be either in favor () or against () the issue. The probability that an agent changes its state is proportional to the fraction of neighbors that hold the opposite state raised to a power . Starting from a polarized case scenario in which all agents of network hold positive orientations while all agents of network have a negative orientation, we explore the conditions under which one of the dynamics prevails over the other, imposing its initial orientation. We find that, for a given value of , the two-network system reaches a consensus in the positive state (initial state of network ) when the reinforcement overcomes a crossover value , while a negative consensus happens for . In the phase space, the system displays a transition at a critical threshold , from a coexistence of both orientations for to a dominance of one orientation for . We develop an analytical mean-field approach that gives an insight into these regimes and shows that both dynamics are equivalent along the crossover line .
I Introduction
The study of complex networks has become a matter of great interest to scientists, due to the large number of real systems that evolve on top of these kind of topological structures, such as human societies, climate, transportation and physiological systems. For many years researchers were focused on studying the topology of isolated networks, and its effect on different dynamics New_10 ; Cohen_10 ; Bara_02 ; Pastor_15 ; Vazquez_08 ; Vazquez_10 ; Sanmiguel_09 ; Lar_09 ; Ana_01 ; Val_11 ; Bashan_01 ; Goz_08 ; Dan_14 . However, it is known that many real-world systems are not isolated but they interact with each other, and they are well described by a multilayer system of interconnected networks Domenico_13 ; Boccaletti_14 ; Jianxi_10 ; Perc_15 , where nodes belonging to different networks interact. A different multilayer context is that of multiplex networks, in which the same nodes exist –and represent the same entity– in different network layers (see Boccaletti_14 and references therein). The study of multilayer systems allows to understand the interplay between complex networks, and how this affects the processes propagating on them, e.g, synchronization Gambuzza_15 ; Torres_15 , diffusion Gomez_13 , percolation Bul_01 ; Gao_12 ; Val_13 ; Hackett_16 ; Baxter_16 ; Dimuro_16 and epidemic spreading Buono_14 ; Buono_15 ; AlvarezZuzek_15 ; Cozzo_13 ; Granell_13_1 ; Alvarez-Zuzek_15 ; Saumell_12 ; Vazquez_16 ; Scoglio_14 . Within the context of social science, the study of social phenomena on multilayers is relatively new Boccaletti_14 . Multilayer networks have recently been applied to study opinion dynamics Fort_01 , a topic that has many analogies with the dynamics of species competition Galam98 , and that has been extensively studied by statistical physicists. In reference Halu_13 , Halu et al. use two interacting networks to describe two political parties that compete for votes in an election. Diakonova et al. explored in Diakonova_14 the dynamics of the voter model for opinion formation on a bilayer network system with coevolving links, and also studied in Diakonova_16 the reducibility of the voter model on a two-layer multiplex to a single layer system.
The process of opinion formation may affect and depend on other social processes like decision making Galam97 , due to the relationships between the individuals taking part in each of these two processes. For instance, people in a civil society discuss and form their opinions on a given issue, such as the legalization of the marriage between people of the same sex. However, the decision on whether the same-sex marriage law is approved or not is discussed and finally taken in a legislative body, such as the Congress. As a consequence, these two social groups –society and Congress– influence each other, as congressmen form part and interact with members of the society and, at the same time, people in the society are influenced by what the Congress is deciding.
In this article we investigate the interaction between two social dynamics, one for opinion formation and the other for decision making, that take place on two interconnected networks. The dynamics for opinion formation corresponds to that of the model proposed by La Rocca et. al Larocca14 , to which we refer as the M-model. This model possesses different states describing the spectrum of possible opinion orientations on a given issue, from totally against (state ) to totally in favor (), with some moderate opinions between these extreme values. The M-model explains the phenomena of polarization in a population of individuals that evolve under pairwise interactions, by implementing two main social mechanisms for opinion formation, compromise and persuasion Mas_13 ; Mas_13b ; Balenzuela_15 . The decision making dynamics is akin to that of the Abrams-Strogatz (AS) model AS_03 ; Vazquez_10 (originally introduced to study language competition), where agents can choose between only two possible choices, to be either in favor () or against () the issue. Each agent may change its decision by a mechanism of social pressure, in which the probability of switching its present choice increases non-linearly with the number of neighbors that make the opposite choice. In this work, we set the system to explore a hypothetical polarized scenario where, initially, all the agents in the opinion network are in favor of the issue (positive orientations), while all the agents in the decision network are against (negative orientations). By means of this simple model we address the following questions: under which conditions the opinion dynamics is able to influence and reverse the initial orientation of the decision network? Which dynamics is stronger and prevails in the long run? We need to mention that the present proposed model on two interacting networks has some analogies with models of coupled spin systems previously studied to describe the phase diagram of orientational glasses Galam87 ; Galam89 . We also notice that, even though we use in this study the M-model and the AS model for their simplicity, other social models can be implemented as well to explore the interplay between opinion and decision making processes.
The rest of the paper is organized as follows. In Section II we introduce the model, describing the topology of interactions as well as the dynamics that runs over each network. Results from numerical simulations of the model are presented in Section III, where we show that there are three possible final states: a coexistence of both orientations (neither dynamics dominates), a positive consensus (opinion dynamics domination) and a negative consensus (decision dynamics domination). Then, in Section IV we develop a mean field approach that allows to explain the qualitative behavior of the system, and shows that both dynamics behave equivalently for some particular choice of the parameters. Finally, in Section V we summarize and discuss our findings.
II The Model
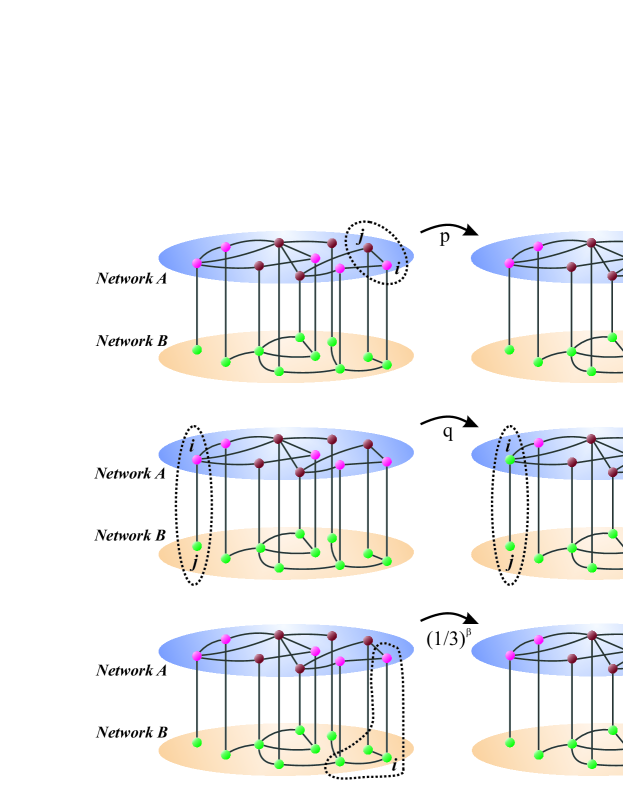
In our model we consider two interconnected networks, denoted by networks and , each with the same number of nodes and intranetwork degree distribution , which represents the fraction of nodes connected to other nodes within the same network. We also consider pairwise interconnections, that is, each node is connected to one randomly chosen node in the other network, through an internetwork link. Therefore, a node with intranetwork links and one internetwork link is connected to a total of neighbors: from the same network and from the other network. In order to keep the internetwork topology as simple as possible, we allow each node to have only one internetwork link. However, the qualitative behavior of the system is expected to be the same if other more complex internetwork patterns are used. In this particular topology, nodes and links represent agents and their social interactions, respectively, and thus the terms "nodes" and "agents" are used alternatively along the article.
The dynamics on network corresponds to that of the M-model Larocca14 with , where only one random agent updates its state at each time step, unlike the original version of the model where two randomly chosen agents can change their states. The opinion state of each agent is represented by an integer number with four possible values or , where the sign of indicates its opinion orientation and its absolute value measures the intensity of its opinion. Thus, and represent positive and negative extremists, that is, people totally in favor or against the issue, respectively, whereas and describe moderate opinions from each side. In a single step of the dynamics, an agent and one of its neighbors are chosen at random. A moderate agent is persuaded by a same-orientation neighbor to become an extremist with persuasion probability ( transition), while an extremist agent becomes moderate () and a moderate agent changes orientation () with compromise probability when they interact with an opposite-orientation neighbor [see Figs 1A and 1B]. As we choose and the M-model dynamics depends on the relative ratio between the probabilities to become an extremist or a moderate Larocca14 , we can express both probabilities and as function of . The parameter measures the strength of reinforcement in the opinion orientation, i e., the tendency of same-orientation neighbors to adopt a more extreme viewpoint as they persuade each other. Thus, for large values of most agents tend to keep their opinions close to the extreme values or , while for small opinions tend to remain close to the moderate values or . This model was studied on single fully connected networks in Larocca14 , where it was shown that the system reaches a quasistationary state whose features depend on . A polarized state is obtained for (persuasion larger than compromise), where agents’ opinions are driven to the extreme values and , and thus the distribution of opinions becomes "U-shaped", with peaks at and . A centralized state is observed for (compromise larger than persuasion), in which most agents hold opinions close to the moderate values and . The final state in the long time limit corresponds to an opinion consensus in either state or (all agents in the same state or ), depending on whether there is an initial majority of positive or negative agents, respectively. When the system reaches this completely ordered state opinions cannot longer evolve, and thus we say that consensus is an absorbing state of the dynamics.
The decision making dynamics of network is similar to that of the AS model AS_03 ; Vazquez_10 , where each agent can choose to be either in favor (choice state ) or against (choice state ) the given issue. This non-linear version of the voter model Vazquez_08 implements the peer pressure as a social mechanism to change an attitude or behavior: an agent can change its mind and reverse its decision with a probability equal to a power (the volatility) of the fraction of its opposite-choice neighbors [see Fig 1C]. The volatility exponent measures how prone a node is to changing state, from very likely for to very unlikely for . The dynamics of the AS model was extensively studied in single topologies, including fully connected networks as well as complex networks and lattices (see Vazquez_10 and references therein). This model exhibits a transition from a coexistence of both states (even mix of and agents) to a consensus in either state or , as overcomes a threshold value that is slightly sensitive to the topology of interactions and the symmetry between both states. The coexistence regime of non-consensus is quasistationary in finite systems, because finite-size fluctuations eventually drive the system to one of the two absorbing consensus states.
A distinctive feature of both the M-model and the AS model on single topologies is that their consensus states are attractive. Therefore, starting from a configuration where all agents have the same state in the M-model (or in the AS model), we can introduce a small perturbation by changing the states of a few agents at random, and check that the dynamics quickly brings the system back to the initial consensus state. The stability of the consensus state in the M-model increases with , as agents have a larger probability to adopt and keep their initial extreme opinions. For its part, the stability of consensus in the AS model increases with , as agents are less likely to change their choices. Then, an interesting situation happens when these two models are coupled and start from opposite oriented consensus states, given that each dynamics tries to bring the entire two-network system to its own initial state. The interplay between the two dynamics would eventually drive the system to one of the two initial consensus states, and thus we can interpret this outcome as the prevalence of one dynamics over the other. We expect that the final result depends on the relative values of parameters and , which are proportional to the "strength" of the M-model and the AS model, respectively.
Since we are interested in studying which dynamics dominates in the long run we initially set all nodes in network to state , while in network we randomly assigned state to nodes and state to the other nodes (all nodes positively oriented but with different intensities). Then, at each time step of length , a node is chosen at random from the two networks and its state is updated according to whether belongs to network or :
(a) Node in network : one of its neighbors, node with state , is randomly chosen. If and share the same orientation (), then with probability node adopts an extremist state if it is a moderate (), and, independently of the interaction, remains extremist if it is already an extremist () [see Fig 1A]. If and have opposite orientations (), with probability node becomes moderate if it is an extremist (), or changes orientation if it is a moderate () [see Fig 1B].
(b) Node in network : the state of changes with probability
| (1) |
where is the number of neighbors of with opposite orientation than , and is the volatility.
In the next Section we explore the behavior of the model using
and as external control parameters.
III Simulation Results
We studied the model described in Section II by means of Monte Carlo simulations using two interconnected degree-regular random networks (DR) of degree and nodes each. We implemented the Molloy-Reed algorithm Mol_01 to build the networks, where each node is connected to random nodes in the same network, and to one random node in the other network. Starting from a polarized situation that consists of setting all nodes in network to positive states and all nodes in network to negative states, we let the system evolve following the M-model and the AS dynamics described in Section II for networks and , respectively. We investigated how the steady state of the system depends on the opinion reinforcement and volatility that control, respectively, the strength of agents’ persuasion in network and the likelihood that an agent in network changes its decision. Because we were particularly interested in studying whether the dynamics in network prevails over the dynamics in network (or vice versa), we run many independent realizations of the dynamics and calculated the probability that the entire two-network system reaches a consensus, that is, the initial orientation adopted by network . We consider that the system reaches consensus when all nodes of both networks have the same orientation (either positive or negative ). Notice that, for instance, states and are both considered as positively oriented. The probability was estimated as the fraction of realizations that ended in a consensus. Given that each separate model always reaches consensus in a finite network –as explained in Section II–, one can check that the probability of a consensus in the entire system is .
In Fig 2A we plot as a function of for three
different volatilities . We observe that increases
abruptly from to when overcomes a crossover value
, determined as the symmetric point where . This
means that for large reinforcement network imposes its
initial orientation to network , and thus the dynamics of the
M-model prevails over the AS dynamics. The opposite happens for low
reinforcement , where the initial orientation of network B
prevails, and thus the dynamics of the AS model is stronger than that
of the M-model. An interpretation of these results can be given in
terms of the response of the M-model to a variation in . As
described in Section II, the initial positive consensus in
the M-model on network becomes more stable as increases. Then,
it turns out that for very small values of the initial A-consensus
is very unstable, and all nodes in network quickly adopt the
negative states hold by nodes in network B, driving the entire system
to a consensus in most realizations (). In the
opposite limit of very large values of , the initial A-consensus is
very stable, thus most A-nodes keep their initial positive states
while B-nodes change their states to positive, and the entire system
reaches a consensus in most realizations ().
Finally, for intermediate values of some realizations end in a
consensus while the rest end in a consensus, leading to the
sigmoidal shape of vs in Fig 2A.
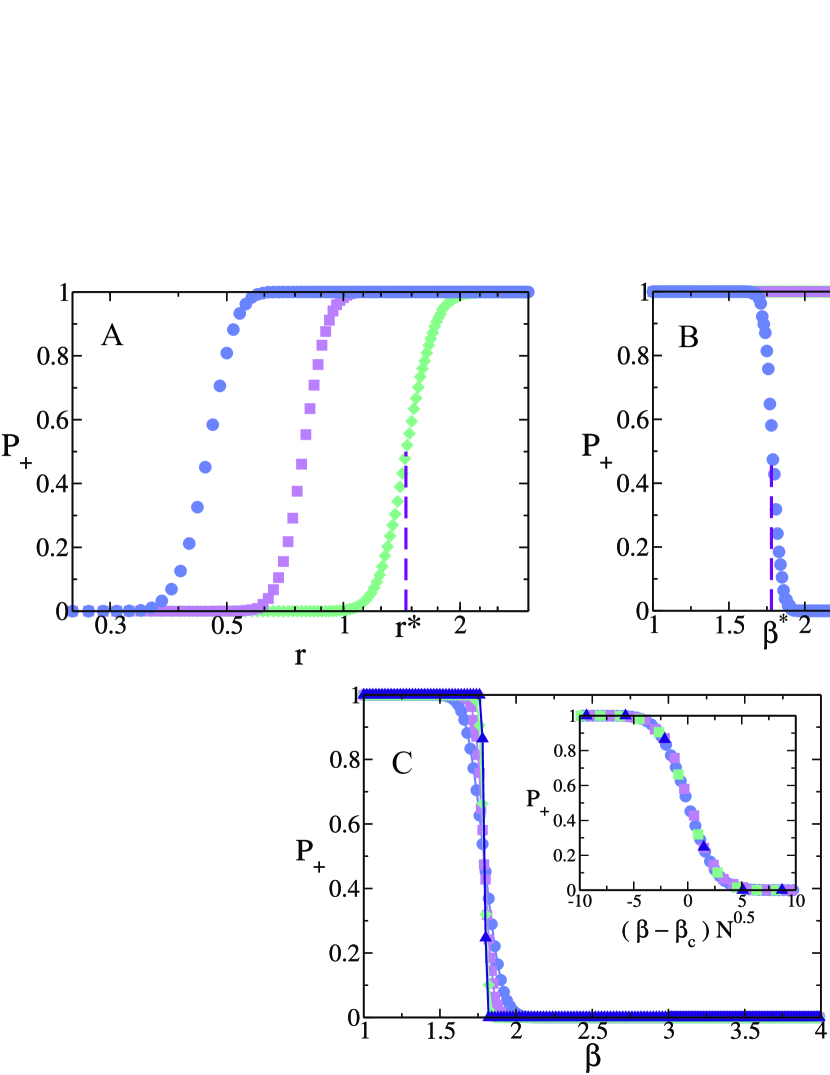
In Fig 2B we plot vs for three values of . We can see a crossover from to consensus at a value , where , in a similar fashion to the crossover with described above. For network imposes its initial orientation to network , while for the opposite happens. This behavior can be explained using arguments similar to those used above to explain the crossover of at . As increases from small values, the initial consensus state of network gains stability, continuously increasing the probability that the system reaches a consensus or, equivalently, decreasing . The reason why curves start at is because for low values of consensus states are never observed in the simulations, even though finite systems must reach consensus as we noted before. As we shall see when we analyze other observable like the magnetization, for the system falls in an active steady state with and orientations coexisting in both networks but, after a long time, consensus is eventually achieved by fluctuations. Consensus times in this regime are extremely long for the system sizes we used, and thus consensus is never achieved in a reasonable computer time. Indeed, we have run simulations on small enough networks and checked that an absorbing state is always reached. As we shall explain, this quasistationary non-consensus state is related to the coexistence dynamics observed in the AS model for .
Fig 2C shows vs for and different network sizes . We can see that the crossover becomes sharper as increases, with a slope at that diverges as , as the data collapse in the inset of Fig 2C shows. In the inset of Fig 2B we show the mean time to reach the consensus state as a function of , for the values of of the main Fig 2B. We observe that has a peak at , which is consistent with the fact that at the crossover point the system can reach either or consensus with the same probability , suggesting that large fluctuations lead the system to the final state. In Section IV we give an insight into this last behavior and show that the breaking in the symmetry of the system at eventually happens after a long time, when finite-size fluctuations make the system overcome a potential barrier. Below the M-model in network seems to control the dynamics of the system –as there is a consensus in both networks–, and thus is determined by the time it takes for network to reach a orientation from an initial orientation, which increases with . But above the opposite happens: network rules the dynamics, and thus is related to the time that network takes to go from a positive to a negative orientation. This observation is in agreement with the fact that approaches a constant value as becomes large, given that the M-model is independent of , and then so is .
In order to explore the behavior of the system for a wider range of
, we study the magnetization in networks and , and
, respectively, at the steady state. The magnetization in network
() at time is defined as
| (2) |
with , , , and where and are the fractions of nodes with and state, respectively, in network at time .
As we mentioned above, consensus in one of the two orientations is only observed in the simulations when is above a critical value , while for the system remains in an active steady state with both positive and negative orientations coexisting. This means that, in the region, magnetizations and in a single realization fluctuate around two different stationary values that are neither nor . This is shown in Fig 3, where we plot the average magnetization over many realizations at the steady state in each network, and , as a function of , for and . We can distinguish three different regimes. In the first regime (denoted by regime I), we see that () increases from () to () in the range from to . That is, there is a majority of nodes with positive orientation in network , while in network the coexistence is more even. We note that, strictly speaking, this coexistence regime is stable only in the thermodynamic limit, where the system remains forever in a stationary state of non-consensus. As stated before, in finite systems the steady state lasts for very long times, but fluctuations ultimately drive the system to an absorbing consensus state.
Above the system reaches a positive consensus (network- dominance) for (denoted by regime II), and a negative consensus (network- dominance) for (denoted by regime III). In regimes II and III close to , an average value of the magnetization different from and means that some fraction of the realizations ended in a positive consensus and the rest in a negative consensus.
The values of and are very different in
nature. While denotes a critical point from a disordered
phase (regime I) to an ordered phase (regimes II and III),
denotes a crossover point within the ordered phase, which separates
the two dominance regions. We also note that the order-disorder
transition at is related to the same type of transition
observed in the AS model, explained in Section II. It seems
that the coexistence phase in the isolated AS dynamics is very robust,
and the coupling to the M-model produces only a shift in the critical
value, from to .
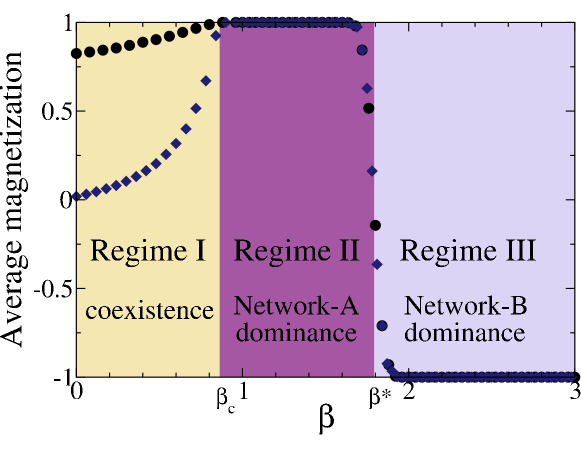
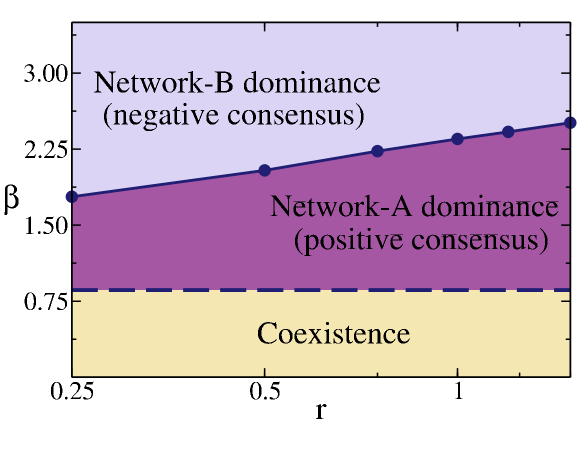
Fig 4 shows the phase diagram of the system in the
plane, on a log-linear scale. We observe that the crossover
point increases very slowly (logarithmically) with .
Therefore, starting from a point inside the B-dominance
region, an exponentially large increase in must be done to take
the system to the A-dominance region. In other words, for a small
change in the volatility of the decision making dynamics of network B,
the dynamics of network has to increase its opinion reinforcement by
a large amount, in order to impose its initial orientation.
In the next Section we develop a theoretical approach that allows to explain the qualitative behavior of the system in the three regimes. Even though this approach assumes that the system is infinitely large, is able to capture most of the phenomenology observed in the simulations, which are for finite networks.
IV Mean Field Approach
As we showed in Section III, the system exhibits three different regions in the phase space: a coexistence of and nodes for below a critical value , a consensus for where the M-model in network dominates, and a consensus for where the AS model in network dominates. In order to understand the role of and in the behavior of the system in these three regions, we study in this Section the evolution of the system within a mean-field approach. To be specific, we write and analyze approximate equations for the time evolution of the magnetization in each network.
As the system is symmetric at , where consensus is equally reached in both opinion orientations, we assume that the dynamics of both models are equivalent at and, therefore, we consider the M-model as an AS model with a volatility exponent . Roughly speaking, we can think of mapping the four-state M-model into a two-state AS model by combining and states into a single state and and into a single state, and considering effective transition probabilities between and states that are non-linear functions of the fractions and of and neighbors of a given node, respectively. For instance, the effective transition probability of a node from to can be written as , where is the fraction of ’s neighbors in the opposite state ( and states). Even though it is difficult to obtain the exact value of the exponent , one can show that should be larger than using the following heuristic argument. The effective transition probability from to states involves single jumps from nodes in state to state , whose probability is proportional to the fraction of neighbors , and also double jumps from nodes in state to and then to , with a probability proportional to . Combining these two types of transitions in the entire network results in an effective probability with an exponent .
The advantage of mapping the four-state M-model into a two-state model is that it allows to reduce the original two-network system –where the M-model interacts with the AS model– to a simpler system consisting on two interacting AS models, which can be studied analytically. Even though these two systems are not exactly the same because the mapping of the M-model into the AS model is only approximate, we shall see that both systems share the same phenomenology, with results that are in qualitative agreement with the simulation results of Section III, including a transition and a crossover between the different regimes.
Based on these assumptions, we study a system that consists of two
interconnected networks and B, where an AS dynamics with fixed
volatility runs on network (representing the
M-model), and another AS dynamics with variable volatility
runs on network . We start by deriving an approximate equation for
the time evolution of the magnetization
in network (),
where is the fraction of nodes with state
() in each network, which obeys the normalization condition
. At each time step , a
node in network with state is chosen with probability
, and switches to state with probability , changing by . Then, the average change
in the magnetization of network can be written as
| (3) |
Using Eq. (1) for the switching probability, can be
approximated as
| (4) |
where is the expected number
of neighbors of node with opposite state , and is the
total number of neighbors. Within a mean-field approach that neglects
nearest-neighbor correlations (node approximation), a neighbor of
in network () is in state with probability
() and, therefore, the expected number of
neighbors with state of can be estimated as
| (5) |
Using Eqs. (4) and (5) and expressing the densities
of states in terms of the magnetization ,
Eq. (3) can be written as
| (6) |
and a corresponding equation can be derived for ,
| (7) |
Equations (6) and (7) can be rewritten in the
form of a time-dependent Ginzburg-Landau equation Vazquez_10
| (8) | |||||
| (9) |
with potentials and given by
| (10) | |||||
| (11) | |||||
This formalism is very useful for visualizing the system’s evolution, as each magnetization evolves towards the minimum of its associated potential. However, unlike it happens in the AS model on a single isolated network Vazquez_10 where the potential depends on a unique magnetization and is static, the present case has two coupled potentials that vary in time. Indeed, Eq. (10) for the potential that rules the evolution of can be interpreted as an explicit function of , whose shape is controlled by a time-dependent external parameter . Therefore, the shape of varies with time through . An analogous interpretation can be done for , which depends on . Thus, within this approximate mathematical formalism represented by the coupled system of Eqs. (8) and (9), the interplay between both networks enters through the potentials and , which interact and co-evolve in time.
We now explore the behavior of the two networks by studying the evolution of the magnetization described by Eqs. (6) and (7), and using the potential formalism. For network we set the volatility value corresponding to the crossover point for calculated in Section III, and vary the volatility in network . The phenomenology described below is qualitatively the same for the values of that correspond to the other values of used in Fig 4.
To visualize the trajectories of the magnetization, we plot in Figs 5 and 6 the values of and (circles) and their associated potentials (solid lines) at different times, for various parameter values. Each circle corresponds to the magnetization at a given time , which lies over the potential at the same time , with . The intensity of a circle’s color decreases as time increases, starting from (dark circle) and ending at the lightest color. Drawing the complete shape of the potential helps to understand the trajectory followed by , which moves in the direction of the minimum of . The values of and were obtained by integrating numerically Eqs. (6) and (7), while the potential at a given time was drawn by replacing the value of into Eq. (10), and similarly for .
Fig 5 (left) shows the behavior in the coexistence regime I,
for . As we can see, the
magnetization in network evolves from at to the
minimum at for long times (approximately of
positive agents), while in network starts at and
reaches the stationary value close a positive
consensus. This result is in agreement with the one found from
simulations for small (see Fig 3 for
small ), where the system remains in a disordered phase with a
coexistence of both orientations. The behavior in the positive
consensus regime II is quite different [Fig 5 (right)].
There we use that lies between and
. We observe that, as it happens in simulations, both
networks reach a positive consensus after a few time steps. While
quickly gets trapped in a local minimum that ultimately reaches
the value , follows a direct trajectory from
towards a unique minimum at . The critical value of
that separates regime I (coexistence) from regime II (consensus) was
found to be close to (not shown), which is quite different from
the critical threshold obtained from Monte Carlo
simulations. This discrepancy may be due to the fact that the
theoretical approach considers an AS model in network (instead of
the M-model) and also that Eqs. (6) and (7) describe
the evolution of and in infinite large systems, as they do
not have any terms that take into account finite-size fluctuations.
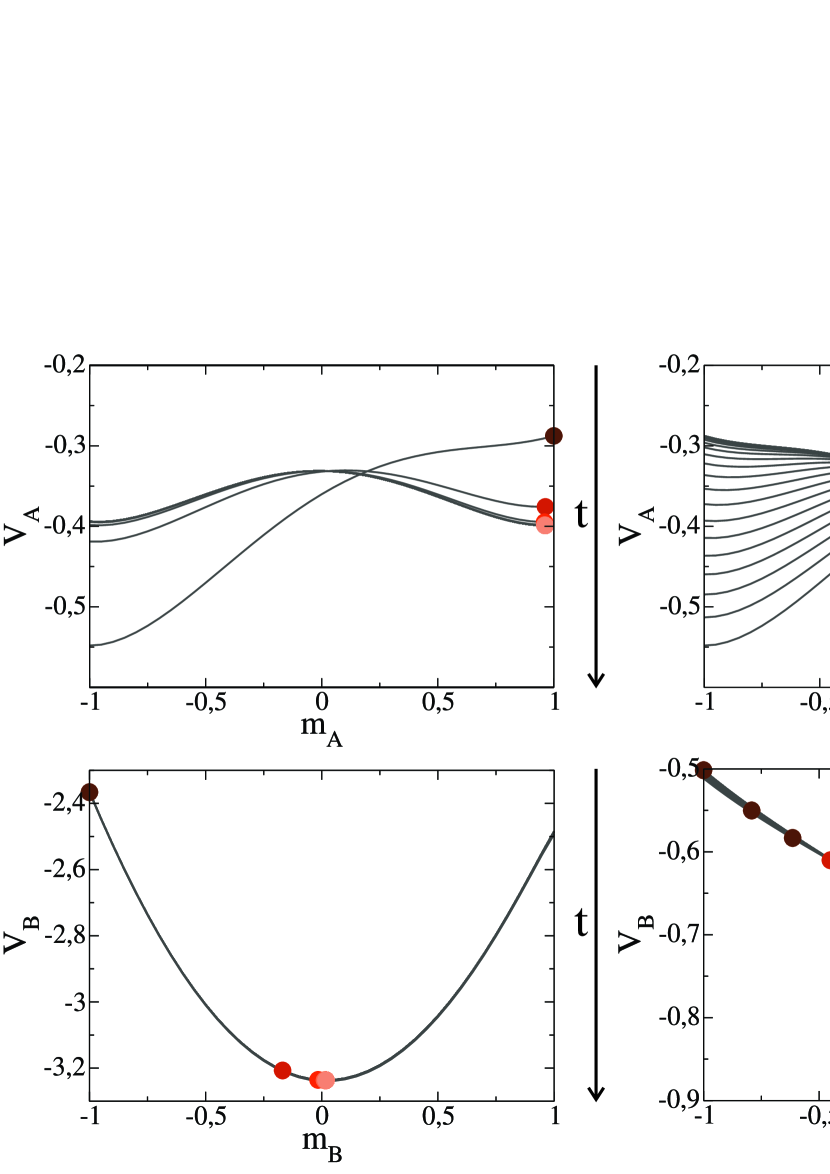
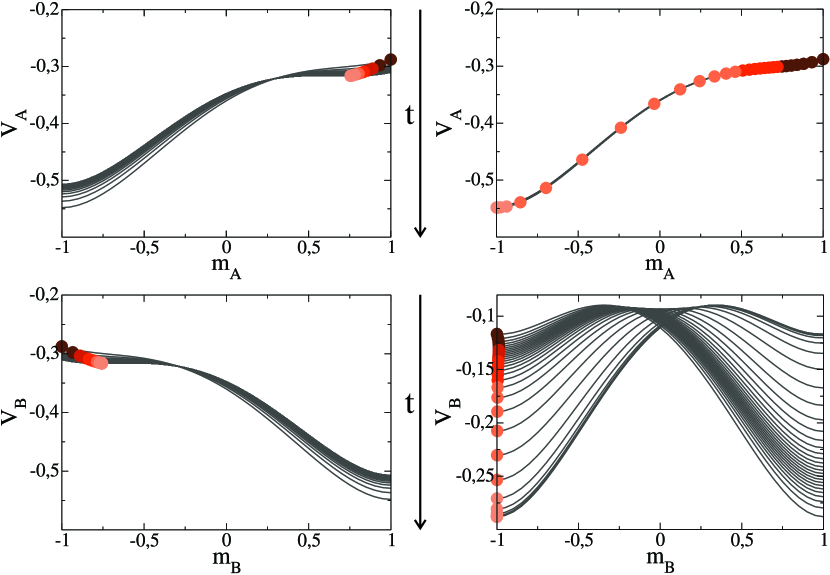
Fig 6 (left) corresponds to the crossover point
. We see that the magnetizations reach the
stationary values and ,
corresponding to a totally symmetric case in which there is an
unbalanced coexistence of orientations in each network. Even though the
total magnetization at the crossover point agrees with the average
magnetization obtained from simulations (see Fig 3), there
is a discrepancy with simulations results, where consensus in one of
the two orientations is always obtained for each individual
realization due to finite-size fluctuations. This is because
Eqs. (6) and (7) describe an infinite large system
where fluctuations are neglected and, therefore, the system can never
escape from the minimum. Due to the symmetry in both potentials, one
would expect a chance to escape towards either
consensus state if fluctuations were present, which is consistent with
the equal consensus probability in each state shown in
section III. Finally,
Fig 6 (right) corresponds to regime III, with
. The behavior in this case is analogous to the one
of Fig 5 (right), but with an ultimate negative consensus in
both networks (), in agreement with simulation results of
Section III.
In summary, the theoretical approach of this Section allows to understand the underlying behavior of the system in the different regimes, and gives an insight into why a dynamics prevails over the other.
V Discussion
In this work, we explored the interplay between two different dynamical processes that take place on two interconnected networks and . The dynamics on network corresponds to the one of the M-model for opinion formation with four states (), which implements the mechanisms of compromise and persuasion related by a reinforcement parameter . In network the dynamics is akin to that of the Abrams-Strogatz model for decision making, with two states and a volatility parameter . Both models have positive and negative opinion orientations. We initially set the system in a symmetric condition, where all nodes in network have positive states and all nodes in network have negative states, and studied the conditions under which one of the two dynamics dominates. We found that for a reinforcement larger than a crossover value the dynamics on network dominates, as a positive consensus is reached in both networks, while the opposite outcome is obtained for (network dominates). As we have shown, this is due to the fact that increasing the level of opinion reinforcement in network beyond a value produces a large number of positive extremists that are able to resist the change of orientation, imposing their positive orientation to the entire system. Besides, the study of the full phase space revealed a transition at a critical threshold , from a disordered phase where both orientations coexist to an ordered phase characterized by a consensus of one of the two orientations. We also showed that both dynamics are equivalent along the crossover line that separates the A-dominance and B-dominance regions, as the consensus probability in either state is the same on the line. Taking advantage of this symmetry, we developed a mean-field approach for the evolution of the magnetization in each network, using a time-dependent Ginzburg-Landau equation. This approach was able to reproduce qualitatively the different regimes observed in the simulations, and gave an insight into when and how the dominance of one dynamics takes place.
In practical terms, the equivalence between both dynamics means that a rather complex M-model with four opinion states and a reinforcement can be mapped to a simpler two-state model with effective transition probabilities given by the exponent . This mapping might be very useful to gain an analytical insight into the behavior of the M-model, given that the dynamics of the two-state equivalent model can be understood in terms of its associated Ginzburg-Landau potential. Despite the fact that this result is particular of the opinion and decision making models used in this work, we expect that analogous behaviors can be obtained using other types of dynamics, beyond socially inspired models. As a general remark, one can argue that it is possible to gain a better understanding of a complex and poorly known dynamics by coupling this dynamics to a much simpler a better known two-state model, using two similar interconnected networks as the underlying topology.
While our results are obtained using degree-homogeneous networks, it might be worthwhile to study the system using different network topologies, as real social networks are known to be quite heterogeneous. Even though we limited our internetwork topology to a single random interlink per node, the addition of targeted interlinks connecting specific nodes in both networks may bring new phenomenology. It could also be interesting to investigate how the number of different opinion states in the M-model affects the results, given that a more robust polarized state is expected as the maximum opinion value increases.
References
- (1) Newman MEJ. Networks: An Introduction. Oxford University Press; 2010.
- (2) Cohen R, Havlin S. Complex Networks: Structure, Robustness and Function. Cambridge University Press; 2010.
- (3) Barabási AL, Albert R. Statistical Mechanics of Complex Networks. Rev Mod Phys. 2002;74:47.
- (4) Pastor-Satorras R, Castellano C, Van Mieghem P, Vespignani A. Epidemic processes in complex networks. Rev Mod Phys. 2015 Aug;87:925–979.
- (5) Vazquez F, Eguíluz VM. Analytical solution of the voter model on uncorrelated networks. New Journal of Physics. 2008;10(6):063011.
- (6) Vazquez F, Castelló X, San Miguel M. Agent based models of language competition: macroscopic descriptions and order–disorder transitions. Journal of Statistical Mechanics: Theory and Experiment. 2010;2010(04):P04007.
- (7) Serrano MÁ, Klemm K, Vazquez F, Eguíluz VM, Miguel MS. Conservation laws for voter-like models on random directed networks. Journal of Statistical Mechanics: Theory and Experiment. 2009;2009(10):P10024.
- (8) La Rocca CE, Braunstein LA, Macri PA. Conservative model for synchronization problems in complex networks. Physical Review E. 2009;80:026111.
- (9) Pastore-Piontti AL, Macri PA, Braunstein LA. Discrete surface growth process as a synchronization mechanism for scale free complex networks. Physical Review E. 2007;76:046117.
- (10) Valdez LD, Buono C, Macri PA, Braunstein LA. Effect of degree correlations above the first shell on the percolation transition. Europhysics Letters. 2011;96:38001.
- (11) Bashan A, Bartsch RP, Kantelhardt JW, Havlin S, Ivanov PC. Network physiology reveals relations between network topology and physiological function. Nat Commun. 2012;3:702.
- (12) Gozolchiani A, Yamasaki K, Gazit O, Havlin S. Pattern of climate network blinking links follows El Niño events. Europhysics Letters. 2008;83(2):28005.
- (13) Li D, Fua B, Wang Y, Lu G, Berezind Y, Stanley HE, et al. Percolation transition in dynamical traffic network with evolving critical bottlenecks. Proc Natl Acad Sci. 2014;112:669.
- (14) De Domenico M, Sole-Ribalta A, Cozzo E, Kivela M, Moreno Y, Porter MA, et al. Mathematical Formulation of Multilayer Networks. Physical Review X. 2013;3:041022.
- (15) Boccaletti S, Bianconi G, Criado R, Del Genio CI, Gómez-Gardeñes J, Romance M, et al. The structure and dynamics of multilayer networks. Physics Reports. 2014;544(1):1.
- (16) Jianxi G, Li D, Havlin S. From a single network to a network of networks. National Science Review. 2014;1:346.
- (17) Kenett DY, Perc M, Boccaletti S. Networks of networks: An introduction. Chaos, Solitons & Fractals. 2015;80:1.
- (18) Gambuzza LV, Frasca M, Gómez-Gardeñes J. Intra-layer synchronization in multiplex networks. Europhysics Letters. 2015;110(2):20010.
- (19) Torres, M F , Di Muro, M A , La Rocca, C E , Braunstein, L A . Synchronization in interacting scale-free networks. Europhysics Letters. 2015;111(4):46001.
- (20) Gómez S, Díaz-Guilera A, Gómez-Gardeñes J, Pérez-Vicente CJ, Moreno Y, Arenas A. Diffusion Dynamics on Multiplex Networks. Physical Review Letters. 2013;110:028701.
- (21) Buldyrev SV, Parshani R, Paul G, Stanley HE, Havlin S. Catastrophic cascade of failures in interdependent networks. Nature. 2010;464:1025.
- (22) Gao J, Buldyrev SV, Stanley HE, Havlin S. Networks Formed from Interdependent Networks. Nature Physics. 2012;8:40.
- (23) Valdez LD, Buono C, Macri PA, Braunstein LA. Social distancing strategies against disease spreading. FRACTALS. 2013;21:1350019.
- (24) Hackett A, Cellai D, Gómez S, Arenas A, Gleeson JP. Bond Percolation on Multiplex Networks. Phys Rev X. 2016;6:021002.
- (25) Baxter GJ, Cellai D, Dorogovtsev SN, Goltsev AV, Mendes JFF. A Unified Approach to Percolation Processes on Multiplex Networks. In: Interconnected Networks. Springer International Publishing; 2016. p. 101.
- (26) Di Muro MA, La Rocca CE, Stanley HE, Havlin S, Braunstein LA. Recovery of Interdependent Networks. Scientific Reports. 2016;6:22834.
- (27) Buono C, Alvarez-Zuzek LG, Braunstein LA, Macri PA. Epidemics in partially overlapped multiplex networks. PLOS ONE. 2014;9:e92200.
- (28) Buono C, Braunstein LA. Immunization strategy for epidemic spreading on multilayer networks. EPL (Europhysics Letters). 2015;109(2):26001.
- (29) Alvarez-Zuzek LG, Buono C, Braunstein LA. Epidemic spreading and immunization strategy in multiplex networks. In: Journal of Physics: Conference Series. vol. 640. IOP Publishing; 2015. p. 012007.
- (30) Cozzo E, Baños RA, Meloni S, Moreno Y. Contact-based Social Contagion in Multiplex Networks. Physical Review E. 2013;88:050801(R).
- (31) Granell C, Gómez S, Arenas A. Dynamical Interplay between Awareness and Epidemic Spreading in Multiplex Networks. Physical Review Letters. 2013;111:128701.
- (32) Alvarez-Zuzek LG, Stanley HE, Braunstein LA. Epidemic Model with Isolation in Multilayer Networks. Scientific Reports. 2015;5:12151.
- (33) Saumell-Mendiola A, Serrano MA, Boguñá M. Epidemic spreading on interconnected networks. Physical Review E. 2012;86:026106.
- (34) Vazquez F, Serrano MA, Miguel MS. Rescue of endemic states in interconnected networks with adaptive coupling. Scientific Reports. 2016;6:29342.
- (35) Darabi Sahneh F, Scoglio C. Competitive epidemic spreading over arbitrary multilayer networks. Physical Review E. 2014;89:062817.
- (36) Castellano C, Fortunato S, Loreto V. Statistical physics of social dynamics. Rev Mod Phys. 2009;81(2):591.
- (37) Galam S, Chopard B, Masselot A, Droz M. Competing species dynamics: Qualitative advantage versus geography. The European Physical Journal B-Condensed Matter and Complex Systems. 1998;4:529.
- (38) Halu A, Zhao K, Baronchelli A, Bianconi G. Connect and win: The role of social networks in political elections. Europhysics Letters. 2013;102:16002.
- (39) Diakonova M, San Miguel M, Eguíluz V. Absorbing and shattered fragmentation transitions in multilayer coevolution. Physical Review E. 2014;89:062818.
- (40) Diakonova M, Nicosia V, Latora V, San Miguel M. Irreducibility of multilayer network dynamics. New Journal of Physics. 2016;18:023010.
- (41) Galam S. Rational group decision making: A random field Ising model at T= 0. Physica A: Statistical Mechanics and its Applications. 1997;238:66.
- (42) La Rocca CE, Braunstein LA, Vazquez F. The influence of persuasion in opinion formation and polarization. Europhysics Letters. 2014;106:40004.
- (43) Mäs M, Flache A. Differentiation without Distancing. Explaining Bi-Polarization of Opinions without Negative Influence. PLOS ONE. 2013 11;8(11):1–17.
- (44) Mäs M, Flache A, Takács K, Jehn KA. In the short term we divide, in the long term we unite: Demographic crisscrossing and the effects of faultlines on subgroup polarization. Organization science. 2013;24(3):716–736.
- (45) Balenzuela P, Pinasco JP, Semeshenko V. The Undecided Have the Key: Interaction-Driven Opinion Dynamics in a Three State Model. PLOS ONE. 2015;10(10):e0139572.
- (46) Abrams DM, Strogatz SH. Linguistics: Modelling the dynamics of language death. Nature. 2003;424(6951):900.
- (47) Galam S. Plastic crystals, melting, and random fields. Physics Letters A. 1987;122(5):271.
- (48) Galam S, Gabay M. Coupled spin systems and plastic crystals. Europhysics Letters. 1989;8(2):167.
- (49) Molloy M, Reed B. A Critical Point for Random Graphs with a Given Degree Sequence. Random Structures and Algorithms. 1995;6:161.