Discovery of a deep Seyfert-2 galaxy at behind NGC 300
Abstract
We report on the unveiling of the nature of the unidentified X-ray source 3XMM J005450.3–373849 as a Seyfert 2 galaxy located behind the spiral galaxy NGC 300 using Hubble Space Telescope data, new spectroscopic Gemini observations and available XMM-Newton and Chandra data. We show that the X-ray source is positionally coincident with an extended optical source, composed by a marginally resolved nucleus/bulge, surrounded by an elliptical disc-like feature and two symmetrical outer rings. The optical spectrum is typical of a Seyfert 2 galaxy redshifted to , which confirms that the source is not physically related to NGC 300. At this redshift the source would be located at 9094 Mpc (comoving distance in the standard model). The X-ray spectra of the source are well-fitted by an absorbed power-law model. By tying between the six available spectra, we found a variable index running from 2 in 2000-2001 years, to 1.4–1.6 in the 2005-2014 period. Alternatively, by tying , we found variable absorption columns of cm-2 in 2000-2001 years, and cm-2 in the 2005-2014 period. Although we cannot distinguish between an spectral or absorption origin, from the derived unabsorbed X-ray fluxes, we are able to assure the presence of long-term X-ray variability. Furthermore, the unabsorbed X-ray luminosities of 1043 erg s-1 derived in the X-ray band are in agreement with a weakly obscured Seyfert-2 AGN at .
keywords:
X-rays: individual: 3XMM J005450.3–373849 — X-rays: individual: XMMU J005450.0–373853 – X-rays: galaxies — galaxies: Seyfert1 Introduction
Unidentified extragalactic variable X-ray sources with extended emission at radio and optical wavelengths are often associated to Active Galactic Nuclei (AGNs Mushotzky et al., 1993) or Ultraluminous X-ray sources (ULXs, e.g. Fabbiano, 2006). Multiwavelength analyses, from radio to gamma-ray are needed to disentangle and characterise the different components and nature of such astrophysical systems.
Of particular interest is the X-ray source 3XMM J005450.3373849, located within the spiral galaxy NGC 300, belonging to the nearby Sculptor Group of galaxies. It was first studied by Read & Pietsch (2001), who suggested an X-ray binary nature for the source, based on hardness-ratio values and its variable behaviour obtained from observations performed with the High Resolution Imager of ROSAT. Later on, Payne et al. (2004) showed that the source (named XMM5 in their work) presents a radio counterpart (ATCA J005450.3373850), whose extended radio emission may be the result of synchrotron radiation from jets, possibly associated to an extragalactic microquasar. A study of the global properties of X-ray point sources in NGC 300, and their optical counterparts was performed by Carpano et al. (2005), who associated the source (named Source 7 in their work) with an apparently extended optical counterpart.
In this paper, we report results of a combined optical and X-ray analysis using archival data of the HST, XMM-Newton and Chandra observatories, together with new optical spectroscopic Gemini observations, of the extragalactic X-ray source 3XMM J005450.3373849, and we provide convincing evidence about its true nature as a Seyfert-2 AGN galaxy located at . The structure of the paper is as follows: in Sect. 2 we describe Hubble, Gemini, XMM-Newton and Chandra observations and data reduction. Optical/X-ray analysis and results are shown in Sect. 3. Finally, in Sect. 4, we discuss the implications of our results and summarise our main conclusions.
| Obs. | Satellite | Observation ID | Date | Starting time | Exposure [ks] | GTI [ks] | Observation Mode |
|---|---|---|---|---|---|---|---|
| MOS1/MOS2/pn | |||||||
| 1 | XMM | 0112800201 | 2000-12-26 | 18:14:32 | 33.7/33.7/28.3 | 32.3/31.9/24.5 | PFWE |
| 2 | XMM | 0112800101 | 2001-01-01 | 13:06:32 | 43.4/43.4/34.6 | 42.9/43.1/34.4 | PFWE |
| 3 | XMM | 0305860301 | 2005-11-25 | 07:20:47 | 36.0/36.0/30.8 | 35.6/35.9/30.5 | PFWE |
| 4 | XMM | 0656780401 | 2010-05-28 | 13:23:23 | 17.8/17.8/11.8 | 13.9/14.6/10.9 | PFWE |
| 5 | Chandra | 12238 | 2010-09-24 | 02:57:22 | 65.80 | 62.9 | VFAINT |
| 6 | Chandra | 16028 | 2014-05-16 | 19:33:04 | 65.08 | 64.2 | VFAINT |
All observations were taken from their respective mission archives. PFWE refers to the Prime Full Window Extended observation mode, and VFAINT to very faint mode.
2 Observations and data reduction
2.1 X-ray data
We analysed four XMM-Newton and two Chandra observations of 3XMM J005450.3373849 obtained along a period of fourteen years between 2000/12/26 and 2014/05/16. The XMM-Newton observations were performed with the European Photon Imaging Camera (EPIC), which consists of three detectors, two MOS cameras (Turner et al., 2001), and one PN camera (Strüder et al., 2001) operating in the 0.215 keV range. XMM-Newton data were analysed with the XMM-Newton Science Analysis System (SAS) version 14.0.0. Starting from level-1 event files, the latest calibrations were applied with the emproc and epproc tasks. For the MOS data, we selected only events with patterns 0 through 12 and applied flag filters XMMEA-EM. For the PN data, we selected only events with patterns 0 through 4 and applied flag filters XMMEA-EP. According to the light curves of MOS and PN cameras, we further excluded time-intervals with high background rates by setting good time interval (GTI) thresholds on 0.35 cts s-1 in the 0.312 keV range for MOS and 0.4 cts s-1 in the 0.315 keV range for PN, respectively.
Chandra observations performed with the Advanced CCD Image Spectrometer (ACIS) camera were extracted from the archive. ACIS operates in the 0.110 keV range with high spatial resolution (). These observations were calibrated using the CIAO (version 4.7) and CALDB (version 4.6.7) packages by means of the chandra_repro task. Detailed information of the X-ray observations and instrumental characteristics are given in Table 1.
2.2 Optical data
In order to analyze the properties of the optical counterpart of 3XMM J005450.3373849, found by Carpano et al. (2005), we used optical images obtained with the Advanced Camera for Surveys (ACS) mounted in the HST. The observations correspond to the HST Cycle 11, and were obtained as part of the GO-9492 program (PI: F. Bresolin) from 2002 July to 2002 December. Three exposures of 360 s are available, performed in the F435W, F555W and F814W filters (Bresolin et al., 2005), which are similar to the classical Johnson bands. The ACS Wide Field Camera (WFC) has a mosaic of two CCDs detectors of pixels and a scale of 0.049′′/pixel, covering a field of . These images and their corresponding photometric data (Dalcanton et al., 2009), were obtained from the STScI (MAST; https://archive.stsci.edu/) database. The photometry was carried out using the package DOLPHOT adapted for the ACS camera (Dolphin, 2000).
Model I
| Obs. | [ cm-2] | Flux (0.5–8.0 keV) | |
|---|---|---|---|
| 1 | |||
| 2 | |||
| 3 | |||
| 4 | |||
| 5 | |||
| 6 | |||
| 216.18 (226 d.o.f) |
Model II
| Obs. | [ cm-2] | Flux (0.5–8.0 keV) | |
|---|---|---|---|
| 1 | |||
| 2 | |||
| 3 | |||
| 4 | |||
| 5 | |||
| 6 | |||
| 229.67 (226 d.o.f) |
Error values are 1- (68%) for every single parameter and unabsorbed fluxes in the 0.5-8.0 keV energy range are given in units of 10-12 erg cm-2 s-1. Parameters indicated with a were tied between each other during the fit. Model I corresponds to values of tied and Model II to values of tied, respectively.
2.3 Gemini spectroscopy
Spectra for 3XMM J005450.3373849 were taken with the Gemini MultiObject Spectrograph (GMOS) at the Gemini South telescope under the program GS-2015B-DD-6 (PI: J. Combi).
We have adopted a single long-slit of width to obtain the spectra of the target. We used the R400-G5325 grism and obtained five exposures of 1200 s in two different central wavelengths (three in 6700 Å and two in 6500Å). This setup resulted in a spectral coverage of 4200–9050 Å and a resolution (defined as FWHM measured in some emission lines of the CuAr arc lamps spectra) .
The flat-field frames were observed at the same position of the target. The CuAr arc lamps were observed as day-time calibrations, thus flexures can introduce some systematic uncertainties in the wavelength calibration which are not important to the aims of this work. The observations were reduced using the gemini package within iraf111http://iraf.noao.edu/.
3 Results
3.1 X-ray spectral and temporal analysis
We checked the position of 3XMM J005450.3373849 in Chandra observations running the wavdetect task which throwed and (J2000.0) with a positional uncertainty of . This value agrees very well with the values reported by Rosen et al. (2015) on their 3XMM-DR5 catalogue: and (J2000.0) with a position error. We also used the srcextent CIAO task to calculate the size of the source, which resulted point-like at Chandra resolution.
In order to analyze the physical properties of the X-ray emission detected from 3XMM J005450.3373849 in detail, we extracted spectra from circular regions centered at the position of the source for both XMM-Newton and Chandra observations. For XMM-Newton data, spectra were obtained in the 0.512 keV energy range, for radii of using evselect SAS task with the appropriate parameters for EPIC MOS 1/2 and PN cameras, and ancillary and response matrices were created using arfgen and rmfgen tasks, respectively. For the spectral extraction in MOS1/2 and PN cameras we selected events with FLAG == 0. In the case of Chandra data, we extracted spectra using radii of by means of the specextract CIAO task. For both telescopes, background spectra were extracted from annuli regions centered at the position of the source and the spectra were grouped with a minimum of 16 counts per bin. Spectral analysis was performed using the XSPEC package version 12.8 (Arnaud, 1996) in the 0.5–8.0 keV energy range, where the source is detected.
We simultaneously fitted the spectra obtained with the XMM-Newton and Chandra detectors, using a power-law (PL) model modified by interstellar absorption (phabs; Balucinska-Church & McCammon, 1992). In order to fit the data we used to alternatives. In Model I, we tied the hydrogen column density, , of all observations allowing to vary freely the spectral indices, , and their normalizations, while, in Model II, we tied , allowing to vary the . For Model I, the best fit model returned an hydrogen column density cm-2 and power-law indices varying from 2, for Obs. 1 and 2, to 1.48–1.65 for Obs. 3 to 6, with a total of 216.18 for 226 d.o.f. Unabsorbed X-ray fluxes in the 0.5–8.0 keV energy range run from 0.145 to 0.057 erg cm-2 s-1. For Model II, the best fit corresponds to a spectral index , and absorption columns varying from cm-2, for Obs. 1 and 2, to cm-2, for Obs. 3 to 6, with a total of 229.67 for 226 d.o.f. Unabsorbed X-ray fluxes in the 0.5–8.0 keV range show a similar behaviour to Model I, being independent to the chosen model. The available data do not allow us to adequately fit the whole set of spectra leaving all the parameters untied, as there are no enough statistics. However, in both cases we observe the presence of a long-term X-ray variability. The full results of the fits are summarized in Table 2.
Model I Model II


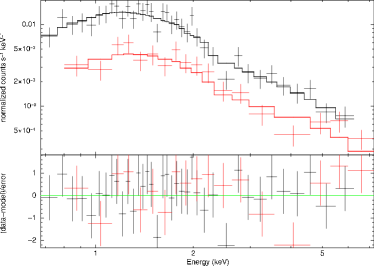
On the left panel of Figure 1 we plot the spectral results corresponding to Model I. On its upper panel, we present the evolution of the spectral index of 3XMM J005450.3373849 from 2000 Dec 26 to 2014 May 16. The power-law spectral index was during the period 2000/2001, decreasing to in 2005/2014. On its lower panel we show the corresponding full 2000-2014 unabsorbed X-ray light curve in the 0.5-8.0 keV energy range. On the right panel of Figure 1 we display the spectral results from Model II. On its upper panel, we show the evolution of the absorption column , while on its lower panel we plot the corresponding X-ray light curve in the same ranges. Although a few years of data are missing (2001-2005), in both cases the source displays at least two different states. Regardless of the model chosen, the unabsorbed flux evolution shows the same behaviour which confirms the long-term X-ray variability of the source. To make this clear, on Figure 2 we show background-subtracted PN spectra of XMM-Newton observations 1 and 4 of 3XMM J005450.3373849 as fitted by the absorbed power-law model.
3.2 Optical Images and Photometry
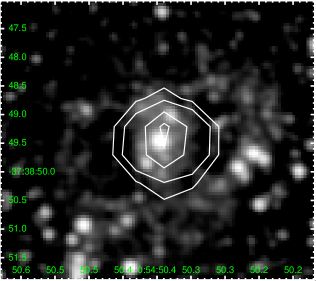
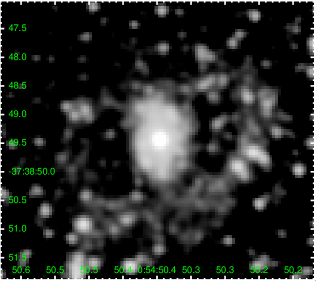
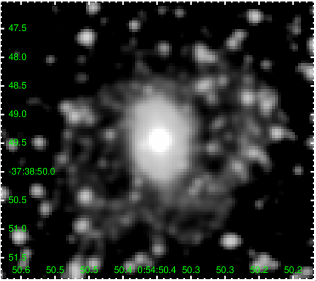
Figure 3 shows the HST images of the field surrounding 3XMM J005450.3373849 in the aforementioned three filters. The Chandra X-ray contours are overlaied in Fig. 3, left panel. As it can be seen, the X-ray source is positionally coincident with the geometrical centre of the extended optical source, whose morphology clearly matches an R-type ring galaxy, in which two outer pseudorings are conspicuous. These features are thought to arise from gaseous rings that developed at the outer Lindblad resonances in a spiral galaxy (e.g. Buta & Crocker, 1991). The optical source also displays a barely resolved nuclear component (which we associate with a bulge plus an unresolved nucleus), located at the centre of an “oval”, with hints of spiral structure, and two “hot-spots”, clearly seen in the -band image at position angles and (i.e., almost at diametrically opposite sides of the nucleus).
The inner disk (the “oval” feature) has an ellipticity and a position angle , spanning and along its major and minor axes, respectively. The pseudorings, in turn, present an angular size of on the plane of the sky.
3.3 Optical spectroscopy
In Fig. 4, we show the GMOS spectrum over the spectral range 5500–8500 Å. Emission lines of H, He i, [N ii], [O i–ii–iii], [S ii], [Ar iii], and [Fe vii] were identified in the spectrum and measured for radial velocities. We obtained a mean (13 measurements). We have also identified some absorption lines of Ca ii, Na i, and the G-band. Five absorptions gave a (5 values averaged), thus they are originated at the same distance as the emission lines.

The spectrum presents hydrogen and forbidden lines of the same width with a mean km s-1, compatible with a Seyfert 2 galaxy spectrum. Also, the ratio H and [O iii] 5007 is 0.1 (typical in Sy 2, following Weedman, 1977).
We also measured the of the emission lines in the spatial dimension. All of them resulted similar to the of the whole trace of the spectrum, thus the spectral source should be considered as point-like (at least, considering the seeing-limited Gemini’s spatial resolution).
4 Discussion
Through this paper, for the first time, we present a deep study of the X-ray source 3XMM J005450.3373849 an its optical counterpart to unveil its real nature. The information gathered in the previous sections from the optical and X-ray analysis shows that 3XMM J005450.3373849 poses typical characteristics of a Seyfert-2 AGN galaxy, located at behind NGC 300, as demonstrates the optical spectroscopic observations that we obtained with Gemini. The X-ray source is positionally coincident with the central region of an extended optical source detected with HST showing a complex structure, that clearly matches the morphology of a R-type spiral galaxy with a conspicuous outer pseudo-rings structure. The positional correlation strongly suggests a physical association between both sources. We also note that this galaxy is unrelated to either of the two clusters detected in the background of NGC 300 (Schirmer et al. 2003), with measured redshits (Cappi et al. 1998) and (Collins et al. 1995), respectively.
The object’s redshift implies a luminosity distance Mpc and a spatial scale 3.606 kpc/′′ (we made use of Ned Wright’s Cosmology Calculator222http://www.astro.ucla.edu/~wright/CosmoCalc.html; Wright, 2006, with standard Cosmological parameters: km s-1 Mpc-1, , and ). The (projected) major axis of the pseudo-rings system is thus kpc, while the surface brightness profile of the inner “oval” feature can be fit by an exponential with a scale-length of ( kpc) in the -band (rest-frame -band). The rings are resolved into several “knots” with apparent magnitudes ranging from to mag () and relatively red colours (). Thus, they are probably large star-forming complexes (the H emission falls within the F814W passband at the object’s redshift), significantly reddened by the intervening dust in the disc of NGC 300.
Though a small fraction of observed rings may be due to collisions or mergers of galaxies, or to accretion of intergalactic gas, the vast majority of rings are probably simple resonance phenomena, caused by the actions of a rotating bar or other non-axisymmetric disturbance on the motions of gas clouds in the disc (e.g. Schwarz, 1981). In particular, outer pseudo-rings are in fact spiral arms with a very low pitch angle, winding upon themselves following the outer Lindblad resonance (OLR). These features are quite common in Seyfert galaxies (Hunt & Malkan, 1999), and it has been suggested that galaxies with outer (pseudo)rings tend to display enhanced nuclear star formation (Buta & Crocker, 1991); however, the real dependence of AGN activity on the global structure of the host galaxy is still debated (Cisternas et al., 2015).
The information obtained from the optical data are in accordance with the results of our temporal and spectral X-ray analysis of 3XMM J005450.3373849, where we have shown that the source was in two different states, showing typical AGN variability. The X-ray spectra available were best-fitted using an absorbed power-law model, with absorption columns in the cm-2 range and spectral indices of 1.5–2 typical of AGNs. In the 2000–2001 period, the source showed the highest flux, reaching 0.12–0.14 erg cm-2 s-1. Contrarily, during the 2005–2010 period, the source was fainter with a flux of 0.06 erg cm-2 s-1 with a higher absorption, returning to a brighter state in the last 2010–2014 period. Taking into account the derived unabsorbed X-ray fluxes of the source, assuming a 1110 Mpc distance to the source, we compute X-ray luminosities in the 81042 to 21043 erg s-1 range for the 0.5–8.0 keV energy band, for any of the spectral models assumed, which correspond to a weak AGN with little obscuration (Ueda et al., 2014; Merloni et al., 2014). It is interesting to note that considering an for NGC 300 (Gieren et al., 2004) and assuming , we deduce an . Thus, following Foight et al. (2015) we obtain a total absorption column cm-2. Hence, the best fit values obtained for the absorption columns in both spectral models are at least a factor of 5 higher than the foreground material.
In any case, this particular galaxy has signatures of strong star formation activity, as well as of an AGN. The two hot spots, as said, are prominent in the F435W image (which corresponds to the -band at the source rest-frame). Such spots, roughly aligned on opposite sides of the nucleus, are associated to strong ongoing star-formation, as is the case of other well-studied starburst galaxies (e.g., M 94; Waller et al., 2001).
Acknowledgements
We thank the anonymous referee for her/his insightful comments and constructive suggestions that lead to an improved manuscript. JAC is a CONICET researcher. This work was supported by Consejería de Economía, Innovación, Ciencia y Empleo of Junta de Andalucía under excellence grant FQM-1343 and research group FQM-322, as well as FEDER funds. MJR was supported by grant PIP 112-201101-00301 (CONICET). RG was supported by grant PIP 112-201201-00298 (CONICET). FG and MJR are fellows of CONICET.
References
- Arnaud (1996) Arnaud K. A., 1996, ASP Conf. Ser. 101: Astronomical Data Analysis Software and Systems V, 101, 17
- Balucinska-Church & McCammon (1992) Balucinska-Church M., & McCammon D., 1992, ApJ, 400, 699
- Bresolin et al. (2005) Bresolin F., Pietrzyński G., Gieren W., & Kudritzki R.-P., 2005, ApJ, 634, 1020
- Buta & Crocker (1991) Buta R., & Crocker D. A., 1991, AJ, 102, 1715
- Cappi, Held, & Marano (1998) Cappi A., Held E. V., Marano B., 1998, A&AS, 129, 31
- Carpano et al. (2005) Carpano S., Wilms J., Schirmer M., & Kendziorra E., 2005, A&A, 443, 103
- Cisternas et al. (2015) Cisternas M., Sheth K., Salvato M., et al., 2015, ApJ, 802, 137
- Collins et al. (1995) Collins C. A., Guzzo L., Nichol R. C., Lumsden S. L., 1995, MNRAS, 274, 1071
- Dalcanton et al. (2009) Dalcanton J. J., Williams B. F., Seth A. C., et al., 2009, ApJS, 183, 67
- Dolphin (2000) Dolphin A. E., 2000, PASP, 112, 1383
- Fabbiano (2006) Fabbiano G., 2006, ARA&A, 44, 323
- Foight et al. (2015) Foight, D., Guver, T., Ozel, F., & Slane, P. 2015, arXiv:1504.07274
- Gieren et al. (2004) Gieren, W., Pietrzyński, G., Walker, A., et al. 2004, AJ, 128, 1167
- Hunt & Malkan (1999) Hunt L. K., & Malkan M. A., 1999, ApJ, 516, 660
- Merloni et al. (2014) Merloni, A., Bongiorno, A., Brusa, M., et al. 2014, MNRAS, 437, 3550
- Mushotzky et al. (1993) Mushotzky, R. F., Done, C., & Pounds, K. A. 1993, ARA&A, 31, 717
- Payne et al. (2004) Payne J. L., Filipović M. D., Pannuti T. G., et al., 2004, A&A, 425, 443
- Read & Pietsch (2001) Read A. M., & Pietsch W., 2001, A&A, 373, 473
- Rosen et al. (2015) Rosen S. R., Webb N. A., Watson M. G., et al., 2015, arXiv:1504.07051
- Schirmer et al. (2003) Schirmer M., Erben T., Schneider P., et al. , 2003, A&A, 407, 869
- Schwarz (1981) Schwarz M. P., 1981, ApJ, 247, 77
- Strüder et al. (2001) Strüder L., et al., 2001, A&A, 365, L18
- Turner et al. (2001) Turner M. J. L., et al., 2001, A&A, 365, L27
- Ueda et al. (2014) Ueda, Y., Akiyama, M., Hasinger, G., Miyaji, T., & Watson, M. G. 2014, ApJ, 786, 104
- Waller et al. (2001) Waller W. H., Fanelli M. N., Keel W. C., et al., 2001, AJ, 121, 1395
- Weedman (1977) Weedman D. W., 1977, ARA&A, 15, 69
- Wright (2006) Wright E. L. 2006, PASP, 118, 1711