Electronic Instability and Anharmonicity in SnSe
Abstract
The binary compound SnSe exhibits record high thermoelectric performance, largely because of its very low thermal conductivity. The origin of the strong phonon anharmonicity leading to the low thermal conductivity of SnSe is investigated through first-principles calculations of the electronic structure and phonons. It is shown that a Jahn-Teller instability of the electronic structure is responsible for the high-temperature lattice distortion between the Cmcm and Pnma phases. The coupling of phonon modes and the phase transition mechanism are elucidated, emphasizing the connection with hybrid improper ferroelectrics. This coupled instability of electronic orbitals and lattice dynamics is the origin of the strong anharmonicity causing the ultralow thermal conductivity in SnSe. Exploiting such bonding instabilities to generate strong anharmonicity may provide a new rational to design efficient thermoelectric materials.
pacs:
63.20.Ry,71.20.-bQuasiparticle couplings such as phonon-phonon and electron-phonon interactions play a central role in condensed matter physics. In energy materials, it is critical to understand the interaction between phonons and the electronic structure, and how the chemical bonding impacts atomic vibrations, in order to control both thermodynamics and transport properties. The origin of the strongly anharmonic bonding in binary metal chalcogenides is the subject of renewed interest, both fundamentally and in connection with ferroelectric and thermoelectric properties. SnSe in particular is currently attracting strong interest, owing to the recent discovery of its record-high thermoelectric efficiency. Zhao et al. (2014, 2016) This high thermoelectric conversion efficiency results in part from an ultra-low thermal conductivity. Zhao et al. (2014); Chen et al. (2014a); Carrete et al. (2014); Sassi et al. (2014)
Our recent inelastic neutron scattering (INS) measurements have shown that the ultralow thermal conductivity of SnSe arises from strongly anharmonic phonons near a lattice instability. Li et al. (2015) A continuous structural phase transition occurs at K, associated to the condensation of a soft phonon mode, which remains strongly anharmonic over a broad temperature range below the transition. The soft mode is the lowest-energy transverse optical (TO) phonon mode at the zone center in the low-symmetry phase (), but stems from a zone-boundary mode in the high-symmetry phase, leading to a doubling of the unit cell on cooling through . Li et al. (2015); Adouby et al. (1998) The low-symmetry phase is non-polar.
Thus, the behavior of SnSe is reminiscent of, while significantly different from, the ferroelectric instability in the binary rocksalt chalcogenides (PbTe, SnTe, GeTe). Upon cooling, SnTe and GeTe undergo a displacive distortion from the cubic phase to a ferroelectric rhombohedral structure, corresponding to the condensation of the degenerate transverse-optic branch at the zone center (). Jantsch (1983) In the incipient ferroelectric PbTe, the TO mode softening is only partial and the rocksalt phase remains stable. As previously investigated, the soft-mode suppresses the thermal conductivity of rocksalt chalcogenides by scattering the acoustic phonons through anharmonic phonon-phonon interactions, which is beneficial to improve the thermoelectric performance. Delaire et al. (2011); Zhang et al. (2011); Shiga et al. (2012); Li et al. (2014a, b); Chen et al. (2014b); Lee et al. (2014)
Resonant bonding and lone-pair electrons have both been associated with the lattice instability in the rocksalt compounds, as well as in related phase-change materials. Waghmare et al. (2003); Lee et al. (2014); Shportko et al. (2008) The compound SnSe is structurally quite distinct from the rocksalts, however, with a layered structure giving rise to strongly anisotropic electronic structure, lattice dynamics, and electrical and thermal transport properties. It can be viewed as intermediate between the rocksalt structure and the quasi-two-dimensional transition metal dichalcogenides, such as MoS2 and NbSe2.
SnSe crystallizes in a layered orthorhombic structure (Pnma) at ambient temperature, with two bilayers along the direction. Upon heating, it transforms continuously to the higher symmetry Cmcm phase at 800 K, Chattopadhyay et al. (1986); Adouby et al. (1998) as illustrated in Fig. 1. This second-order phase transition corresponds to the condensation of the TO soft phonon mode of symmetry at the Brillouin zone center () in the Pnma phase (see Fig. 2f), as predicted based on symmetry arguments, Adouby et al. (1998) and experimentally observed with INS.Li et al. (2015) However, a direct connection between electronic structure and the strong anharmonicity in SnSe, which underpins its ultra-low thermal conductivity, has remained elusive. This question is deeply connected with the phonon mode instability and the microscopic mechanism of the phase transition. In this Letter, we show how the lattice instability in SnSe arises from a Jahn-Teller-like electronic instability in the Cmcm phase, which results in very large anharmonicity and ultra-low thermal conductivity. In addition, we investigate the anharmonically coupled zone-boundary and zone-center phonon modes, which drive the phase transition from Cmcm to Pnma on cooling across .
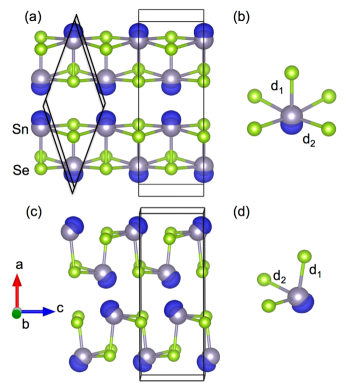
The Pnma and Cmcm structures can be viewed as variants of the rocksalt structure. In both phases, the Sn-Se bilayer is a rocksalt fragment, with the two bilayers offset along the direction, compared to rocksalt. The Pnma phase is further distorted by an off-centering of Sn atoms in their coordination polyhedra. Related distorted structures also appear in the MX family (M=Ge, Sn; X=S, Se, Te), while PbX always crystallizes as rock salt at ambient pressure. not (a) In early investigations, Tremel and Hoffmann Tremel and Hoffmann (1987) rationalized the chemical bonding in SnS based on tight-binding electronic structure calculations and showed that, within their 2-dimensional approximation, the mixing of the conduction and valence bands play an important role in SnS. Waghmare et al. focused on the stereochemical activity of cation lone pair electrons in connection with the structural distortion in several MX compounds. Waghmare et al. (2003) Here, we reveal the origin of strong anharmonicity in SnSe as a coupling of specific phonons with the bonding instability, using accurate first-principles simulations.
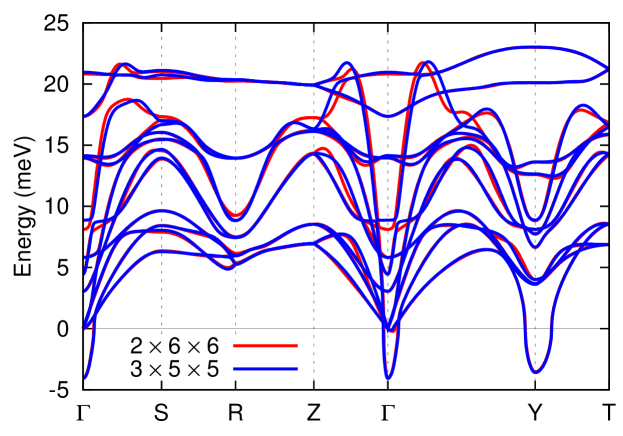
Computations were performed in the framework of density functional theory (DFT) as implemented in the Vienna Ab initio simulation package (VASP) Kresse and Hafner (1993); Kresse and Furthmüller (1996). All calculations used a plane-wave cutoff of 500 eV. We used the local-density approximation (LDA) and projector-augmented-wave (PAW) potentials, explicitly including 4 valence electrons for Sn (5 5) and 6 for Se (4 4). Our calculations used LDA rather than the generalized gradient approximation (GGA) used in Refs. 4; 23, since we previously observed that LDA phonon dispersions match better with INS measurements.Li et al. (2015) We used experimental structures Adouby et al. (1998) as starting configurations and relaxed the lattice parameters and atomic positions until all atomic force components were smaller than 1 meV/Å. The phonon dispersions were calculated with VASP and Phonopy Togo et al. (2008), using 355 supercells (larger in-plan size is tested, see Fig.S1). Based on convergence studies, we used 61212 and 244 Monkhorst-Pack electronic -point meshes for the unit cell and supercell, respectively. We used the software Lobster to compute the crystal orbital hamiltonian populations (COHP). Dronskowski and Bloechl (1993); Deringer et al. (2011); Maintz et al. (2013)
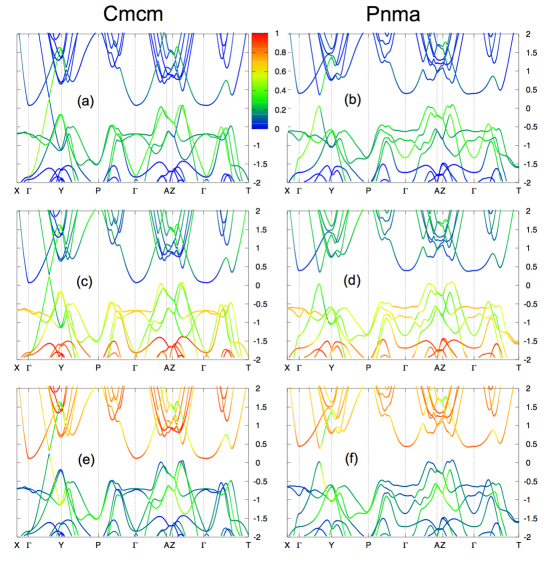
Lattice instability.— The phonon dispersions (see Fig. 2a) in Cmcm, in the harmonic approximation, show soft modes at ( mode) and the zone boundary point (referred to as mode thereafter not (b)). Similar phonon dispersion is reported in Ref. Skelton et al., 2016. At , the soft mode is “ferroelectric-like”: all Sn atoms move toward , while all Se atoms move toward . In the mode, Sn atoms in one bilayer move along and Sn atoms in the other bilayer move along ( and are in Pnma coordinates here, see Fig. 2d). We describe in details below how this zone-boundary mode overlaps with the structural distortion to Pnma, and couples to a Jahn-Teller-like electronic instability. The point in Cmcm becomes in Pnma and this soft mode reappears as the transverse optical mode in Pnma (Ref. Li et al. (2015)).
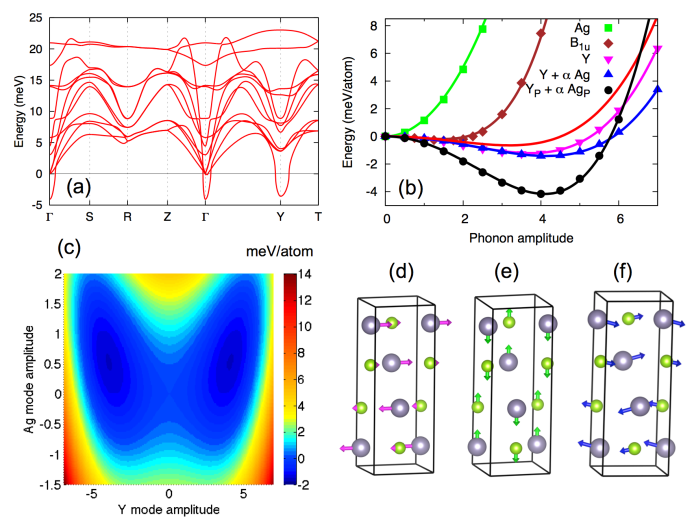
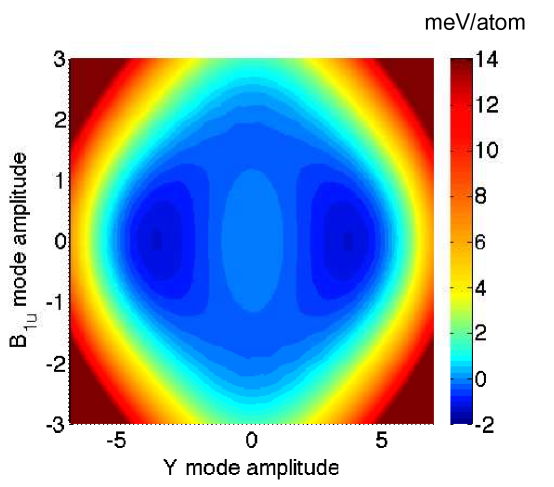
The calculated frozen-phonon potentials for the soft and modes are shown in Fig. 2b. Both modes exhibit a characteristic “double-well” profile (the potentials are symmetric and only the positive side is shown). However, we note that the mode only has a very shallow well ( meV/atom), while the mode shows a deeper double-well ( meV/atom), although still small. The potential energy surface computed from DFT is shown in supplementary Fig.S2. It reveals that these two modes compete with each other, since the energy has minima on the or axes, but increases for combinations. The mode exhibits a stronger instability and it is the primary order parameter for the distortion along that produces the Pnma structure, as experimentally observed. Therefore, in the following we will mostly focus on mode and its coupling with mode.
According to the phase relationship between the experimental Pnma and Cmcm structures, the zone-boundary soft mode at is not sufficient to generate the distortion observed, as some motion of atoms along is also needed (normal to layers). This additional component is provided by an mode at with energy 8.9 meV (see Fig. 2e). We investigate the coupling of and modes, by expanding the potential energy in phonon normal coordinates for phonon mode ():
| (1) | |||
| (2) | |||
| (3) |
Here we have made the approximation of truncating the expansion systematically at overall fourth order, and , is the number of atoms in the supercell, is the mass of atom , is the wavevector, is the position of atom in unit cell , and is the -th atom component of the eigenvector. is the phonon amplitude of mode , and are numerical parameters used to fit DFT energies, with for and modes, owing to mirror symmetry along and directions in Cmcm, respectively. Here, and are the frozen phonon potentials along individual coordinates, while corresponds to the superposition of these two modes. We attempt to express the latter both without coupling, (Eq.(2)), and with mode coupling through and terms in Eq.(3), not (c) denoted . Such couplings of zone-center and zone-boundary modes are of strong current interest in improper hybrid ferroelectric oxides. Bousquet et al. (2008); Benedek and Fennie (2011)
The potential energy surface computed from DFT is shown in Fig. 2c. As can be seen from this figure, the two modes are clearly coupled, with a diagonal minimum for the energy at an amplitude ratio , close to the experimental value of the structural distortion . The DFT energies (markers) in Fig. 2b are fit well using Eq.(1-3), shown as lines on the same figure, indicating the model is appropriate. We note for (i.e. without coupling between and ), the resulting energy curve for (red curve) is clearly higher than for pure mode. A satisfactory fit requires the anharmonic coupling terms in Eq.(3), as shown by the blue curve. We also plot the frozen-phonon potential for the mode alone and the linear combination with . This shows that the potential for alone is stable and increases sharply with phonon amplitude, while the combined mode reaches a lower energy than the pure mode. These results clearly establish the importance of anharmonic coupling between and modes in SnSe.
We note that even the combined distortion lowers the energy by only 1.45 meV/atom, however, much smaller than the total predicted energy difference between relaxed theoretical Cmcm and Pnma phases (5 meV/atom), but this discrepancy can be attributed to the strain. We further explored the respective roles of atomic displacements and lattice strain by computing the distortion potential (, ) in a pseudo-phase based on the optimized Pnma lattice constants but with the Cmcm internal atomic positions. The result is shown in Fig. 2b (black markers and line). The depth of the double-well is now very close to the Cmcm-Pnma energy difference, confirming the importance of strain.
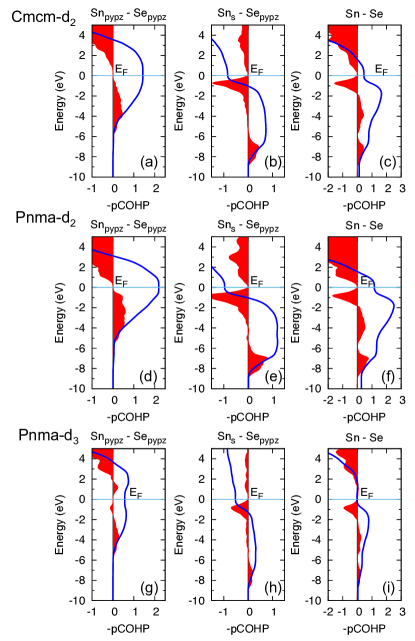
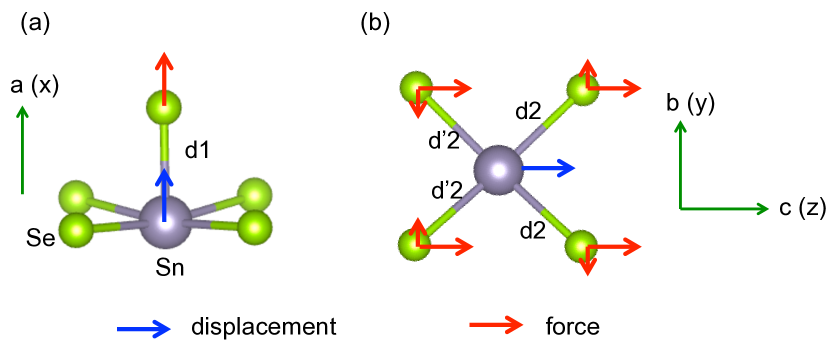
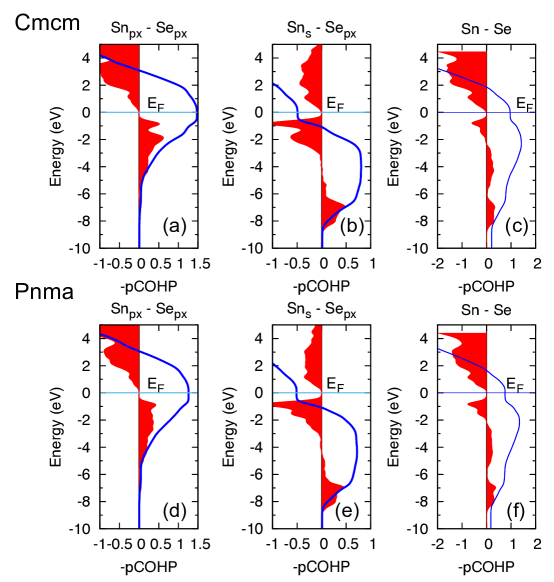
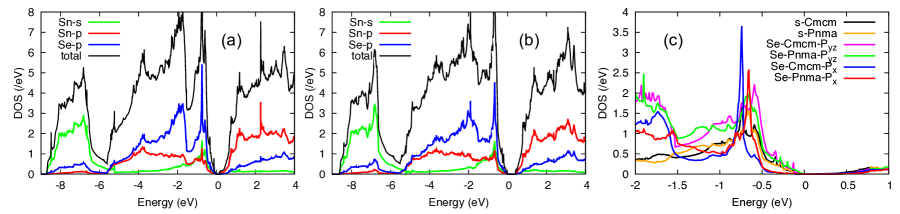
Electronic instability.— We now explain how the lattice instability and mode coupling result from the underlying electronic instability. We start by discussing the projected crystal orbital hamiltonian populations (pCOHP). The related approach of crystal orbital overlap population (COOP) analysis provides electron-resolved bonding information. But we chose the COHP to provide energy-resolved local bonding information, well suited to probe the electronic instability. Dronskowski and Bloechl (1993); Deringer et al. (2011); Maintz et al. (2013) The pCOHP was calculated for bonds , (see notation in Fig. 1), in both Cmcm and Pnma phases and corresponding to the two elongated in-plane bonds in Pnma. The integrated pCOHP (IpCOHP) is also calculated to probe the energetics of bonding and antibonding interactions, as its magnitude correlates with the extent of covalency and relative bonding strength (the more negative value, the stronger covalent bonding strength). The total pCOHP and IpCOHP between the neareast Sn and Se and the main contribution from in-plane Sn and Se orbitals, and the Sn and Se in-plane orbitals are shown in Fig. 3. not (d) The IpCOHP (), bond lengths () and force constants () for , and are compared for both phases in Table 1. A schematic illustration and explanation of negative force-constants in this table can be found in Fig.S3.
| Total | |||||
|---|---|---|---|---|---|
| 2.71 | 2.96 | 2.96 | – | ||
| Cmcm | 0.96 | 0.45 | 0.45 | 2.76 | |
| 3.92 | 0.35 | 0.35 | – | ||
| 2.74 | 2.79 | 3.20 | – | ||
| Pnma | 0.75 | 1.16 | 0.02 | 3.03 | |
| 3.31 | 1.32 | 0.01 | – |
From Fig. 3, one can see that the most energetically favorable interactions are in-plane ( plane) Sn 5 and Se 4. The hybridization between Sn- and in-plane Se- shows strong occupied anti-bonding states just below the Fermi level. In Cmcm, four degenerate Sn-Se bonds share four electrons, forming identical “resonant” half-filled bonds along . This high-symmetry resonant bonding state is energetically unfavorable. In distorted Pnma at low , a geometric distortion breaks the symmetry and causes two shorter () and two longer () bonds. The shorter bonds enhance significantly the in-plane Sn- – Se- interactions (from to eV, Fig. 3a,d), as well as anti-bonding hybridization of Sn- and in-plane Se- to a lesser degree (from to eV, Fig. 3b,e). The bond thus becomes much stiffer and the force-constant ( + increases nearly four-fold from eV/Å2 to eV/Å2, as shown in Table 1. The IpCOHP for bond decreases from eV in Cmcm is to eV in Pnma, showing significant strengthening of bonds. Simultaneously, the bonds weaken to near-zero IpCOHP and force-constant, indicating breaks in the Pnma phase, as the Sn coordination changes to a triangular pyramid with almost equal and bond lengths (see Fig. 1d and Fig.S5). This large difference between and causes the large non-linear forces (anharmonicity) for Sn motion along , as the strongly anharmonic frozen phonon potential for and modes shows in Fig. 2b.
In contrast, the bonding changes little between the two phases (Fig.S4). On cooling, slightly elongates and its force-constant weakens a little, compatible with the IpCOHP. Again, the Sn 5 and Se 4 have occupied anti-bonding states just below the Fermi level ( eV). However, the Sn 5 and Se 4 states are strongly bonding ( eV) and overall the bond is stable and does not change much through the transition. From Cmcm to Pnma, the total IpCOHP (summing over the Sn nearest-neighbor bonds) decreases from eV to eV (Table 1), showing that the latter is electronically more stable. Therefore, the distortion is electronically driven by lowering the electronic energy through lifting the degeneracy of “resonant” bonding in the Cmcm phase, similar to a Jahn-Teller distortion. Jahn and Teller (1937); Pearson (1975)
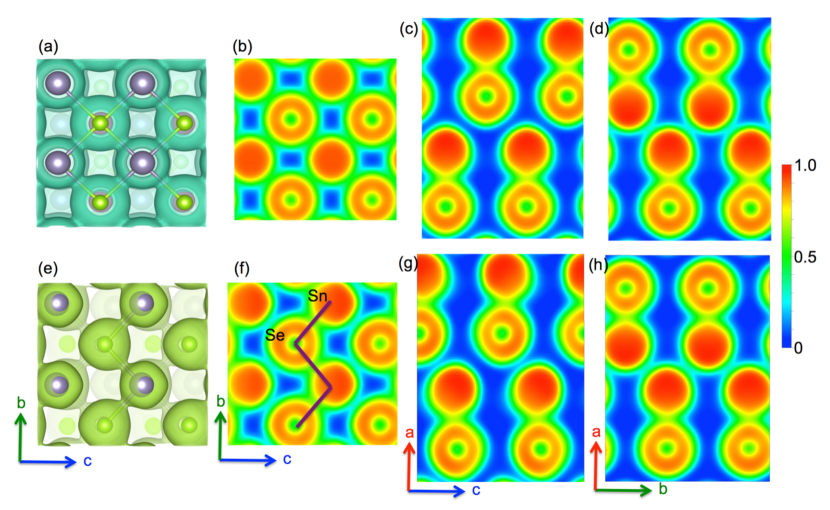
Finally, we investigate the behavior of the Sn 5 lone-pair electrons in the phase transition. In Fig. 1 and Fig.S5, the plots of electron localization functions (ELF) Silvi and Savin (1994) clearly show that the Sn 5 lone-pair electrons are stereochemically active in both phases. As discussed above, the Sn 5 lone-pair combines with the Se 4 states to form a bonding state at eV and an occupied anti-bonding state at the top of the valence band. We also observe an admixture of states across the gap (see Fig.S6). The orbital-weighted band structure (Fig.S6) and projected density of states (Fig.S7) show that the bottom of the conduction band is mostly composed of Sn 5 bands, while the top of the valence band is mainly derived from Sn 5 and Se 4 anti-bonding hybrids, as also evident in Fig. 3. Along the -Y direction (Fig.S6), one can clearly see the mixture of conduction band and valence bands, which is also responsible for the stabilization of the lower symmetry Pnma, as previously suggested by Tremel and Hoffmann. Tremel and Hoffmann (1987).
This can be understood as Sn 5 states and anti-bonding (Sn5Se4)∗ states mixing into a new bonding () state and anti-bonding () state, where is just below and the anti-bonding state above . This stabilization is achieved by distorting from the rocksalt structure and mixing the valence and conduction bands Tremel and Hoffmann (1987). The orbital stabilization requires asymmetric electron density where the lone pair distribution is projected away from the cation (Sn2+) toward the interlayer void region. This is illustrated in Fig. 1d and Fig.S5.
In summary, the lattice distortion in SnSe is driven by a Jahn-Teller electronic instability, which results in strong anharmonicity of lattice dynamics. In particular, zone-boundary and zone-center phonon modes are anharmonically coupled, explaining the observed structural phase transition path from Cmcm to Pnma on cooling across . This behavior is similar to coupled phonon instabilities in hybrid improper ferroelectrics, although the low- phase of SnSe remains non-polar. The instability of the in-plane resonant bonding in this quasi-two-dimensional structure is the chemical origin of the strong anharmonicity, and drives the Jahn-Teller distortion. This mechanism could provide a way to design materials with low thermal conductivity, suitable for the thermoelectric applications, by tuning the chemistry and orbital interactions.
Acknowledgements.
This work was supported by the U.S. Department of Energy, Office of Science, Basic Energy Sciences, Materials Sciences and Engineering Division, through the Office of Science Early Career Research Program (PI Delaire). This research used resources of the Oak Ridge Leadership Computing Facility, which is supported by the Office of Science of the U.S. DOE.References
- Zhao et al. (2014) L.-D. Zhao, S.-H. Lo, Y. Zhang, H. Sun, G. Tan, C. Uher, C. Wolverton, V. Dravid, and M. Kanatzidis, Nature 508, 373 (2014).
- Zhao et al. (2016) L.-D. Zhao, G. Tan, S. Hao, J. He, Y. Pei, H. Chi, H. Wang, S. Gong, H. Xu, V. P. Dravid, et al., Science 351, 141 (2016).
- Chen et al. (2014a) C.-L. Chen, H. Wang, Y.-Y. Chen, T. Day, and G. J. Snyder, J. Mater. Chem. A 2, 11171 (2014a).
- Carrete et al. (2014) J. Carrete, N. Mingo, and S. Curtarolo, Appl. Phys. Lett. 105, 101907 (2014).
- Sassi et al. (2014) S. Sassi, C. Candolfi, J.-B. Vaney, V. Ohorodniichuk, P. Masschelein, A. Dauscher, and B. Lenoir, Appl. Phys. Lett. 104, 212105 (2014).
- Li et al. (2015) C. W. Li, J. Hong, A. F. May, D. Bansal, S. Chi, T. Hong, G. Ehlers, and O. Delaire, Nat. Phys. 11, 1063 (2015).
- Adouby et al. (1998) K. Adouby, C. Perez-Vicente, J. C. Jumas, R. Fourcade, and A. Abba Toure, Z. Kristallogr. 213, 343 (1998).
- Jantsch (1983) W. Jantsch, in Dynamical Properties of IV-VI Compounds (Springer, 1983), vol. 99 of Springer Tracts in Modern Physics, pp. 1–50.
- Delaire et al. (2011) O. Delaire, J. Ma, K. Marty, A. F. May, M. A. McGuire, M.-H. Du, D. J. Singh, A. Podlesnyak, G. Ehlers, M. D. Lumsden, et al., Nat. Mater 8, 614 (2011).
- Zhang et al. (2011) Y. Zhang, X. Ke, P. R. C. Kent, J. Yang, and C. Chen, Phys. Rev. Lett. 107, 175503 (2011).
- Shiga et al. (2012) T. Shiga, J. Shiomi, J. Ma, O. Delaire, T. Radzynski, A. Lusakowski, K. Esfarjani, and G. Chen, Phys. Rev. B 85, 155203 (2012).
- Li et al. (2014a) C. W. Li, J. Ma, H. B. Cao, A. F. May, D. L. Abernathy, G. Ehlers, C. Hoffmann, X. Wang, T. Hong, A. Huq, et al., Phys. Rev. B 90, 214303 (2014a).
- Li et al. (2014b) C. W. Li, O. Hellman, J. Ma, A. F. May, H. B. Cao, X. Chen, A. D. Christianson, G. Ehlers, D. J. Singh, B. C. Sales, et al., Phys. Rev. Lett. 112, 175501 (2014b).
- Chen et al. (2014b) Y. Chen, X. Ai, and C. A. Marianetti, Phys. Rev. Lett. 113 (2014b).
- Lee et al. (2014) S. Lee, K. Esfarjani, T. Luo, J. Zhou, Z. Tian, and G. Chen, Nat. Commun. 5, 3525 (2014).
- Waghmare et al. (2003) U. V. Waghmare, N. A. Spaldin, H. C. Kandpal, and R. Seshadri, Phys. Rev. B 67, 125111 (2003).
- Shportko et al. (2008) K. Shportko, S. Kremers, M. Woda, D. Lencer, J. Robertson, and M. Wuttig, Nat. Mater 7, 653 (2008).
- Chattopadhyay et al. (1986) T. Chattopadhyay, J. Pannetier, and H. Von-Schnering, J. Phys. Chem. Solids 47, 879 (1986).
- not (a) A. F. Wells, Structural Inorganic Chemistry, 4th ed. (Oxford University Press, Oxford, 1974).
- Tremel and Hoffmann (1987) W. Tremel and R. Hoffmann, Inorg. Chem. 26, 118 (1987).
- Kresse and Hafner (1993) G. Kresse and J. Hafner, Phys. Rev. B 47, 558 (1993).
- Kresse and Furthmüller (1996) G. Kresse and J. Furthmüller, Comput. Mater. Sci. 6, 15 (1996).
- Skelton et al. (2016) J. M. Skelton, L. A. Burton, S. C. Parker, A. Walsh, C.-E. Kim, A. Soon, J. Buckeridge, A. A. Sokol, C. R. A. Catlow, A. Togo, et al., arXiv:1602.03762 [cond-mat] (2016).
- Togo et al. (2008) A. Togo, F. Oba, and I. Tanaka, Phys. Rev. B 78, 134106 (2008).
- Dronskowski and Bloechl (1993) R. Dronskowski and P. E. Bloechl, J. Phys. Chem. 97, 8617 (1993).
- Deringer et al. (2011) V. L. Deringer, A. L. Tchougreeff, and R. Dronskowski, J. Phys. Chem. A 115, 5461 (2011), ISSN 1089-5639.
- Maintz et al. (2013) S. Maintz, V. L. Deringer, A. L. Tchougreeff, and R. Dronskowski, J. Comput. Chem. 34, 2557 (2013).
- not (b) In original Cmcm phase, point is (0.5,0.5,0), this point is (0.5,0,0.5) in our notation.
- not (c) The coupling term is omitted because the energy is an even function for mode, due to mirror symmetry along diction in the Cmcm phase.
- Bousquet et al. (2008) E. Bousquet, M. Dawber, N. Stucki, C. Lichtensteiger, P. Hermet, S. Gariglio, J. M. Triscone, and P. Ghosez, Nature 452, 732 (2008).
- Benedek and Fennie (2011) N. A. Benedek and C. J. Fennie, Phys. Rev. Lett. 106, 107204 (2011).
- not (d) We show the negative values (COHP and IpCOHP) in the Fig.3 to resemble the normal COOP plots, i.e. drawing bonding contributions on the right of vertical line of pCHOP=0, and antibonding contribution on the left.
- Jahn and Teller (1937) H. A. Jahn and E. Teller, Proc. R. Soc. A 161, 220 (1937).
- Pearson (1975) R. G. Pearson, Proc. Natl. Acad. Sci. U.S.A. 72, 2104 (1975), ISSN 0027-8424, 1091-6490.
- Silvi and Savin (1994) B. Silvi and A. Savin, Nature 371, 683 (1994).
Support Information: Electronic Instability and Anharmonicity in SnSe
The force constants are defined in a conventional way: Dove ; Bruesch
| (4) |
where , are the Cartesian indices, are the indices of atoms in a unit cell, and are the indices of unit cells, is the potential energy as a function of atomic position . According to this definition, a negative force constant indicates that the force on atom has the same direction as the displacement of atom . For example, if the displacement of atom is along direction, the negative means its displacement induces force on atom along direction, and vice versa.
In main text Table I, the negative force constant for the bond means that when Sn moves “into” this bond direction (blue arrow along in Fig. S3a), the induced force on Se (red arrow) is oriented along along . This is physically reasonable, since the Sn displacement shortens the , which will repel the Se1 atom. For bonds, a similar schematic explains the signs just as simply. Fig. S3b shows a Sn displacement along direction and the forces on surrounding Se atoms. The negative force constant for means that the induced forces on Se2 is along the same direction as the Sn displacement. This displacement also induces forces on neighboring Se atoms along the direction () , which tends to rotate the bonds. This simple picture actually agrees well with the structure evolution from Cmcm to Pnma: bonds become short and the bond angle become larger, while bonds become longer ( bonds in Pnma phase) and the bond angle become smaller.
References
- (1) Martin T. Dove, Introduction to Lattice Dynamics, Cambridge University Press, 1993.
- (2) Peter Bruesch, Phonons: Theory and Experiments I: Lattice Dynamics and Models of Interatomic Forces, Springer Berlin Heidelberg, 2012.
- (3) A. A. Mostofi, J. R. Yates, Y.-S. Lee, I. Souza, D. Vanderbilt and N. Marzari Comput. Phys. Commun. 178, 685 (2008)