Observation of Quantum Equilibration in Dilute Bose Gases
Abstract
We investigate experimentally the dynamical relaxation of a non-integrable quantum many-body system to its equilibrium state. A Bose-Einstein condensate is loaded into the first excited band of an optical lattice and let to evolve up to a few hundreds of milliseconds. Signs of quantum equilibration are observed. There is a period of time, roughly 40 ms long, during which both the aspect ratio of the cloud and its momentum distribution remain constant. In particular, the momentum distribution has a flat top and is not a Gaussian thermal distribution. After this period, the cloud becomes classical as its momentum distribution becomes Gaussian.
pacs:
05.30.-d; 05.30.Jp; 67.85.-d; 03.75.KkI Introduction
The second law of thermodynamics states that the entropy of an isolated system never decreases Huang (1987). When it is applied to quantum systems, the second law implies that an isolated quantum system will dynamically relax to an equilibrium state that has a maximized entropy. Many physicists including Pauli and Schrödinger had attempted to understand this law quantum mechanically Goldstein et al. (2010). Von Neumann was clearly the most successful as he proved both quantum ergodic theorem and quantum H-theorem von Neumann (1929, 2010). According to these two theorems show that most of the non-integrable quantum systems, which are ubiquitous in nature Gutzwiller (1990), will indeed relax dynamically to an equilibrium state, where the macroscopic observables fluctuate only slightly and the entropy is maximized with small fluctuations. These two theorems have now been improved and put in a more transparent framework and on a firmer footing Reimann (2008); Han and Wu (2015).
Experimental observation of the dynamical relaxation of an isolated quantum system had been almost impossible since isolated quantum systems are very hard to prepare in experiments. This situation was changed with the realization of Bose-Einstein condensation (BEC) in dilute atomic gases Anderson et al. (1995). A BEC in such an experiment has no physical contact with a heat bath as it is hold either in a magnetic or an optical trap. As demonstrated in interference and vortex experiments Andrews et al. (1997); Madison et al. (2000) and also in our recent experiment Wang et al. (2015), a BEC can stay in a pure quantum state or the BEC can be regarded as an isolated quantum system up to a few hundred milliseconds. This shows that it is now experimentally possible to study the dynamical relaxation of an isolated quantum system. Such a possibility has generated a great deal of theoretical interests. Along with many theoretical works Goldstein et al. (2006); Popescu et al. (2006); Linden et al. (2009); Short (2011); Yukalov (2011); Zhuang and Wu (2013, 2014), there have already been experimental studies on this issue. However, almost all of the experiments are focused on one dimensional integrable quantum systems Kinoshita et al. (2006); Gring et al. (2012); Smith et al. (2013); Schreiber et al. (2015); Bordia et al. (2016). To the best of our knowledge, the dynamical relaxation of a non-integrable quantum system was only studied in Ref. Henn et al. (2009); Caracanhas et al. (2013); Seman et al. (2010) with the focus on quantum turbulence. As integrable systems are rare and almost all interacting systems in nature are non-integrable Gutzwiller (1990), it appears more important to study the dynamical relaxation of non-integrable quantum systems.
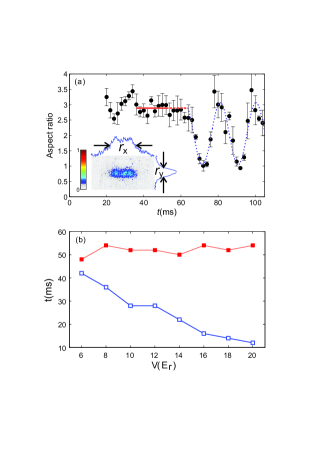
In this work we study experimentally the dynamical relaxation of an isolated non-integrable quantum system. This is achieved by loading a BEC into the first excited band of an optical lattice. The BEC is then let to evolve in time up to 400 ms. The aspect ratio of the BEC cloud after free expansion is found to oscillate initially and then becomes constant during a time window between roughly 35 ms and 50 ms (see Fig.1), during which a plateau is formed. The length of such a plateau increases with the strength of optical lattice and is around 40 ms long for an optical lattice of . During this time plateau, the overall feature of the BEC cloud remains largely unchanged. Specifically, the momentum distribution of the cloud does not change, and has a flat top such that it can not be fitted with any known thermal distribution. Such a plateau strongly indicates that a quantum equilibrium is reached. After the plateau, the oscillations in the aspect ratio are resumed with a frequency that is twice of the trapping frequency. The system eventually reaches the classical thermal equilibrium, where the momentum distribution of the BEC is Gaussian. The non-integrability of our system, a BEC in an optical lattice, is indicated by the dynamical instability found in this system both theoretically Wu and Niu (2001); Xu et al. (2013) and experimentally Fallani et al. (2004).
The article is organized as follows. In Section II, we briefly describe our experimental setup and report that the evolution of our BEC system undergoes three stages. In Section III, we give a detailed description and an analysis of the second stage, where the quantum equilibrium is reached. In Section IV, we describe the third stage, where the classical thermalization is finally reached. Then we conclude in Section V.
II Experimental setup
The experimental setup is similar to our previous work Hu et al. (2015). A nearly pure condensate of about 87Rb atoms is obtained in our hybrid optical-magnetic trap whose harmonic trapping frequencies are Hz. A one dimensional optical lattice is formed along the -direction by retro-reflecting a laser beam with wavelength nm. The lattice constant is then nm. The lattice depth is expressed in units of recoil energy with . The condensate is quickly loaded into the p-band (first excited band) of the optical lattice by using a series of pulsed optical lattices. The pulses are tens of microseconds wide and consist of two sets whose lattice sites are shifted in the axis by . The details of our method can be found in Ref. Hu et al. (2015). The condensate prepared in such a way has a narrow width of quasi-momentum around . Lots of interesting physics has been studied both theoretically and experimentally for a BEC in the p-band Li et al. (2012); Liu and Wu (2006); Kock et al. (2016); Ölschläger et al. (2013); Wirth and Hemmerich (2011). In this work we focus on its dynamical relaxation.
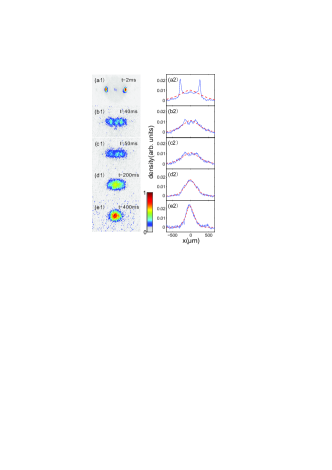
We hold the condensate in the p-band for a period of time up to several hundreds of milliseconds. Then all the potentials are switched off and the atom cloud is released. After a 28 ms free expansion, we take the time-of-flight (TOF) absorption image, which shows the momentum distribution of the atomic cloud. TOF images at five typical holding times are shown in Fig. 2. Initially there are two peaks at , clearly indicates that the condensate is in the p-band Wirth and Hemmerich (2011). As the evolution goes on, these two peaks begin to disappear and a central peak with a flat top emerges around tens of milliseconds, and the distribution stays unchanged for a period of time, an indication that the quantum equilibrium is reached. At 200 ms, the central peak is in a familiar Gaussian distribution. At 400 ms, we not only observe the thermal distribution but also a round cloud shape that is a signature of classical thermal equilibrium Henn et al. (2009).
We have analyzed these TOF images in detail, which shows that the
whole evolution can be divided into three typical stages. There is
an initial oscillation period roughly before 20 ms and this stage is
characterized by the two prominent Bragg peaks in the images. The
detailed analysis of this stage has been done in our previous
work Hu et al. (2015). The second stage follows immediately. In this
stage, the system enters into a stable state, where all the
quantities that we can measure and have measured remain almost
constant. As the system is still in a quantum pure state during this
stage, we call this stage quantum equilibrium stage. After this
stage, oscillations of a different type start the third stage and
they eventually die out. At the third stage, all the TOF images can
be well fit by a Gaussian function. At this final stage the system
is in a mixed state due to inevitable
experimental noise and finally becomes thermalized classically.
III Quantum equilibrium
According to von Neumann von Neumann (1929, 2010) and others Reimann (2008); Han and Wu (2015), a non-integrable quantum many-body system starting from a well-behaved pure state, such as a Gaussian packet and a Bloch state, will eventually evolve dynamically into an equilibrium state which looks intuitively rather random or irregular. As a result, there are two stages of dynamical evolution. In the first stage, which is usually short and characterized by a relaxation time, the quantum system undergoes a certain type of coherent dynamics, which will quickly be destroyed by dephasing. To see this clearly, let us write the dynamics of a quantum system in its general form
| (1) |
where is the system’s energy eigenstate with eigen-energy and coefficient determined by the initial condition. For a non-integrable quantum system, the structure of its energy eigenvalues is very similar to the one of a random matrix Gutzwiller (1990). As a result, the phases will quickly be scrambled as increases. The dephasing occurs, causing the quantum system to equilibrate von Neumann (1929, 2010); Reimann (2008); Han and Wu (2015). In this way, the quantum system enters the second stage, where besides small fluctuations all the observables become constant.
Note that the above theoretical discussion is for a quantum system ideally isolated from the environment and the quantum system is still in a pure state even in the second equilibrium stage. In a real experiment, the quantum system is always coupled to an environment, which can drive a quantum pure state into a mixed state. If the coupling is strong, the second quantum equilibrium stage may never happen as the quantum system can quickly be driven into a mixed state and becomes classical. When the coupling is weak, the second stage can survive for a period of time before entering the third stage, where the system evolves into a mixed state and eventually equilibrate classically.
In our experiment, the coupling to the environment is weak enough and we have indeed observed all the three stages. We use to denote the time the system transition from the first to the second stage and the time the third stage begins. In the first stage coherent oscillations with decay amplitude are observed along with other dynamical features. We have analyzed this stage in detail in Ref. Hu et al. (2015). We shall focus on the second and the third stages.
We attempt to characterize the TOF images quantitatively by using the aspect ratio of the cloud first. We calculate, and , the full widths at half maximum (FWHM) of the atomic cloud in the TOF images along the and axes, respectively. The FWHM in each direction is obtained by integrating the two-dimensional atom distribution in the perpendicular direction to get a one-dimensional momentum distribution and then counting pixels with atom number higher than half of the maximum value. The aspect ratio is then . We have plotted how the aspect ratio changes with time for the case of in Fig.1(a), where each point is the average over five experiments with error bars given by the standard deviation. It is clear that there is a plateau during which the aspect ratio remains largely constant. Note that the ratio in this plateau is about 3, which is far away from 1, the aspect ratio of a thermal cloud (see Fig.2(e1)). This means that the cloud is still quantum during the plateau.
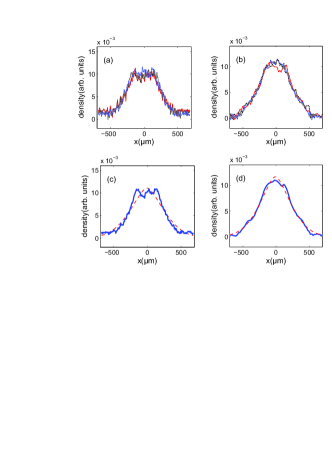
In Fig.3 we have plotted the momentum distributions at different times of this plateau. To demonstrate that the distribution changes little over the plateau, the momentum distributions at the beginning, in the middle, and at the end of the plateau are given in Figs. 3(a) and (b) for the lattice depths of and , respectively. Besides some small fluctuations, the distributions at different times are clearly the same. To reduce the background noise, each line is the average over five experiments with the same holding time. Furthermore, we have plotted in Figs. 3(c) and (d) the averaged momentum distribution over the entire plateau for and , respectively. Similar to the distributions at individual times, these two averaged distributions have a flat top and can not be fit well with a Gaussian. All these features strongly indicate that the system has reached a quantum equilibrium, where the distribution has a rather flat top and can not be fitted with the thermal Gaussian distribution.
The two transition times and can be extracted. Our criterion considers both the fluctuation of the aspect ratio and the momentum distribution. We first determine and by requiring the aspect ratio fluctuates less than of the average value. The average value is also modified when a new point is included. For lattices with strength bigger than , the criterion is changed to when the time span is longer than 20 ms, as the fluctuation of experimental result is larger for higher lattice depth. Then time is adjusted by looking into the momentum distribution. For example, in the case of , we have ms and ms by just considering the fluctuation of . However, when examining the momentum distribution, we find that the center of momentum distribution begins to change gradually from a flat top to a Gaussian one starting at ms. As a result, we set ms, instead of ms. For other lattice depths, this phenomenon is also existed, and each is roughly subtracted by 10 ms after considering this effect.
These two times are plotted in Fig.1(b) as a function of lattice strength with as blue filled squares and as red open squares. The transition time is seen decreased with the lattice strength, indicating that the stronger lattice renders the cloud to quantum equilibrium faster. This is quite reasonable: If we use the dynamical instability to characterize how strong the chaos of the system is, it is known in literature that a BEC in an optical lattice is more chaotic for stronger lattice Wu and Niu (2001). Usually more chaotic systems have shorter relaxation times.
The other transition time remains almost constant around 52 ms. This observation is also consistent with our basic understanding. Our experimental system is weakly coupled to an environment, which includes thermal atoms Nikuni and Griffin (2001), fluctuations of laser field Pichler et al. (2013), inelastic scattering of photons Pichler et al. (2010); Gerbier and Castin (2010). These noises can eventually destroy the “quantumness” of the system and turn it from a pure state to a mixed state. As this coupling to the environment is insensitive to the details of the BEC system, one expects that should be independent of the lattice strength. This is indeed what we have observed. Our estimation shows that the collision from the thermal atoms dominates the environment effects and the relaxation time due to the thermal collision is about 83 ms Nikuni and Griffin (2001), which is consistent with . While the effect of both noise in intensity of laser field and the inelastic scattering of photons would induce a decay in a timescale of several seconds.
Another strong evidence that our system is still in a pure quantum state in the second stage comes directly from our own experiment in Ref. Wang et al. (2015). The experimental setup is the same. The only difference is that the BEC is loaded into the f-band in Ref. Wang et al. (2015), where quantum coherent oscillations similar to Bloch oscillations were observed up to 60 ms. Quantum equilibration was not observed in Ref. Wang et al. (2015). The reason is that the kinetic energy dominates in the higher bands and the interaction can be ignored so that the system is integrable.
According to von Neumann von Neumann (1929, 2010), the equilibrium state we observed in the second stage is caused by the non-integrability of the system. Specifically for our BEC system, the non-integrability comes from the interaction between atoms. The collisions between the atoms can deplete the p-band and render the atoms to the s-band and higher bands or lateral motion. The reversal process can also occur. At the end, these two processes can balance out and our BEC system reaches equilibrium.
The details of the quantum dynamical evolution in the second stage can in principle be described by the many-body Schrödinger equation. However, at present there is no tractable way to solve this equation for our system, which is initially loaded to the state of the p-band, as this state is not even a local energy minimum. The mean-field Gross-Pitaevskii equation can only describe the early moments of the dynamics before the Ehrenfest time (much shorter than ) Han and Wu (2016) due to the existence of dynamical instability Xu et al. (2013).
IV Classical thermalization
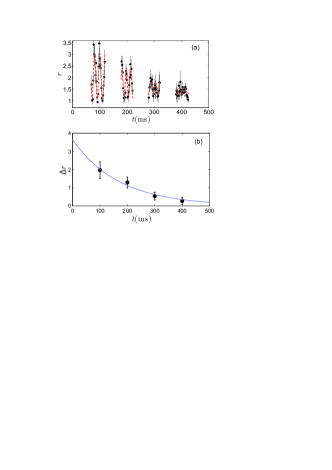
The third stage of the evolution starts around ms, and is characterized by its Gaussian momentum distribution. Interestingly, the aspect ratio of the cloud starts to oscillate again in this stage but with a different frequency. These oscillations last for a long time until the system eventually reaches the classical equilibrium around a few hundreds of milliseconds. As the cloud with is roughly constant, the width oscillates in an identical fashion with . The oscillations of the aspect ratio for the case of are shown in Fig. 4(a). They can be well fitted by slowly-decaying sine functions. Through the fitting, we find the oscillation frequency is Hz. This is approximately twice of the trapping frequency Hz. This frequency doubling is independent of the lattice strength.
This oscillation phenomenon is of classical nature and can be explained as follows. A gas in a harmonic potential can be regarded as a gas of harmonic oscillators with the same frequency. As a result, according to the law of equipartition of energy, its kinetic energy must be equal to its potential energy at equilibrium. In our experiment, when the quantum gas loses its coherence and becomes classical at time , it is yet to reach equilibrium with the trapping harmonic potential. As each atom in the gas oscillates in the trapping potential, the momentum distribution of this gas will oscillate accordingly with a doubled frequency. The reason is that after half of the harmonic oscillation cycle, each atom would change the direction of its momentum in axis while maintaining the magnitude. Due to the symmetry of the system, the overall momentum distribution would have restored the initial state.
As the atomic cloud is not ideally isolated in experiments and the
trap is not perfectly harmonic, it will
eventually equilibrate with the trapping potential. This is
demonstrated by the damping of oscillation amplitude of the aspect
ratio as shown in Fig. 4(b). A numerical
fitting shows that the damping follows an exponential form
with ms. Such a long
relaxation time shows that the system is well isolated and is an
indirect indication that the equilibration observed in the plateau
is of quantum nature. For lattice depth of 8 the
aspect ratio of the atomic cloud becomes constant around 400 ms.
For a deeper lattice, the system would reach thermal equilibrium
faster.
V Conclusion
In sum, we have studied experimentally the dynamical relaxation of a non-integrable quantum system by loading a BEC into the second band of the optical lattice. By following its time evolution, we have observed a quantum equilibrium state, which is characterized by a constant non-Gaussian momentum distribution. Our study here has presented a preliminary experimental test of the two fundamental theorems proved by von Neumann in his pioneering work von Neumann (1929, 2010). Much more is needed to clarify many aspects of this dynamical relaxation. For example, what else can we measure to characterize the quantum equilibrium? And ultimately, can we measure the quantum entropies for quantum pure states defined by von Neumann von Neumann (1929, 2010) or in Ref. Han and Wu (2015).
Acknowledgements.
We acknowledge helpful discussion with Hongwei Xiong. This work is supported by NSFC (Grants N0.61475007, No. 1274024, No. 11334001, and No. 1429402), and the National Basic Research Program of China (Grants No. 2013CB921903 and No. 2012CB921300).References
- Huang (1987) K. Huang, Statistical Mechanics (Wiley, New York, 1987).
- Goldstein et al. (2010) S. Goldstein, J. Lebowitz, R. Tumulka, and N. Zanghi, Eur. Phys. J. H 35, 173 (2010).
- von Neumann (1929) J. von Neumann, Zeitschrift für Phys. 57, 30 (1929).
- von Neumann (2010) J. von Neumann, Eur. Phys. J. H 35, 201 (2010).
- Gutzwiller (1990) M. C. Gutzwiller, Chaos in Classical and Quantum Mechanics (Springer-Verlag, New York, 1990).
- Reimann (2008) P. Reimann, Phys. Rev. Lett. 101, 190403 (2008).
- Han and Wu (2015) X. Han and B. Wu, Phys. Rev. E 91, 062106 (2015).
- Anderson et al. (1995) M. H. Anderson, J. R. Ensher, M. R. Matthews, C. E. Wieman, and E. A. Cornell, Science 269, 198 (1995).
- Andrews et al. (1997) M. R. Andrews, C. G. Townsend, H. Miesner, D. S. Durfee, D. M. Kurn, and W. Ketterle, Science 275, 637 (1997).
- Madison et al. (2000) K. W. Madison, F. Chevy, W. Wohlleben, and J. Dalibard, Phys. Rev. Lett. 84, 806 (2000).
- Wang et al. (2015) Z. Wang, B. Yang, D. Hu, X. Chen, H. Xiong, B. Wu, and X. Zhou, arXiv:1509.07936 (2015).
- Goldstein et al. (2006) S. Goldstein, J. L. Lebowitz, R. Tumulka, and N. Zanghì, Phys. Rev. Lett. 96, 050403 (2006).
- Popescu et al. (2006) S. Popescu, A. J. Short, and A. Winter, Nature Phys. 2, 754 (2006).
- Linden et al. (2009) N. Linden, S. Popescu, A. J. Short, and A. Winter, Phys. Rev. E 79, 061103 (2009).
- Short (2011) A. J. Short, New J. Phys. 13, 053009 (2011).
- Yukalov (2011) V. Yukalov, Laser Phys. Lett. 8, 485 (2011).
- Zhuang and Wu (2013) Q. Zhuang and B. Wu, Phys. Rev. E 88, 062147 (2013).
- Zhuang and Wu (2014) Q. Zhuang and B. Wu, Laser Phys. Lett. 11, 085501 (2014).
- Kinoshita et al. (2006) T. Kinoshita, T. Wenger, and D. S. Weiss, Nature 440, 900 (2006).
- Gring et al. (2012) M. Gring, M. Kuhnert, T. Langen, T. Kitagawa, B. Rauer, M. Schreitl, I. Mazets, D. A. Smith, E. Demler, and J. Schmiedmayer, Science 337, 1318 (2012).
- Smith et al. (2013) D. A. Smith, M. Gring, T. Langen, M. Kuhnert, B. Rauer, R. Geiger, T. Kitagawa, I. Mazets, E. Demler, and J. Schmiedmayer, New J. Phys. 15, 075011 (2013).
- Schreiber et al. (2015) M. Schreiber, S. S. Hodgman, P. Bordia, H. P. Lüschen, M. H. Fischer, R. Vosk, E. Altman, U. Schneider, and I. Bloch, Science 349, 842 (2015).
- Bordia et al. (2016) P. Bordia, H. P. Lüschen, S. S. Hodgman, M. Schreiber, I. Bloch, and U. Schneider, Phys. Rev. Lett. 116, 140401 (2016).
- Henn et al. (2009) E. A. L. Henn, J. A. Seman, G. Roati, K. M. F. Magalhães, and V. S. Bagnato, Phys. Rev. Lett. 103, 045301 (2009).
- Caracanhas et al. (2013) M. Caracanhas, A. L. Fetter, G. Baym, S. R. Muniz, and V. S. Bagnato, J. Low Temp. Phys. 170, 133 (2013).
- Seman et al. (2010) J. A. Seman, E. A. L. Henn, R. F. Shiozaki, G. Roati, F. J. Poveda-Cuevas, K. M. F. Magalhães, V. I. Yukalov, M. Tsubota, M. Kobayashi, K. Kasamatsu, V. S. Bagnato, Laser Phys. Lett. 8, 691 (2010).
- Wu and Niu (2001) B. Wu and Q. Niu, Phys. Rev. A 64, 061603 (2001).
- Xu et al. (2013) Y. Xu, Z. Chen, H. Xiong, W. V. Liu, and B. Wu, Phys. Rev. A 87, 013635 (2013).
- Fallani et al. (2004) L. Fallani, L. De Sarlo, J. E. Lye, M. Modugno, R. Saers, C. Fort, and M. Inguscio, Phys. Rev. Lett. 93, 140406 (2004).
- Hu et al. (2015) D. Hu, L. Niu, B. Yang, X. Chen, B. Wu, H. Xiong, and X. Zhou, Phys. Rev. A 92, 043614 (2015).
- Li et al. (2012) X. Li, Z. Zhang, and W. V. Liu, Phys. Rev. Lett. 108, 175302 (2012).
- Liu and Wu (2006) W. V. Liu and C. Wu, Phys. Rev. A 74, 013607 (2006).
- Kock et al. (2016) T. Kock, C. Hippler, A. Ewerbeck, and A. Hemmerich, J. Phys. B: At. Mol. Opt. Phys. 49, 042001 (2016).
- Ölschläger et al. (2013) M. Ölschläger, T. Kock, G. Wirth, A. Ewerbeck, C. M. Smith, and A. Hemmerich, New J. Phys. 15, 83041 (2013).
- Wirth and Hemmerich (2011) G. Wirth and A. Hemmerich, Nature Phys. 7, 147 (2011).
- Nikuni and Griffin (2001) T. Nikuni and A. Griffin, Phys. Rev. A 65, 011601 (2001).
- Pichler et al. (2013) H. Pichler, J. Schachenmayer, A. J. Daley, and P. Zoller, Phys. Rev. A 87, 033606 (2013).
- Pichler et al. (2010) H. Pichler, A. J. Daley, and P. Zoller, Phys. Rev. A 82, 063605 (2010).
- Gerbier and Castin (2010) F. Gerbier and Y. Castin, Phys. Rev. A 82, 013615 (2010).
- Han and Wu (2016) X. Han and B. Wu, Phys. Rev. A 93, 023621 (2016).