Colloidal particle adsorption at liquid interfaces:
Capillary driven dynamics
and thermally activated kinetics
Abstract
The adsorption of single colloidal microparticles (0.5–1 m radius) at a water-oil interface has been recently studied experimentally using digital holographic microscopy [Kaz et al., Nat. Mater., 2012, 11, 138–142]. An initially fast adsorption dynamics driven by capillary forces is followed by an unexpectedly slow relaxation to equilibrium that is logarithmic in time and can span hours or days. The slow relaxation kinetics has been attributed to the presence of surface “defects” with nanoscale dimensions (1–5 nm) that induce multiple metastable configurations of the contact line perimeter. A kinetic model considering thermally activated transitions between such metastable configurations has been proposed [Colosqui et al., Phys. Rev. Lett., 2013, 111, 028302] to predict both the relaxation rate and the crossover point to the slow logarithmic regime. However, the adsorption dynamics observed experimentally before the crossover point has remained unstudied. In this work, we propose a Langevin model that is able to describe the entire adsorption process of single colloidal particles by considering metastable states produced by surface defects and thermal motion of the particle and liquid interface. Invoking the fluctuation dissipation theorem, we introduce a drag term that considers significant dissipative forces induced by thermal fluctuations of the liquid interface. Langevin dynamics simulations based on the proposed adsorption model yield close agreement with experimental observations for different microparticles, capturing the crossover from (fast) capillary driven dynamics to (slow) thermally activated kinetics.
I Introduction
00footnotetext: a Department of Mechanical Engineering, Stony Brook University, Stony Brook, New York 11794, USA; E-mail: carlos.colosqui@stonybrook.edu00footnotetext: b Harvard John A. Paulson School of Engineering and Applied Sciences, Harvard University, Cambridge, MA 02138, USA.00footnotetext: c Department of Physics, Harvard University, Cambridge, MA 02138, USA. E-mail: vnm@seas.harvard.edu.The adsorption and binding of colloidal particles at liquid interfaces is a fundamental phenomenon in colloid science that is relevant to applications in biomedical, environmental, food, and materials engineering.Binks and Horozov (2006); Kralchevsky and Nagayama (2001) The “irreversible” binding of particles at liquid interfaces has been extensively exploited for emulsion stabilization,Aveyard et al. (2003) encapsulation,Dinsmore et al. (2002) wastewater treatment,Rubio et al. (2002), and self-assembly of novel materials.Lin et al. (2003); Biswas and Drzal (2008); McGorty et al. (2010) Despite the success of diverse technological applications, many fundamental aspects of the adsorption of colloidal particles at liquid interfaces remain poorly understood. Continuum thermodynamic descriptions are conventionally employed to predict the conditions under which colloidal particles bind to a liquid-fluid interface. Stable equilibrium conditions, where the system energy is minimized, are prescribed by the (Young) equilibrium contact angle determined by Young’s law. For colloidal particles larger than 10 nm, the reduction of surface energy at equilibrium can be several orders of magnitude larger than the thermal energy, and thus binding to the interface can become “irreversible”.Pieranski (1980); Aveyard and Clint (1996) While conventional thermodynamic models seem to describe certain fundamental aspects of equilibrium behavior, an increasing number of experimental observations highlight the necessity of developing accurate models for the (non-equilibrium) dynamics of adsorption.
A spontaneous and rapid relaxation to thermodynamic equilibrium is expected for perfectly spherical particles of nano- and microscale dimensions when driving forces associated with wetting and capillarity are much larger than damping forces due to hydrodynamic effects.Huh and Scriven (1971); Petkov et al. (1995); Danov et al. (2000); Singh and Joseph (2005); Fischer et al. (2006) Nevertheless, experimental studies show that colloidal particle adsorption is neither spontaneous nor fast, owing to the presence of significant energy barriers caused by different physicochemical effects. The formation of electric double layers at liquid-liquid and liquid-solid interfaces is a common effect that prevents adsorption and/or hinders the relaxation to equilibrium. Electrostatic energy barriers can be suppressed through the addition of electrolyte salts (e.g., NaCl) in sufficiently large concentration so that surface charges are screened.Ohshima et al. (1982); Mbamala et al. (2002) However, even for weak electrostatic effects, external work must be often applied through hydrodynamic shear or sonication in order to observe significant adsorption rates. Stocco et al. (2011); Du et al. (2010); Garbin et al. (2012); Wang et al. (2012) Recent experimental work by Kaz et al. Kaz et al. (2012) has studied the adsorption of single polystyrene microspheres with different surface functionalities at an interface between a glycerol/water mixture and decane. Optical measurements by 3D digital holographic microscopy revealed a “rapid” initial adsorption of the particles following the spontaneous breach of the water-oil interface, which occurs when the salt concentration is sufficiently high (100 mM NaCl).Kaz et al. (2012) The initial rapid adsorption is followed by a surprisingly slow relaxation to equilibrium that is logarithmic in time and has been attributed to thermally activated pinning/depinning of the contact line at nanoscopic surface defects with areas ranging from 1 to 30 nm2.Kaz et al. (2012) Notably, the observed logarithmic relaxation can take place over several hours or even days and is reminiscent of physical aging in glassy systems with a free energy landscape that is densely populated by multiple local minima.Struik (1977); Palmer et al. (1984)
The logarithmic relaxation reported by Kaz et al. Kaz et al. (2012); Wang et al. (2013) suggests that the interfacial energy of a colloidal particle straddling a liquid-liquid interface has multiple local minima induced by nanoscale surface defects. The interplay between nanoscale surface defects and thermal fluctuations can induce the thermally activated displacement of the three-phase contact line, which results in nontrivial wetting processes.Prevost et al. (1999); Davitt et al. (2013); Colosqui et al. (2015) Previous work by Colosqui et al. Colosqui et al. (2013); Razavi et al. (2014) proposed a kinetic model employing Kramers’ theory of thermally activated transitions on a one-dimensional energy profile that has multiple minima induced by periodic energy barriers with magnitude and period ; here, is the characteristic defect area and is the particle radius. The proposed analytical model predicts that the defect area and particle radius prescribe both the logarithmic relaxation rate and the critical distance from equilibrium where the adsorption process becomes logarithmic in time.
While previous workKaz et al. (2012); Colosqui et al. (2013) has focused on rationalizing the slow logarithmic relaxation observed near equilibrium, no analytical models have been proposed to describe the observed adsorption dynamics preceding the slow logarithmic regime. Recent experimental measurements of the (in-plane) diffusivity of microparticles at interfaces by Boniello et al.Boniello et al. (2015) revealed that hydrodynamic drag models cannot explain the dissipative forces experienced by a particle straddling a liquid-fluid interface at different contact angles. Boniello et al. proposed that thermal motion of the liquid interface can induce a dominant contribution to (in-plane) dissipative forces that can be estimated via the fluctuation-dissipation theorem.Kubo (1966) Building on prior work by Colosqui et al.,Colosqui et al. (2013) this work introduces a Langevin model that is able to describe the entire adsorption dynamics, comprising (fast) capillary-driven and (slow) thermally activated regimes, by considering (1) a surface energy landscape with metastable states induced by nanoscale defects, (2) random fluctuations of surface forces induced by thermal motion of the colloidal particle and liquid-liquid interface, and (3) dissipative forces required to satisfy the fluctuation-dissipation relation.
II Theoretical model
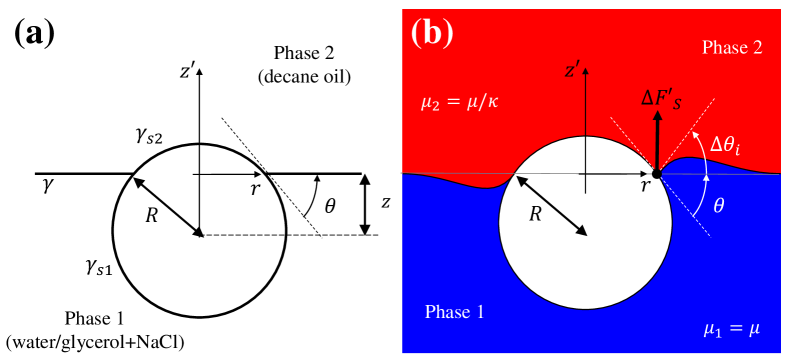
To model the adsorption dynamics we will assume that the particle undergoes uncorrelated Brownian motion. Therefore we employ a classical Langevin equationKubo (1966); Hinch (1975); Colosqui et al. (2013) for the evolution of the (center-of-mass) vertical position . For convenience, is measured relative to the liquid-fluid interface located at (see Fig. 1(a)). Neglecting electrostatic and gravitational effects, the resulting force on the particle is the sum of surface forces , dissipative forces , and forces due to thermal motion . We will consider that the surface force comprises a mean deterministic component determined by the surface free energy , and a zero-mean random force due to thermal fluctuations of the liquid interface. The fluctuation-dissipation theorem Kubo (1966); Hinch (1975) states that dissipative forces and random thermal forces are related through the effective friction coefficient ; here, is a (zero-mean unit-variance) white noise, is the Boltzmann constant and is the temperature of the fluids. The proposed Langevin equation for the particle adsorption dynamics thus readsColosqui et al. (2013)
| (1) |
where is the particle mass. The Langevin model in eqn (1) is valid when the particle is in thermal equilibrium with the surrounding fluids and its position is subject to uncorrelated Brownian motion. Despite the simplifying assumptions, eqn (1) has been able to produce close agreement with fully atomistic molecular dynamics simulations in previous workColosqui et al. (2013) where the fluctuations of the interface and particle may be correlated.
II.1 Surface forces
Within the framework of continuum thermodynamics, changes in the Helmholtz free energy of a colloidal particle at a liquid-fluid interface give the reversible work performed by the system at constant volume and temperature. If we assume symmetry about the polar and azimuth axes, the surface free energy can be parametrized with respect to the particle center of mass position , measured normal to the flat liquid-fluid interface (see Fig. 1a). The surface free energy of a spherical particle of radius straddling a perfectly flat liquid interface located at can be expressed as Aveyard and Clint (1996); Colosqui et al. (2013)
| (2) |
for , where is the equilibrium position determined by the (Young) equilibrium contact angle , is the liquid-fluid surface tension, is the line tension, and is an additive constant.
While the surface tension is always positive and has values on the order of 10 mN/m for water-oil interfaces, the line tension , associated with the excess free energy at the three-phase contact line, can be either positive or negative with a magnitude on the order of 10 pN, according to theoretical estimates.Amirfazli and Neumann (2004) It can be challenging to determine the line tension empirically. Different experimental studies with simple liquids on smooth substrates report values of ranging between 1 and 1000 pN. Widom (1995); Drelich (1996); Checco et al. (2003); Berg et al. (2010) Defining a dimensionless line tension , we can identify two situations in which forces induced by line tension cannot be neglected: (1) when the particle barely straddles the liquid interface, such that , and (2) when the particle is very close to equilibrium, such that . For the microparticles and water-oil interface studied in this workKaz et al. (2012) we have m, N/m and , which gives –. Thus, the line tension contributions in eqn (2) can be neglected for the experimentally observed trajectories .
For perfectly spherical particles and negligible line tension contributions, eqn (2) predicts a single energy minimum at and a relaxation to equilibrium driven by monotonic reduction of surface energy. According to eqn (2), when colloidal particles with nano- or microscale dimensions ( nm) approach equilibrium , they become “irreversibly” adsorbed at the interface because the depth of the energy reduction (i.e., the binding energy) is several orders of magnitude larger than the thermal energy.
II.1.1 Nanoscale surface defects.
Experimental observations for colloidal microparticlesKaz et al. (2012); Wang et al. (2013) have revealed an unexpectedly slow approach to equilibrium due to the presence of nanoscale surface defects not considered in eqn (2). As in previous work by Colosqui et al. Colosqui et al. (2013) we aim to develop an analytical model that incorporates local minima in the surface energy profile that are induced by multiple surface defects with nanoscale dimensions. For this purpose, we assume that the surface of the particle is densely populated by defects with a characteristic nanoscale area that produce surface energy perturbations of magnitude . The displacement of the contact line over a single defect of characteristic area changes the surface energy by an amount and the average contact line position by an amount . To model this process we introduce a periodic spatial perturbation of magnitude and period in the particle free energy so that
| (3) |
The phase of the spatial perturbation produces a negligible shift of the equilibrium position and thus can be arbitrarily chosen; we adopt so that the global energy minimum in eqn (3) remains at the equilibrium position determined by the equilibrium contact angle .
II.1.2 Fluctuating surface forces.
For the case of a liquid-fluid interface fluctuating due to thermal motion, the surface force can be decomposed into mean and fluctuating components , where and ; hereafter, angle brackets indicate ensemble averages. The effects of spatial fluctuations of the contact line induced by localized defects on the particle surface are considered in the free energy profile in eqn (3), and thus in the deterministic mean surface force . We will consider the case when the fluctuating force is due to thermal motion of the liquid-fluid interface, which causes random fluctuations of the local contact angle , where the average contact angle is (see Fig. 1b) and .
The fluctuating surface force normal to the interface can be estimated by summing small contributions (see Fig. 1b) from contact line segments having nanoscale dimensions . In similar fashion, Boniello et al. have estimated fluctuating surface forces parallel to the interface.Boniello et al. (2015) Assuming small random fluctuations of the local contact angle, we obtain the fluctuating surface force
| (4) |
where . The fluctuating surface force given by eqn (4) has zero mean but finite variance , and thus produces a finite energy input to the translational motion of the particle.
II.2 Dissipative forces
A key aspect of the Langevin dynamics modeled by eqn (1) is that deterministic dissipative forces and random forces due to thermal fluctuations are related through the effective friction coefficient , in accordance with the fluctuation-dissipation theorem. For systems in thermal equilibrium, the fluctuation-dissipation relation ensures that the energy input due to random thermal forces is strictly balanced, in the “long-time” limit, by dissipation of energy to the surrounding fluids.Kubo (1966); Hinch (1975) The friction coefficient can be estimated from different theoretical models for predicting dissipative forces. Alternatively, it is possible to determine the effective friction coefficient by employing the Green–Kubo relationKubo (1966); Searles and Evans (2000) , which involves the time autocorrelation of the random thermal forces acting on the particle. We will assume that the thermal force normal to the liquid interface is the sum of the random translational force due to thermal fluctuations of the fluid bulk and the random surface force due to thermal fluctuations of the liquid interface. Further assuming that these random forces are uncorrelated , the friction coefficient is the sum of , which will be determined by dynamic arguments, and , which will be estimated by the fluctuation-dissipation relation as proposed recently by Boniello et al.Boniello et al. (2015)
II.2.1 Translational drag: hydrodynamics and contact line dynamics.
Under creeping flow conditions the friction coefficient associated with translational motion can be generally expressed as , where and are the viscosities of each fluid phase, is the viscosity ratio, and are position-dependent drag coefficients that can be estimated using available hydrodynamic models.Huh and Scriven (1971); Petkov et al. (1995); Danov et al. (2000); Singh and Joseph (2005); Fischer et al. (2006) Given the relatively large viscosity ratio for the experimental conditions studied in this workKaz et al. (2012), is adopted hereafter as the characteristic viscosity. As in previous studies,Kaz et al. (2012); Boniello et al. (2015) we find that translational friction coefficients predicted by different hydrodynamic models for creeping flow conditionsHuh and Scriven (1971); Petkov et al. (1995); Danov et al. (2000); Singh and Joseph (2005); Fischer et al. (2006) are two to three orders of magnitude smaller than those required to agree with experimental observations [see Sec. III.3 for details].
The translational motion of the contact line perimeter can be considered to produce dissipation of energy. According to the molecular kinetic theory (MKT) developed by Blake and co-workersBlake and Haynes (1969); Blake (2006); De Ruijter et al. (1999), the energy “consumed” in the adsorption and desorption of molecules at the moving contact line can be modeled as a virtual dissipative force determined by the friction coefficient , where is the molecular volume of the liquid in phase 1, is the work of adhesion, and is the characteristic size of the adsorption sites. The characteristic size of the adsorption sites is treated as a free parameter that must, however, remain within molecular dimensions (i.e., 1 nm) for consistency with the premises of MKT.Ramiasa et al. (2014) As discussed in detail later in Sec. III.3, maximum friction coefficients (0.1–1 N s/m) predicted by MKT for 0.5–1 nm produce dissipative forces that are two to three orders of magnitude smaller than those required to describe the experimentally observed adsorption dynamics. As reported in previous experimental studies,Kaz et al. (2012); Boniello et al. (2015) we find that damping forces due to hydrodynamics and molecular kinetic effects considered by MKT cannot fully explain the dynamic behavior of particles at interfaces.
II.2.2 Interfacial fluctuations: Green–Kubo relations.
The thermal motion of the liquid interface causes fluctuating surface forces on the particle (cf. Fig. 1b) that must be balanced by dissipative forces in order to satisfy the fluctuation-dissipation relation. Hence, the friction coefficient can be estimated by the Green–Kubo relation
| (5) |
where is the correlation time, assuming an Ornstein–Uhlenbeck process for the relaxation of the interface. In order to estimate the friction coefficient in eqn (5) we will begin by considering that contact angle fluctuations along the contact line perimeter relax through capillary waves that travel at a speed . We can then estimate the correlation time where is a scaling factor accounting for the number of times capillary waves travel around the contact line perimeter before correlation between local fluctuations is completely lost.
Invoking eqn (4) the variance of the fluctuating force is , where the mean square fluctuation of the local contact angle is determined by a balance between thermal energy and elastic surface deformation. Incorporating the expressions above into eqn (5) we arrive at the simple expression
| (6) |
for the friction coefficient determining dissipative forces induced by thermal fluctuations of the interface. For the case of microparticles with nanoscale defect areas , eqn (6) predicts a maximum friction coefficient , which has the magnitude required for agreement between the Langevin model in eqn (1) and experimental observations.Kaz et al. (2012); Wang et al. (2013)
II.3 Crossover to thermally activated adsorption
As the particle approaches equilibrium, where , the free energy in eqn (3) has local energy minima where and the mean surface force vanishes. As a result, sufficiently close to equilibrium the adsorption dynamics described by eqn (1) is no longer driven by a monotonic reduction of surface energy and becomes dominated by thermally activated transitions between multiple metastable states.Colosqui et al. (2013) The crossover to thermally activated adsorption is a gradual process that takes place over a finite position interval that is approximately centered at the crossover point . According to previous work by Colosqui et al.Colosqui et al. (2013) the crossover point can be estimated by the equation
| (7) |
for . The crossover position is prescribed by the free energy profile and is independent of frictional and dissipative effects. Provided that both the energy barrier and period employed in eqns (1)–(3) are properly determined, the crossover criterion in eqn (7) can estimate the critical distance from equilibrium below which the adsorption becomes logarithmic in time.
III Results
The proposed adsorption model consisting of eqns (1)–(3) and (6) has formally three adjustable parameters: (i) the energy barrier magnitude , and (ii) the period prescribing the free energy profile in eqn (3), along with (iii) the dimensionless correlation time, or correlation factor, determining the friction coefficient in eqn (6). However, the energy barrier magnitude and period must be determined by the same nanoscale defect area for consistency with physical arguments. Employing a correlation factor for the friction coefficient in eqn (6) produces the dynamics reported in Figs. 2–4. While small variations in the energy barrier and period produce large differences in the modeled dynamics, the correlation factor can be varied by about 20% without observing significant effects.
For the functionalized polystyrene microspheres ( 1 m) studied in this work, previous experimentsKaz et al. (2012); Wang et al. (2013) have found that the defect area ranges from 5 to 30 nm2 and is uncorrelated with the particle radius. The experimental system is at room temperature (C) and consists of two immiscible phases: phase 1 is a NaCl solution (100 mM NaCl) in a water/glycerol (45:55% w/w) mixture with viscosity 11.5 mPa s, and phase 2 is a anhydrous decane with viscosity 0.9 mPa s. The viscosity mPa s of the aqueous phase (phase 1) is adopted as the characteristic viscosity given the large viscosity ratio (). The surface tension at the water-oil interface is N/m and the equilibrium contact angle for all the studied particles is .Kaz et al. (2012) The experimental measurements have a time resolution of 0.2–10 ms and spatial resolution of 1 nm.
The energy barrier induced by a (three-dimensional) surface defect on the particle surface involves a change of (1) the liquid-liquid interface surface area and (2) the solid wetted area , both comparable but not necessarily equal to characteristic defect area .Colosqui et al. (2013); Razavi et al. (2014) Hence, the magnitude of the energy barrier in eqn (3) is given by where is a shape factor prescribed by the specific geometry of the defect and the Young equilibrium contact angle determined by local surface energies. Naively assuming homogeneous surface energy so that and a spherical cap defect with projected area and protruding height 0–0.5 leads to 0.35–0.2, which is close to the values employed for fitting the experimental results [see Table 1].
| Particle class | (nm2) | (pm) | ||
|---|---|---|---|---|
| Carboxyl | 9.2 | 19.0 | 1.63 | 0.23 |
| Sulphate | 12.9 | 48.9 | 2.34 | 0.41 |
| Carboxylate-modified | 85.7 | 360 | 15.5 | 0.45 |
III.1 Langevin simulations
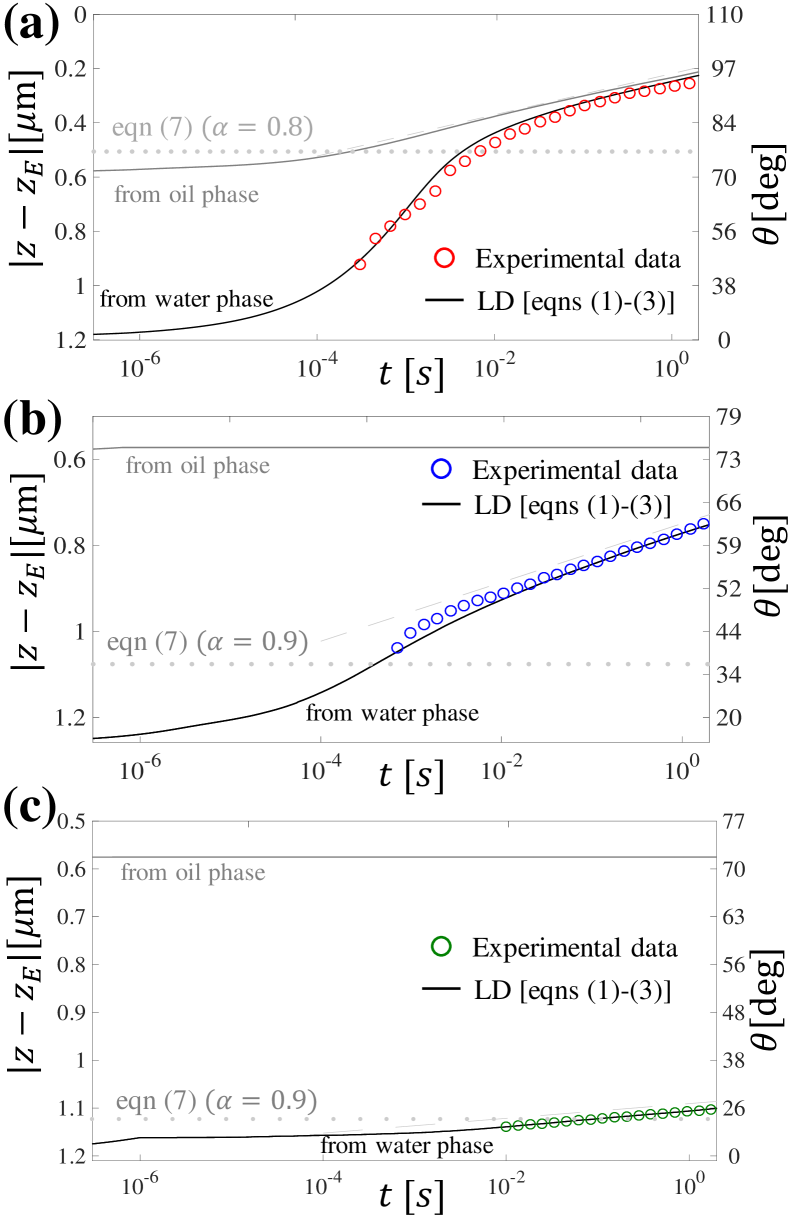
In Table 1 we report the model parameters employed in eqns (1)–(3) for the Langevin Dynamics (LD) simulations in this work. The LD simulations must employ extremely small time steps ps to accurately resolve forces produced by the free energy in eqn (3), which has spatial oscillations with very small periods 1.6–3.6 pm [see Table 1]. Simulated particle trajectories reported in Fig. 2 for three different functionalized particles (carboxyl, sulphate, and carboxylate-modified surface groups) of radius m are in close agreement with experimental observations for adsorption initiated from the aqueous phase.Kaz et al. (2012)
Notably, LD simulations describe both the initial adsorption dynamics, driven by capillary forces induced by reduction of surface energy, and the transition to a thermally activated regime where the particle follows a logarithmic-in-time trajectory as predicted in Ref. 29. The crossover position in all studied cases can be estimated by the criterion in eqn (7) using 0.8–0.9 [see Fig. 2]. Simulations for three studied particles show that the adsorption dynamics can be dramatically different when it is initiated from the oil phase, where the initial position is much closer to equilibrium. Extremely low relaxation rates and kinetically trapped states are observed for large energy barriers [cf. Fig. 2b–c] when the adsorption is initiated in the region , and the entire process is dominated by thermally activated transitions between metastable states.
III.2 Particle size effects
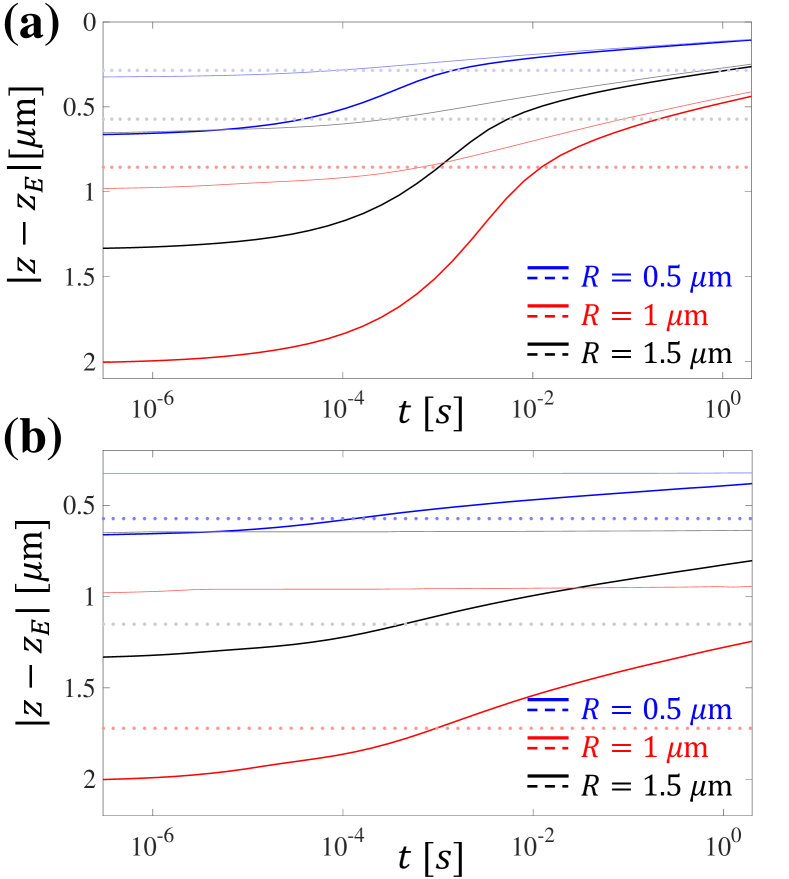
Experimental observations by Kaz et al.Kaz et al. (2012) have reported that the defect area is uncorrelated with the particle size and that it is predominantly determined by the surface functionalization. A series of LD simulations for particles with a fixed defect area ( 9.2 nm2 and 12.9 nm2) and three different radii 0.5, 1, and 1.5 m are reported in Fig. 3. Despite the fact that damping forces scale with , the adsorption dynamics of smaller particles is not significantly faster. When the radius of the particle is reduced the adsorption dynamics enters the slow logarithmic regime much earlier, which is consistent with the crossover criterion in eqn (7). Simulations for the studied range of microparticle radii 0.5–1.5 m with energy barriers much larger than the thermal energy (cf. sulphate functionalized particles in Fig. 3(b)) reveal that the logarithmic-in-time relaxation to equilibrium cannot be observed within the experimental observation window (0 to 2 s) if the adsorption is initiated from the oil phase; these findings are consistent with recent experimental observations.Wang et al. (2013)
III.3 Dissipative effects: Drag models comparison
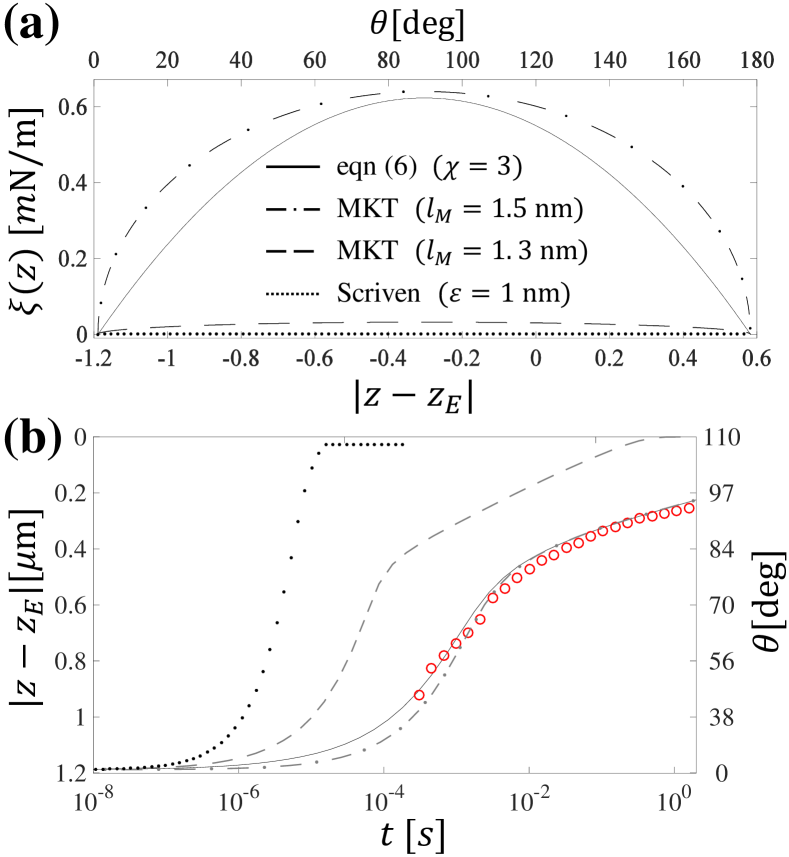
To determine the dissipative force employed in eqn (1) we considered different contributions predicted by hydrodynamic models, Blake’s MKT theory for contact line dynamics, and eqn (6) derived by invoking the fluctuation-dissipation theorem. For the case of hydrodynamic drag contributions, we found that models based on Stokes flow predict friction coefficients that are smaller than or comparable to those predicted by Scriven’s corner flow model in the limit of physically meaningful values of the molecular cutoff length .Huh and Scriven (1971) In Fig. 4a we report the value of the position-dependent friction coefficient predicted for the studied experimental conditions by three different models: (1) Scriven’s hydrodynamic model for corner flow adopting a molecular cutoff length nm,Huh and Scriven (1971) (2) MKT predictionsBlake (2006) for two adsorption site sizes 1.3 nm and 1.5 nm, and (3) the expression derived in eqn (6) with a correlation factor . For a carboxyl functionalized particle with m and nanoscale defect area 12 nm2 [see Table 1], eqn (6) predicts a maximum friction coefficient 6.2 N s/m, which is within the magnitude range required for agreement between the adsorption dynamics modeled by eqn (1) and experimental observations.Kaz et al. (2012); Wang et al. (2013) As showed in Figs. 4a–b, large dissipative forces are required to describe the experimentally observed trajectories. Such dissipative forces are predicted by the friction coefficient in eqn (6), which can be several orders of magnitude larger than friction coefficients due to hydrodynamic and molecular kinetic effects. Employing MKT predictions with an adsorption site of size nm results in a friction coefficient that is sufficiently large to produce a reasonable (but not optimal) fit to the experimental data [cf Fig. 4b]. However, the energy barrier employed to describe the logarithmic relaxation rate and estimate the crossover point via eqn (7) is significantly larger than the work of adsorption corresponding to nm. Moreover, the use of molecular adsorption sites with dimensions nm is beyond the original premises of Blake’s MKT. As indicated by Blake and co-workers,Blake and De Coninck (2011) modeling the effects of nano- and mesoscale surface defects is likely to require the use of alternative models based on Kramers theory.Colosqui et al. (2013); Razavi et al. (2014) Notably, for the range of defect sizes 9.2–85.7 nm2 employed to fit the logarithmic relaxation rates of different particles, the friction coefficient (eqn (6)) derived from the fluctuation-dissipation theorem accounts quantitatively for the observed adsorption dynamics.
IV Conclusions
We have proposed a Langevin dynamics approach for the adsorption of single colloidal particles that considers deterministic spatial fluctuations of the free energy induced by nanoscale surface defects and random thermal fluctuations of the particle position and local contact angle with the liquid interface. The proposed Langevin model is able to describe the entire adsorption dynamics of single microparticles with different surface functional groups that has been reported in previous experimental work. The adsorption dynamics exhibits two remarkably different regimes: (i) capillary-driven adsorption dominated by reduction of surface energy, and (ii) thermally activated adsorption governed by random transitions between multiple metastable states. The capillary-driven regimes are observed during the initial stages of the adsorption process and are damped by friction forces that are much larger than predicted by previously available drag models. In our model, the thermal motion of the interface produces off-plane fluctuating surface forces that have zero mean and finite variance and are uncorrelated with the off-plane translational motion of the particle. The energy injected into the particle translation by fluctuating surfaces forces must be dissipated by a large damping force in order to satisfy the fluctuation-dissipation relation for a system in thermal equilibrium. By means of the Green-Kubo formalism we have derived a new analytical expression that predicts dissipative forces with the magnitude and functional dependence on the particle position that are required to describe the experimentally observed dynamics of adsorption. The crossover to slow thermally activated regimes observed in experiments and simulations can be predicted by a simple analytical criterion (eqn (7)) based on the emergence of local energy minima when thermodynamic equilibrium is approached.
The proposed Langevin model allows us to elucidate novel aspects of the dynamics of adsorption of single colloidal microspheres at liquid-fluid interfaces and make a few useful predictions for further experimental validation. For example, invoking the crossover criterion in eqn (7) the characteristic defect area , where 0.8–0.9, could be estimated from the experimentally observed crossover position , once the energy barrier is determined by fitting the logarithmic regime. In the absence of nanoscale characterization techniques to determine the shape and characteristic area of surface defects, the proposed analytical model along with experimental observations can serve as a probe of such nanoscale features. A better understanding of the adsorption dynamics, as provided by the models in this work, will help in determining fundamental properties of particles at interfaces, such as their equilibrium and non-equilibrium binding energy and contact angle.
We thank D.M. Kaz, J. Koplik, R. McGorty, and J.M. Morris for useful discussions. AW and VNM acknowledge support from the National Science Foundation under grant no. DMR-1306410 and from the Harvard MRSEC, supported by NSF grant no. DMR-1420570. AMR and CEC acknowledge support from the SEED Grant Program by The Office of Brookhaven National Laboratory (BNL) Affairs at Stony Brook University (SBU). This work employed computational resources from the Institute for Advanced Computational Science at SBU and the BNL Center for Functional Nanomaterials supported by the U.S. DOE under Contract No. DE-SC0012704.
References
- Binks and Horozov (2006) B. P. Binks and T. S. Horozov, Colloidal particles at liquid interfaces, Cambridge University Press, 2006.
- Kralchevsky and Nagayama (2001) P. Kralchevsky and K. Nagayama, Particles at fluid interfaces and membranes, Elsevier Science New York, NY, USA, 2001.
- Aveyard et al. (2003) R. Aveyard, B. P. Binks and J. H. Clint, Adv. Colloid Interface Sci., 2003, 100, 503–546.
- Dinsmore et al. (2002) A. Dinsmore, M. F. Hsu, M. Nikolaides, M. Marquez, A. Bausch and D. Weitz, Science, 2002, 298, 1006–1009.
- Rubio et al. (2002) J. Rubio, M. Souza and R. Smith, Miner. Eng., 2002, 15, 139–155.
- Lin et al. (2003) Y. Lin, H. Skaff, T. Emrick, A. Dinsmore and T. Russell, Science, 2003, 299, 226–229.
- Biswas and Drzal (2008) S. Biswas and L. T. Drzal, Nano Lett., 2008, 9, 167–172.
- McGorty et al. (2010) R. McGorty, J. Fung, D. Kaz and V. N. Manoharan, Mater. Today, 2010, 13, 34–42.
- Pieranski (1980) P. Pieranski, Phys. Rev. Lett., 1980, 45, 569.
- Aveyard and Clint (1996) R. Aveyard and J. H. Clint, J. Chem. Soc., Faraday Trans., 1996, 92, 85–89.
- Huh and Scriven (1971) C. Huh and L. Scriven, J. Colloid Interface Sci., 1971, 35, 85–101.
- Petkov et al. (1995) J. T. Petkov, N. D. Denkov, K. D. Danov, O. D. Velev, R. Aust and F. Durst, J. Colloid Interface Sci., 1995, 172, 147–154.
- Danov et al. (2000) K. D. Danov, R. Dimova and B. Pouligny, Phys. Fluids, 2000, 12, 2711–2722.
- Singh and Joseph (2005) P. Singh and D. Joseph, J. Fluid Mech., 2005, 530, 31–80.
- Fischer et al. (2006) T. M. Fischer, P. Dhar and P. Heinig, J. Fluid Mech., 2006, 558, 451–475.
- Ohshima et al. (1982) H. Ohshima, T. W. Healy and L. R. White, J. Colloid Interface Sci., 1982, 90, 17–26.
- Mbamala et al. (2002) E. Mbamala et al., J. Phys.: Condens. Matter, 2002, 14, 4881.
- Stocco et al. (2011) A. Stocco, E. Rio, B. P. Binks and D. Langevin, Soft Matter, 2011, 7, 1260–1267.
- Du et al. (2010) K. Du, E. Glogowski, T. Emrick, T. P. Russell and A. D. Dinsmore, Langmuir, 2010, 26, 12518–12522.
- Garbin et al. (2012) V. Garbin, J. C. Crocker and K. J. Stebe, J. Colloid Interface Sci., 2012, 387, 1–11.
- Wang et al. (2012) H. Wang, V. Singh and S. H. Behrens, J. Phys. Chem. Lett., 2012, 3, 2986–2990.
- Kaz et al. (2012) D. M. Kaz, R. McGorty, M. Mani, M. P. Brenner and V. N. Manoharan, Nat. Mater., 2012, 11, 138–142.
- Struik (1977) L. Struik, Polym. Eng. Sci., 1977, 17, 165–173.
- Palmer et al. (1984) R. G. Palmer, D. L. Stein, E. Abrahams and P. W. Anderson, Phys. Rev. Lett., 1984, 53, 958.
- Wang et al. (2013) A. Wang, D. M. Kaz, R. McGorty and V. N. Manoharan, AIP Conference Proceedings, 2013, 1518, 336–343.
- Prevost et al. (1999) A. Prevost, E. Rolley and C. Guthmann, Phys. Rev. Lett., 1999, 83, 348.
- Davitt et al. (2013) K. Davitt, M. S. Pettersen and E. Rolley, Langmuir, 2013, 29, 6884–6894.
- Colosqui et al. (2015) C. E. Colosqui, T. Teng and A. M. Rahmani, Phys. Rev. Lett., 2015, 115, 154504.
- Colosqui et al. (2013) C. E. Colosqui, J. F. Morris and J. Koplik, Phys. Rev. Lett., 2013, 111, 028302.
- Razavi et al. (2014) S. Razavi, I. Kretzschmar, J. Koplik and C. E. Colosqui, J. Chem. Phys., 2014, 140, 014904.
- Boniello et al. (2015) G. Boniello, C. Blanc, D. Fedorenko, M. Medfai, N. B. Mbarek, M. In, M. Gross, A. Stocco and M. Nobili, Nat. Mater., 2015, 908–911.
- Kubo (1966) R. Kubo, Rep. Prog. Phys., 1966, 29, 255.
- Hinch (1975) E. Hinch, J. Fluid Mech., 1975, 72, 499–511.
- Amirfazli and Neumann (2004) A. Amirfazli and A. Neumann, Adv. Colloid Interface Sci., 2004, 110, 121–141.
- Widom (1995) B. Widom, J. Phys. Chem., 1995, 99, 2803–2806.
- Drelich (1996) J. Drelich, Colloids Surf., A, 1996, 116, 43–54.
- Checco et al. (2003) A. Checco, P. Guenoun and J. Daillant, Phys. Rev. Lett., 2003, 91, 186101.
- Berg et al. (2010) J. K. Berg, C. M. Weber and H. Riegler, Phys. Rev. Lett., 2010, 105, 076103.
- Searles and Evans (2000) D. J. Searles and D. J. Evans, J. Chem. Phys., 2000, 112, 9727–9735.
- Blake and Haynes (1969) T. Blake and J. Haynes, J. Colloid Interface Sci., 1969, 30, 421–423.
- Blake (2006) T. D. Blake, J. Colloid Interface Sci., 2006, 299, 1–13.
- De Ruijter et al. (1999) M. J. De Ruijter, T. Blake and J. De Coninck, Langmuir, 1999, 15, 7836–7847.
- Ramiasa et al. (2014) M. Ramiasa, J. Ralston, R. Fetzer and R. Sedev, Adv. Colloid Interface Sci., 2014, 206, 275–293.
- Blake and De Coninck (2011) T. Blake and J. De Coninck, Eur. Phys. J. Spec. Top., 2011, 197, 249–264.