Disappearance of the Progenitor of Supernova iPTF13bvn
Abstract
Supernova (SN) iPTF13bvn in NGC 5806 was the first Type Ib SN to have been tentatively associated with a progenitor in pre-explosion images. We performed deep ultraviolet (UV) and optical Hubble Space Telescope observations of the SN site days after explosion. We detect an object in the optical bands that is fainter than the pre-explosion object. This dimming is likely not produced by dust absorption in the ejecta; thus, our finding confirms the connection of the progenitor candidate with the SN. The object in our data is likely dominated by the fading SN, implying that the pre-SN flux is mostly due to the progenitor. We compare our revised pre-SN photometry with previously proposed models. Although binary progenitors are favored, models need to be refined. In particular, to comply with our deep UV detection limit, any companion star must be less luminous than a late-O star or substantially obscured by newly formed dust. A definitive progenitor characterization will require further observations to disentangle the contribution of a much fainter SN and its environment.
Subject headings:
supernovae: general – supernovae: individual (iPTF13bvn) – stars: evolution – galaxies: individual (NGC 5806)1. INTRODUCTION
The stellar origin of hydrogen-free core-collapse supernovae (SNe) remains unknown chiefly owing to the lack of detections of progenitor stars in pre-explosion images (Eldridge et al., 2013). The only firm progenitor candidate found thus far is that of iPTF13bvn, a Type Ib supernova (SN Ib) in the galaxy NGC 5806 (Cao et al., 2013). If confirmed, this case can provide important clues about the mechanisms of envelope removal among massive stars. One proposed mechanism for very massive stars ( M⊙) is strong stellar winds leading to Wolf-Rayet (WR) progenitors (Heger et al., 2003), but such massive progenitors are difficult to reconcile with the large fraction of stripped-envelope explosions (Smith et al., 2011) and their low ejecta masses (Drout et al., 2011; Dessart et al., 2011; Hachinger et al., 2012). The more common alternative is mass transfer in close binary systems (Shigeyama et al., 1990; Podsiadlowski et al., 1992), allowing less-massive stars to lose their envelopes (e.g., Benvenuto et al., 2013). The relative incidence of each type of progenitor is still unknown.
Cao et al. (2013) used pre-explosion Hubble Space Telescope (HST) imaging, together with early-time SN observations, to suggest that the progenitor of iPTF13bvn was a compact WR star. Groh et al. (2013b) found that the pre-explosion photometry could be fit with models of single WR stars in the initial mass range of 31–35 M⊙. However, from hydrodynamical light-curve modeling, Bersten et al. (2014) inferred a low pre-SN mass ( M⊙) and disfavored a massive WR star; instead, they presented close binary system models that could explain the pre-explosion photometry and the progenitor mass and radius derived from the SN observations. By analyzing the light curves, Fremling et al. (2014) and Srivastav et al. (2014) also disfavored a massive WR progenitor. Kuncarayakti et al. (2015) argued for a low-mass progenitor based on the strength of oxygen and calcium lines in the late-time spectrum. Subsequently, Eldridge et al. (2015) (E15, hereafter) revised the pre-explosion photometry and found the progenitor to be brighter than measured by Cao et al. (2013); see also our measurements in Section 2. With the new magnitudes and using binary evolution calculations, E15 argued in favor of the binary scenario. The same conclusion was found by Kim et al. (2015). Assuming the binary configurations discussed by Bersten et al. (2014), Hirai & Yamada (2015) simulated the effect of the SN shock on the companion star. They found that the companion could bloat and thus evolve to a red-supergiant structure on a timescale of a few years after explosion. We note, however, that similar shock simulations performed by Liu et al. (2015), although for different companion masses, do not predict such a post-explosion evolution.
To better determine the progenitor’s nature, the SN site had to be reobserved after the ejecta faded enough to probe the disappearance of the pre-SN object. In this work we present new HST observations that reveal a decrease in flux relative to the pre-SN observations, confirming that this is the first SN Ib with a progenitor detection111In the final stages of preparing this manuscript, Eldridge & Maund (2016) independently reported the disappearance of the progenitor candidate using some of the data presented herein.. In Section 2 we describe the observations and photometry methods. The new data are analyzed in Section 3 to constrain the progenitor nature. We present our conclusions in Section 4.
2. OBSERVATIONS AND PHOTOMETRY
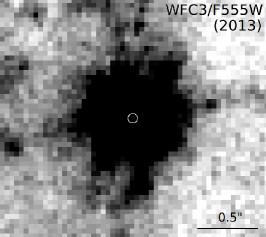
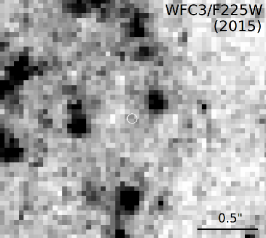
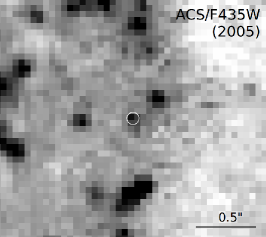
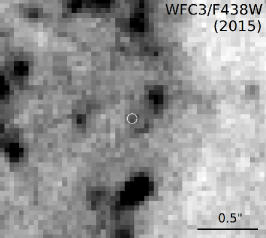
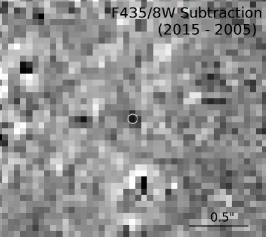
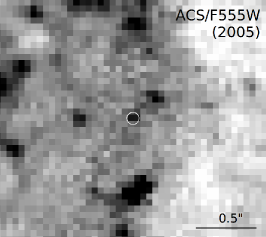
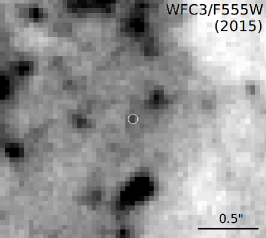
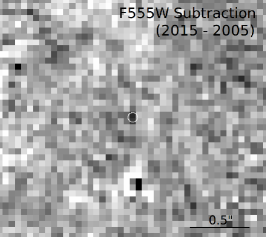
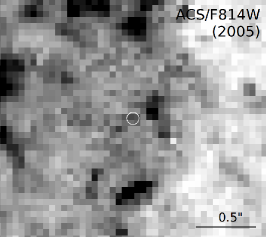
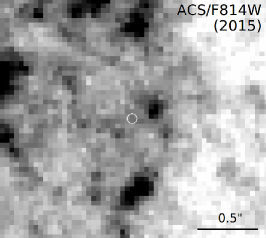
We obtained deep imaging of the field of iPTF13bvn days after explosion using HST through Cycle 22 programs GO-13684 and GO-13822. Program GO-13684 was executed between 2015 June 26.37 and 26.60 (UT dates are used herein) with the Wide Field Camera 3 (WFC3) UVIS channel; see Table 1. Program GO-13822 comprised observations obtained on 2015 June 30.63 with WFC3/UVIS (F225W filter) and on June 30.90 UT with the Advanced Camera for Surveys (ACS; F814W filter). The 2015 images are shown in Figure 1, along with the pre-explosion images obtained in 2005 through program GO-10187 with ACS.
The SN location in the pre- and post-explosion images was found by aligning them relative to a F555W image obtained through program GO-12888 with WFC3/UVIS on 2013 September 2.37 when the SN was still very bright. The registration was done with the AstroDrizzle package employing 20 point sources in common. The resulting precision (root-mean square) was 0.081 pixel (32 mas) and 0.090 pixel (36 mas) in the and axes, respectively. The F435W, F555W, and F814W images from 2015 show an object at the SN location, whereas the F225W image exhibits no identifiable source at the same place.
After correcting for charge-transfer-efficiency losses and masking of cosmic-ray hits, we performed photometry on the pre- and post-explosion images using the DOLPHOT v2.0 package (Dolphin, 2000). Our measurements are listed in Table 2 along with others from the literature. The pre-explosion photometry given here is roughly consistent with that presented by E15 (both their values from DOLPHOT, and the average with DAOPHOT measurements), and it is brighter by 0.3–0.5 mag than what Cao et al. (2013) measured. In a recent work, Eldridge & Maund (2016) published photometry of the 2015 F438W and F555W images. Their values are brighter than ours, more significantly so (by ) in the F555W band. We have tried to reproduce their results by changing the parameters in DOLPHOT, but could not obtain exactly the same values. This may in part be due to the fact that they apply DOLPHOT on the _crj files while we use the _flc files. Additionally, E15 mention that they adopt the recommended DOLPHOT parameters. Among these, the sky-fitting algorithm parameter, FitSky, is suggested to be set as 1 for general purposes in the DOLPHOT v2.0 ACS module manual. However, for a crowded field such as that of iPTF13bvn, the recommendation is to perform the sky fit inside a relatively large photometry aperture by adopting FitSky=3 (Dalcanton et al., 2009), which was our choice. If we instead use FitSky=1, we obtain F555W mag, in close agreement with Eldridge & Maund (2016). We also obtain large negative sharpness values, as mentioned by those authors, which is not seen with FitSky=3. We conclude that the main source of discrepancy is likely the choice of the sky-fitting algorithm, and that for the field of iPTF13bvn, our procedure is more accurate. Nevertheless, we note that the main conclusions in the present work would not change if we adopted the photometry in E15 and Eldridge & Maund (2016).
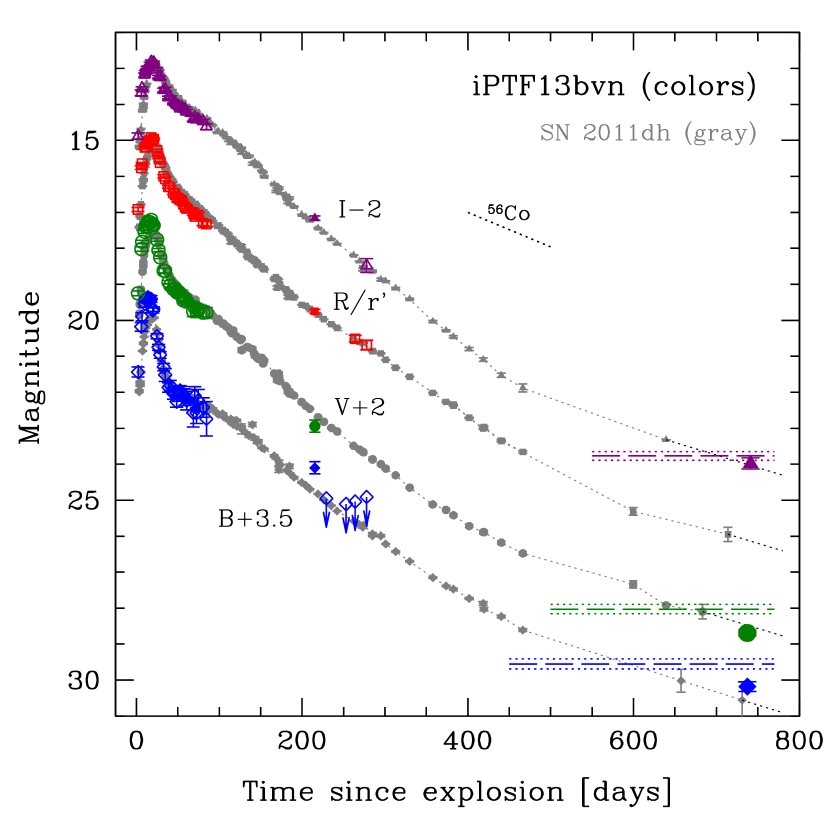
Figure 2 (left panel) shows the HST magnitudes converted to . The conversion was calculated using synthetic photometry from the 306 day spectrum of Kuncarayakti et al. (2015), which gave mag, mag, and mag.
We used the F225W image to compute a detection limit at the SN location, employing DOLPHOT to add artificial stars near the SN site with a uniform distribution of brightness over 25.4–27.4 mag. DOLPHOT was run on the resulting images to recover the artificial sources. A detection limit of 26.4 mag was found where the recovery fraction dropped to 50%, which is roughly equivalent to a 5 detection limit (Harris, 1990).
| UT Date | Instrument/ | Filter | Exposure | Program | Program |
|---|---|---|---|---|---|
| Detector | (s) | ID | PI | ||
| Pre-explosion | |||||
| 2005 Mar 10 | ACS/WFC | F435W | 1600 | GO-10187 | Smartt |
| 2005 Mar 10 | ACS/WFC | F555W | 1400 | GO-10187 | Smartt |
| 2005 Mar 10 | ACS/WFC | F814W | 1700 | GO-10187 | Smartt |
| Post-explosion | |||||
| 2013 Sep 03 | WFC3/UVIS | F555W | 1200 | GO-12888 | Van Dyk |
| 2015 Jun 26 | WFC3/UVIS | F438W | 5720 | GO-13684 | Van Dyk |
| 2015 Jun 26 | WFC3/UVIS | F555W | 5610 | GO-13684 | Van Dyk |
| 2015 Jun 30 | WFC3/UVIS | F225W | 8865 | GO-13822 | Folatelli |
| 2015 Jun 30 | ACS/WFC | F814W | 2345 | GO-13822 | Folatelli |
| UT Date | F225W | F435W/F438W | F555W | F814W | Source |
|---|---|---|---|---|---|
| 2005 Mar 10 | (15) | (15) | (20) | Cao et al. (2013) | |
| 2005 Mar 10 | (06) | (08) | (10) | E15 (DOLPHOT) | |
| 2005 Mar 10 | (12) | (11) | (24) | E15 (Average) | |
| 2005 Mar 10 | (14) | (13) | (12) | This work | |
| 2015 Jun 26 | (08) | (05) | Eldridge & Maund (2016) | ||
| 2015 Jun 26/30 | aaLimiting magnitude at 50% detection probability. | (14) | (08) | (15) | This work |
| Subtraction (2005–2015) | (12) | (21) | aaLimiting magnitude at 50% detection probability. | This work |
Note. — Uncertainties in parentheses in units of 0.01 mag.
We also obtained imaging of iPTF13bvn until days with the Katzman Automatic Imaging Telescope (KAIT; Filippenko et al., 2001) and the 1 m Nickel telescope at Lick Observatory. Template subtraction was performed using additional images obtained after the SN faded below detection. All images were reduced using a custom pipeline (Ganeshalingam et al., 2010). Point-spread-function (PSF) photometry was measured with the DAOPHOT package (Stetson, 1987). Apparent magnitudes were first measured in the KAIT4 natural system and then transformed to the standard system using local calibrators and color terms as given in Table 4 of Ganeshalingam et al. (2010). We present the resulting light curves in Table 3 and the left panel of Figure 2.
| MJD | PhaseaaRest-frame phase after explosion (JD ). | Telescope | ||||
|---|---|---|---|---|---|---|
| (days) | (mag) | (mag) | (mag) | (mag) | ||
| KAIT | ||||||
| KAIT | ||||||
| KAIT | ||||||
| KAIT | ||||||
| KAIT | ||||||
| KAIT | ||||||
| KAIT | ||||||
| KAIT | ||||||
| KAIT | ||||||
| KAIT | ||||||
| KAIT | ||||||
| KAIT | ||||||
| KAIT | ||||||
| KAIT | ||||||
| KAIT | ||||||
| KAIT | ||||||
| KAIT | ||||||
| KAIT | ||||||
| KAIT | ||||||
| KAIT | ||||||
| KAIT | ||||||
| KAIT | ||||||
| KAIT | ||||||
| KAIT | ||||||
| KAIT | ||||||
| KAIT | ||||||
| KAIT | ||||||
| KAIT | ||||||
| KAIT | ||||||
| Nickel | ||||||
| KAIT | ||||||
| KAIT | ||||||
| Nickel | ||||||
| KAIT | ||||||
| KAIT | ||||||
| KAIT | ||||||
| KAIT | ||||||
| Nickel | ||||||
| Nickel | ||||||
| Nickel | ||||||
| Nickel | ||||||
| Nickel |
Note. — Uncertainties in parentheses given in units of 0.01 mag.

2.1. Distance and Extinction
In the current analysis we adopted a distance to NGC 5806 of Mpc as provided by the NASA/IPAC Extragalactic Database (NED). This value is similar to that used by Bersten et al. (2014), and about 10% (1) greater than the 22.5 Mpc extensively adopted in the literature on iPTF13bvn.
Milky-Way reddening in the direction to iPTF13bvn is mag (Schlafly & Finkbeiner, 2011). Cao et al. (2013) found a total color excess of mag by measuring the equivalent width of Na I D lines in the SN spectrum and using the relation by Poznanski et al. (2012). However, Phillips et al. (2013) pointed out that such a relation underestimates the uncertainty in the extinction. Using observed colors in comparison with a sample of stripped-envelope SNe, Bersten et al. (2014) found a larger value of mag. Srivastav et al. (2014) favored this larger reddening value by comparing the color with the calibration of intrinsic color provided by Drout et al. (2011). We thus adopted the larger reddening value and computed extinction in all bands using the reddening law of Cardelli et al. (1989) with a standard coefficient of . Where indicated, we also considered the shorter distance and lower extinction values from Cao et al. (2013).
3. THE PROGENITOR OF iPTF13bvn
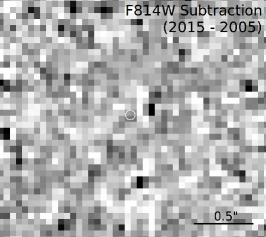
With the magnitudes and detection limit listed in Table 2, we constructed the spectral energy distribution (SED) of the pre- and post-SN source, as shown in the right panel of Figure 2. The source at the SN location faded below the pre-explosion level in 2015. The decrease is significant in the F435W/F438W and F555W bands (by and , respectively), and marginal in F814W. To test this observation, we performed pre-SN minus post-SN image subtractions, using AstroDrizzle to register and degrade the post-SN images to match the pre-SN images. Then we scaled the flux and subtracted with standard IRAF routines. As shown in Figure 1, the subtractions leave detectable sources at the SN location in F435W/F438W and F555W, and only noise in F814W. We performed aperture photometry of the residual object using DAOPHOT, which led to the magnitudes and upper limit listed in Table 2. It is reassuring that the flux in the subtracted images closely matches the subtraction of fluxes measured in the 2005 and 2015 images.
Assuming that the flux decrease is not caused by large amounts of dust formed in the SN ejecta (see Section 3.1), this result confirms the first association of a SN Ib with its progenitor object. However, deriving a conclusion about the progenitor nature requires some interpretation of the new measurements. In principle, the flux in 2015 could be produced by any combination of the following: the fading SN, a light echo, or an underlying object or population related (or not) to the SN. If what we detected is purely the SN, then the pre-SN source is the progenitor itself. In the opposite extreme, if the SN makes a negligible contribution, then the progenitor is revealed in the subtraction of pre-SN minus post-SN images (assuming no variability of the environment). Any intermediate situation is theoretically possible. In the following we shall analyze both extreme cases.
3.1. Case SN: The Fading SN
In order to tell if the detected flux in 2015 was caused by the SN, we compared it with available data on similar events. Unfortunately, there are no observations of other SNe Ib at such a late phase. The only published multiband light curves of stripped-envelope SNe that extend over 700 days are those of the Type IIb SN 1993J and SN 2011dh. However, these SNe may be affected by stronger emission from shock interaction than iPTF13bvn. Indeed, after 500 days SN 1993J showed evidence of prominent interaction emission that flattened the optical light curves (Zhang et al., 2004). In contrast, SN 2011dh appears to have been relatively free of interaction (e.g., see Maeda et al., 2014; Jerkstrand et al., 2015). To test this we performed a simple, one-zone radioactive deposition calculation (Maeda et al., 2003), assuming full positron trapping and -ray optical depth based on the ejected mass and explosion energy given by Bersten et al. (2012). The resulting optical emission is enough to account for the late-time observations of SN 2011dh without the need to invoke strong interaction.
Figure 2 (left panel) shows the light curves of SN 2011dh (Ergon et al., 2014, 2015; Van Dyk et al., 2013), assuming Mpc and mag (Folatelli et al., 2014), and scaled to the distance and extinction of iPTF13bvn. We extrapolated these light curves to 740 days (dotted lines), assuming an average decline rate of mag/day measured between 600 and 700 days. The extrapolation uncertainty was summed in quadrature with the uncertainty of the latest observed points. We decided not to include later observations of SN 2011dh published by Maund et al. (2015) because they were obtained at days (i.e., days after the epoch of our observations), when different emission mechanisms may dominate. The right panel of Figure 2 shows that the resulting SED of SN 2011dh is very similar to that of iPTF13bvn, only slightly fainter in the F435W/F438W band, suggesting that our new images of iPTF13bvn reveal the fading SN.
We also computed spectrophotometry with the spectrum of iPTF13bvn obtained at 306 days by Kuncarayakti et al. (2015). The synthetic fluxes are shown in the right panel of Figure 2, scaled down to reproduce the observed magnitude of at 740 days. The overall SED shape is similar to our measurements at 740 days, which may imply that the spectrum did not evolve significantly. Along with the similarity with SN 2011dh, this suggests the absence of strong interaction or large dust formation, unless both effects canceled each other. The small “excess” in the F438W band seen at 740 days may hint the presence of a hot companion star, as shown in the figure.
Assuming we detected the fading SN, the pre-SN flux could be attributed primarily to the progenitor. The pre-explosion SED has been compared with possible progenitor models in several previous articles, as described in Section 1. Here we revisit the progenitor nature using our own pre-explosion photometry and our revised distance and reddening (Section 2.1).
The absolute magnitudes of the progenitor object would be mag, mag, and mag. The uncertainties were derived by summing in quadrature those in apparent magnitude, extinction, and distance. Intrinsic colors would be mag and mag.
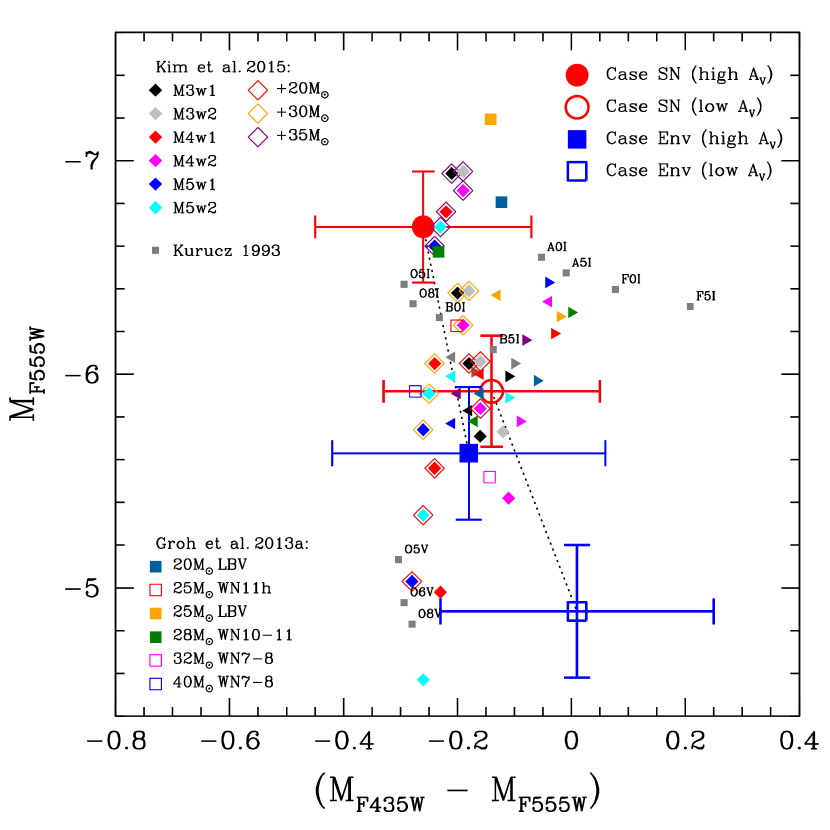
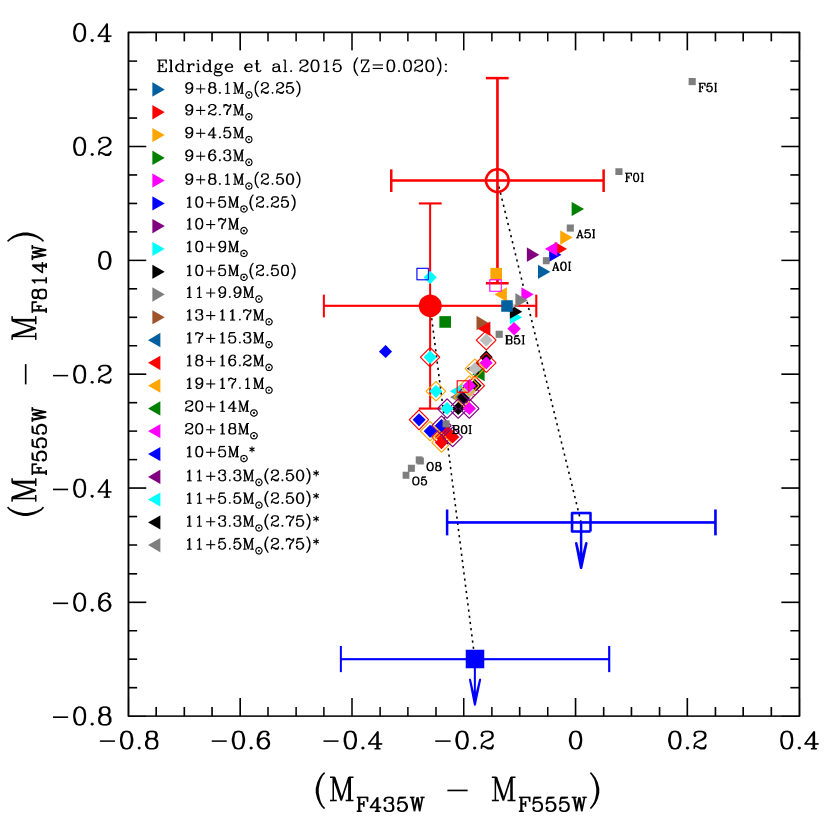
We compared the corrected photometry with available models of single and binary massive stars, as shown in the color-magnitude and color-color diagrams of Figure 3. The rotating models of 20 M⊙ and 28 M⊙ of Groh et al. (2013a) (green and blue triangles) are in good agreement with the data. The pre-SN objects predicted by these two models are a luminous blue variable (LBV) and a WR star of type WN10-11, respectively. Their respective final masses are 7.1 M⊙ and 10.8 M⊙. The mass of the latter object is inconsistent with the analysis of the early-time SN light curve. While the LBV model is marginally compatible with the light-curve analysis, its final structure contains significant amounts of hydrogen and would thus produce a Type IIL or IIb SN. We note, however, that there have been claims of the presence of H, albeit weak, in the spectrum of iPTF13bvn (Kuncarayakti et al., 2015; Reilly et al., 2016, although see Cao et al. 2013 and Srivastav et al. 2014).
We also compared with massive binary models published by Kim et al. (2015) and E15. Although E15 models with initial primary masses below 13 M⊙ produce faint companion stars in agreement with the constraint in F225W, those systems are slightly less luminous or redder than our pre-SN measurements. Only those models by Kim et al. (2015) that included the most massive companion star (35 M⊙) were able to account for the large optical luminosity. However, these companions would be too bright in F225W to comply with our detection limit. As shown in the right panel of Figure 2, only their least massive (20 M⊙) companion is allowed by our F225W constraint. We note that such would be the limit of the companion mass at the moment of the SN explosion. Binary evolution models have shown that accreting companions evolve upward in the Hertzprung-Russell diagram, remaining near the zero-age main sequence (ZAMS). However, deriving the initial binary configuration would require detailed evolutionary calculations that would only be justified once we confirm the nature of the source observed in 2015 with further observations.
For comparison, Figure 3 also shows the results with the shorter distance and lower extinction (see Section 2.1). The resulting values, indicated with “low ” in Figure 3, are mag, mag, and mag. The agreement with the models by Groh et al. (2013a) and Kim et al. (2015) is worse than with our preferred distance and extinction. Among the binary systems by E15, those with initial masses of 9&8.1 M⊙ (and ), and 10&7 M⊙ agree within of the low- photometry.
3.2. Case Env: The Environment
We now consider the case that the SN emission became negligible at 740 days. This requires removing the condition of full trapping of radioactive positrons and neglecting any contributions from possible weak interaction or light echo, or assuming much obscuration by dust. By linearly extrapolating the light curves from days, we find the SN flux would contribute % of the observed flux in F438W and F555W, and % in F814W. This would mean that the new observations revealed the SN environment. The 740 days SED is roughly compatible with an early-A type supergiant star or a young star cluster. At the distance of NGC 5806, the PSF radius comprises several parsecs; thus, the source may or may not be physically related to the SN progenitor. Our data rule out a bloated red supergiant companion star as proposed by Hirai & Yamada (2015); only their hottest companion (model c0.5) would be allowed.
Assuming no variability, the pre-SN minus post-SN images would reveal the progenitor object, the exploding star itself, devoid of any binary companion or associated population. The absolute magnitudes would be mag, mag, and mag. If we consider that up to 6% of the flux in F814W could be due to the SN, the progenitor would have mag. If we consider only the F435W and F555W bands, we can find compatible progenitor models (Figure 3, left panel). However, when including the limit in F814W (right panel), the resulting color of mag excludes all of the comparison models. Even if we adopted the shorter distance and lower extinction (Section 2.1), the color mag would still be beyond the range of known models, although close to the locus of O-type stars. At the same time, the color worsens. We conclude that the true nature of the progenitor is likely between the two cases, and closer to Case SN (Section 3.1) than to this other extreme.
4. CONCLUSIONS
Our new HST images reveal a decrease in flux relative to the pre-explosion source proposed as the progenitor of iPTF13bvn by Cao et al. (2013). Assuming this decrease is not caused by newly formed dust in the ejecta, it confirms the first progenitor identification of a SN Ib.
With the currently available information it is not possible to provide a definitive characterization of the progenitor. We present some evidence that the flux in the new images was mostly due to the fading SN. In fact, if we assume a negligible contribution from the SN, the derived progenitor color would be incompatible with known stellar models.
If what we detected was indeed the SN, then most of the pre-SN flux would be due to the progenitor. Previously proposed progenitor models, either single or binary, need to be revised to account for these new data. For binary progenitors, our detection limit in F225W constrains any hot companion to be less luminous than a late-O main-sequence star, with M⊙ at the moment of the SN explosion, assuming it is not heavily obscured by dust. Further observations are required to assess the exact contribution from the SN, and thus to disentangle the progenitor nature.
References
- Benvenuto et al. (2013) Benvenuto, O. G., Bersten, M. C., & Nomoto, K. 2013, ApJ, 762, 74
- Bersten et al. (2014) Bersten, M. C., Benvenuto, O. G., Folatelli, G., et al. 2014, AJ, 148, 68
- Bersten et al. (2012) Bersten, M. C., Benvenuto, O. G., Nomoto, K., et al. 2012, ApJ, 757, 31
- Cao et al. (2013) Cao, Y., Kasliwal, M. M., Arcavi, I., et al. 2013, ApJ, 775, L7
- Cardelli et al. (1989) Cardelli, J. A., Clayton, G. C., & Mathis, J .S. 1989, ApJ, 345, 245
- Dalcanton et al. (2009) Dalcanton, J. J., Williams, B. F., Seth, A. C., et al. 2009, ApJS, 183, 67
- Dessart et al. (2011) Dessart, L., Hillier, D. J., Livne, E., et al. 2011, MNRAS, 414, 2985
- Dolphin (2000) Dolphin, A. E. 2000, PASP, 112, 1383
- Drout et al. (2011) Drout, M. R., Soderberg, A. M., Gal-Yam, A., et al. 2011, ApJ, 741, 97
- Eldridge et al. (2015) Eldridge, J. J., Fraser, M., Maund, J. R., & Smartt, S. J. 2015, MNRAS, 446, 2689, E15
- Eldridge et al. (2013) Eldridge, J. J., Fraser, M., Smartt, S. J., Maund, J. R., & Crockett, R. M. 2013, MNRAS, 436, 774
- Eldridge & Maund (2016) Eldridge, J. J., & Maund, J. R. 2016, arXiv:1604.05050
- Ergon et al. (2015) Ergon, M., Jerkstrand, A., Sollerman, J., et al. 2015, A&A, 580, A142
- Ergon et al. (2014) Ergon, M., Sollerman, J., Fraser, M., et al. 2014, A&A, 562, A17
- Filippenko et al. (2001) Filippenko, A. V., Li, W. D., Treffers, R. R., & Modjaz, M. 2001, IAU Colloq. 183: Small Telescope Astronomy on Global Scales, 246, 121
- Folatelli et al. (2014) Folatelli, G., Bersten, M. C., Benvenuto, O. G., et al. 2014, ApJ, 793, L22
- Fremling et al. (2014) Fremling, C., Sollerman, J., Taddia, F., et al. 2014, A&A, 565, A114
- Ganeshalingam et al. (2010) Ganeshalingam, M., Li, W., Filippenko, A. V., et al. 2010, ApJS, 190, 418
- Groh et al. (2013b) Groh, J. H., Georgy, C., & Ekström, S. 2013, A&A, 558, L1
- Groh et al. (2013a) Groh, J. H., Meynet, G., Georgy, C., & Ekström, S. 2013, A&A, 558, A131
- Hachinger et al. (2012) Hachinger, S., Mazzali, P. A., Taubenberger, S., et al. 2012, MNRAS, 422, 70
- Harris (1990) Harris, W. E. 1990, PASP, 102, 949
- Heger et al. (2003) Heger, A., Fryer, C. L., Woosley, S. E., Langer, N., & Hartmann, D. H. 2003, ApJ, 591, 288
- Hirai & Yamada (2015) Hirai, R., & Yamada, S. 2015, ApJ, 805, 170
- Jerkstrand et al. (2015) Jerkstrand, A., Ergon, M., Smartt, S. J., et al. 2015, A&A, 573, A12
- Kim et al. (2015) Kim, H.-J., Yoon, S.-C., & Koo, B.-C. 2015, ApJ, 809, 131
- Kuncarayakti et al. (2015) Kuncarayakti, H., Maeda, K., Bersten, M. C., et al. 2015, A&A, 579, A95
- Kurucz (1993) Kurucz, R. 1993, ATLAS9 Stellar Atmosphere Programs and 2 km/s grid. Kurucz CD-ROM No. 13. Cambridge, Mass.: Smithsonian Astrophysical Observatory, 1993, 13
- Liu et al. (2015) Liu, Z.-W., Tauris, T. M., Röpke, F. K., et al. 2015, A&A, 584, A11
- Maeda et al. (2014) Maeda, K., Katsuda, S., Bamba, A., Terada, Y., & Fukazawa, Y. 2014, ApJ, 785, 95
- Maeda et al. (2003) Maeda, K., Mazzali, P. A., Deng, J., et al. 2003, ApJ, 593, 931
- Maund et al. (2015) Maund, J. R., Arcavi, I., Ergon, M., et al. 2015, MNRAS, 454, 2580
- Phillips et al. (2013) Phillips, M. M., Simon, J. D., Morrell, N., et al. 2013, ApJ, 779, 38
- Podsiadlowski et al. (1992) Podsiadlowski, P., Joss, P. C., & Hsu, J. J. L. 1992, ApJ, 391, 246
- Poznanski et al. (2012) Poznanski, D., Prochaska, J. X., & Bloom, J. S. 2012, MNRAS, 426, 1465
- Reilly et al. (2016) Reilly, E., Maund, J. R., Baade, D., et al. 2016, MNRAS, 457, 288
- Schlafly & Finkbeiner (2011) Schlafly, E. F., & Finkbeiner, D. P. 2011, ApJ, 737, 103
- Shigeyama et al. (1990) Shigeyama, T., Nomoto, K., Tsujimoto, T., & Hashimoto, M.-A. 1990, ApJ, 361, L23
- Smith et al. (2011) Smith, N., Li, W., Filippenko, A. V., & Chornock, R. 2011, MNRAS, 412, 1522
- Srivastav et al. (2014) Srivastav, S., Anupama, G. C., & Sahu, D. K. 2014, MNRAS, 445, 1932
- Stetson (1987) Stetson, P. B. 1987, PASP, 99, 191
- Van Dyk et al. (2013) Van Dyk, S. D., Zheng, W., Clubb, K. I., et al. 2013, ApJ, 772, L32
- Zhang et al. (2004) Zhang, T., Wang, X., Zhou, X., et al. 2004, AJ, 128, 1857