The Demographics of galactic bulges in the SDSS database
Abstract
We present a new database of our two-dimensional bulge-disk decompositions for 14,233 galaxies drawn from SDSS DR12 in order to examine the properties of bulges residing in the local universe (). We performed decompositions in and bands by utilizing the galfit software. The bulge colors and bulge-to-total ratios are found to be sensitive to the details in the decomposition technique, and hence we hereby provide full details of our method. The colors of bulges derived are almost constantly red regardless of bulge size except for the bulges in the low bulge-to-total ratio galaxies (). Bulges exhibit similar scaling relations to those followed by elliptical galaxies, but the bulges in galaxies with lower bulge-to-total ratios clearly show a gradually larger departure in slope from the elliptical galaxy sequence. The scatters around the scaling relations are also larger for the bulges in galaxies with lower bulge-to-total ratios. Both the departure in slopes and larger scatters are likely originated from the presence of young stars. The bulges in galaxies with low bulge-to-total ratios show signs of a frosting of young stars so substantial that their luminosity-weighted Balmer-line ages are as small as 1 Gyr in some cases. While bulges seem largely similar in optical properties to elliptical galaxies, they do show clear and systematic departures as a function of bulge-to-total ratio. The stellar properties and perhaps associated formation processes of bulges seem much more diverse than those of elliptical galaxies.
Subject headings:
galaxies: bulges — galaxies: elliptical and lenticular, cD — galaxies: evolution — galaxies: spiral — galaxies: stellar content — galaxies: structure1. Introduction
The stellar bulges of disk galaxies are thought to be a complex mix of heterogeneous stellar populations, spanning a large range of age and chemical composition. Yet they show surprising similarities to elliptical galaxies.
In the modern cosmological framework, massive elliptical galaxies are thought to have formed through numerous mergers and interactions between smaller galaxies (Toomre & Toomre 1972; White & Rees 1978). Significant mergers are suspected to have happened more frequently in the earlier universe (say, ) and thus their stellar properties are rather uniformly old and metal-rich. Their dramatic evolution progressively changed their kinematic properties toward more chaotic orbits. These probably are the background for the tight scaling relations found for the stellar properties of elliptical galaxies, such as Faber-Jackson relation (Faber & Jackson 1976), color-magnitude relation (Baum 1959; Bower et al. 1992), black hole-bulge mass relation (Kim et al. 2008; Kormendy & Ho 2013), and the fundamental plane (Dressler 1987; Djorgovski & Davis 1987). While the details are still debated, the community generally agrees on the early formation of massive elliptical galaxies (Cowie et al. 1996; De Lucia et al. 2006; Lee & Yi 2013).
Would the similarities between bulges and elliptical galaxies then suggest similar formation history? This has been the main question in numerous previous investigations (Kormendy & Illingworth 1982; Bender et al. 1993; Peletier et al. 1999; Proctor & Sansom 2002; Falcón-Barroso et al. 2002; Gadotti 2009). Some studies indeed found evidence that bulges and ellipticals share very similar stellar properties based on stellar population analyses (Fisher et al. 1996; Jablonka et al. 1996; Falcón-Barroso et al. 2002). However, bulges may have wider varieties in their properties. For example, the presence of “fake” bulges, also known as pseudobulges (Carollo 1999; Kormendy & Kennicutt 2004), and boxy/peanut bulges seems clear (Athanassoula 2016).
The relative size of bulge compared to the disk is known to correlate with galaxy morphology (Kent 1985; Simien & de Vaucouleurs 1986; Hudson et al. 2010). However it is not trivial to explain why this is so. The similarity of the stellar bulge of a large Sa and a large elliptical galaxies may be easier to accept, but it is less clear why the small bulge of an Sd galaxy should share the same trends of stellar and kinematic properties as large ellipticals.
In this study, we investigate the properties of a large sample of bulges from the SDSS DR12 main galaxy sample, in the hope of answering some of these questions. We decompose the galaxies into bulge and disk components using the public tool galfit (Peng et al. 2010). Comprehensive studies, with similar goals, using similar tools, conducted on similar samples, have been performed previously (Allen et al. 2006; Benson et al. 2007; Gadotti 2009; Simard et al. 2011; Lackner & Gunn 2012; Kelvin et al. 2012; Meert et al. 2015). However, in some sense decomposition is often more art than science, and it is not all that clear how different studies derived their measurements. We perform our own decompositions and, unlike in many previous studies, we present the details of the input parameters and conditions in the decomposition routine so that future comparisons can be made. We describe a recipe for choosing the initial guess values of parameters, based on galaxy colour, and demonstrate its effectiveness.
Our bulge-to-total ratios correlate reasonably well with concentration index and Hubble type, but they correlate with Sérsic index more weakly, likely due to large uncertainties on Sérsic index measurements. We inspect the properties of bulges of galaxies as a function of bulge-to-total ratio. This effectively links spirals, lenticulars, and ellipticals into a long sequence of increasing . We find that some bulges have very similar properties to ellipticals, while others differ in the slope, intercept, and scatter of scaling relations. We attempt to interpret these differences as a result of minor differences in the properties of stellar population, and to infer implications for the bulge formation.
We adopt the CDM cosmology of (, , ) = (70, 0.3, 0.7).
2. Sample Selection
Our sample of galaxies is drawn from the Sloan Digital Sky Survey Data Release 12 (York et al. 2000; Alam et al. 2015). We obtain basic observational parameters such as magnitude, angular size, b/a ratio of galaxies from CasJobs provided in DR12. We also employ the OSSY catalog (Oh et al. 2011, hereafter OSSY) for spectroscopic information. This provides improved spectral measurements on the SDSS DR7 galaxies by utilizing GANDALF (Gas AND Absorption Line Fitting) and pPXF (penalized pixel-fitting) codes (Cappellari & Emsellem 2004; Sarzi et al. 2006; Oh et al. 2011).
We conduct all bulge and disk decompositions in the filters and . To achieve a more reliable decomposition, we perform our task only on close, apparently-large, and relatively face-on galaxies. After these selections 14,233 galaxies remained. We applied a volume limitation condition of , which corresponds to the SDSS limiting apparent magnitude of at , to this database. The OSSY catalog provides spectroscopic measurements on 10,240 of these. The details of our initial selection criteria are given in Table 1.
| Criterion | Explanation |
|---|---|
| Redshift limit | |
| a ” | The minimum angular size |
| of galaxy | |
| b | Exclude severely edge-on galaxies |
| Relative error of angular size | |
| Volume-limitation | |
| OSSY catalog | Cross-match for |
| spectroscopic information |
-
a
SDSS Petrosian radius in band
-
b
SDSS exponential fit apparent axis ratio in band
3. Data Analysis
3.1. Two-dimensional Bulge - Disk Decompositions
We performed two-dimensional bulge-disk decomposition in and bands by adopting the standard Sérsic and the exponential light profiles for the bulge and the disk, respectively (Sérsic 1968; Freeman 1970). This combination has been suggested to be most suited to an automated and uniform decomposition on a large sample of galaxies (Meert et al. 2013). We take the Sérsic index as a free parameter. The seeing of the SDSS (the median values of point spread function full width at half-maximum in band are ) is probably not good enough to provide reliable values of Sérsic index; but we thought it would still be better to have the index free instead of fixed because it could be useful for characterizing the type of bulge (i.e. pseudobulges and classical bulges) at least on more trustworthy cases.
The Sérsic light profile is described as follows (Sérsic 1968):
| (1) |
where is the surface brightness at a distance from the center of a galaxy, is the effective radius which is defined such that half of the total light of a galaxy is contained within the effective radius, is the surface brightness at the effective radius, and is the Sérsic index which shapes the light profile of a galaxy. We adopt the following expression of from Capaccioli (1989):
| (2) |
To take advantage of having spatial information such as ellipticity and position angle, we used the two-dimensional decomposition technique (Byun & Freeman 1995). We utilize galfit (version 3.0.5) for our two-dimensional galaxy decompositions (Peng et al. 2002, 2010). Basically, galfit adopts the Levenberg-Marquardt algorithm which is based on the least square minimization technique. Further details on the fitting algorithm and usage of galfit are described in Peng et al. (2002, 2010). A comparison study of galfit and another widely-used piece of software gim2d is conducted in Häussler et al. (2007).
The galfit software requires four kinds of input image files for decomposition: 1) observation image, 2) background noise image (a.k.a. image). 3) PSF image, and 4) masking image to remove neighboring galaxies and foreground stars. The observation images of sample galaxies are drawn from SDSS DR12 Science Archive Server; specifically, we use the calibrated and sky-subtracted frame fits images. The images are internally generated in galfit with essential information such as exposure time, gain, readout noise, and the number of combined fits from the fits header. The PSF images are generated by utilizing SDSS readAtlasImages-5411. The SExtractor version 2.8.6 (Bertin & Arnouts 1996) was used to identify all objects in given observational images and to generate masking images for our sample galaxies.
| Parameter | Initial guess | Constraint Range | |
|---|---|---|---|
| a | |||
| Bulge | |||
| x / y center | b and c | pix and pix | |
| Magnitude | Petromagrd | Petromag | Petromag |
| Effective radius | 10 pix | 5 pix | 3 pix to pix |
| Sérsic index | 4 | 1 | 1 to 8 |
| Apparent axis ratio | e | 0.3 to 1.0 | |
| Position Angle | f | ||
| Disk | |||
| x / y center | Fixed to be same as those of bulge | ||
| Magnitude | Petromag | Petromagr | Petromag |
| Scale length | 5 pix | 12 pix | 5 pix to pix |
| Inclination | g | ||
| Position Angle | h | degrees | |
-
a
galaxy color
-
b
SDSS right accession of galaxy
-
c
SDSS declination of galaxy
-
d
SDSS Petrosian magnitude in band
-
e
de Vaucouleurs fit apparent axis ratio in band
-
f
de Vaucouleurs fit position angle in band
-
g
Exponential fit apparent axis ratio in band
-
h
Exponential fit position angle in band
Inserting these four input images into galfit, we performed bulge - disk decompositions. We chose the initial guesses of bulge and disk components based on the SDSS observation quantities such as , , , , , , , , and . As mentioned in other previous studies, the ‘mathematical’ best fit does not always guarantee a solution that is physical (Peng et al. 2010; Meert et al. 2015). We try to tackle this limitation by adopting initial guesses and fitting constraint ranges that are astrophysically motivated. There are numerous studies which discuss effects of initial guesses on the results of fits (Broeils & Courteau 1997; MacArthur et al. 2003; Gadotti 2009; Weinzirl et al. 2009; Fisher & Drory 2010; Fernández Lorenzo et al. 2014). After some experimentation, we found that the color is the most effective galaxy property for deciding initial guesses. This works well simply because is a reasonable morphology indicator.111The referee pointed out that can be similarly effective. We confirm that a criterion leads to a virtually identical result. Our initial guesses and constraint ranges are given in Table 2.
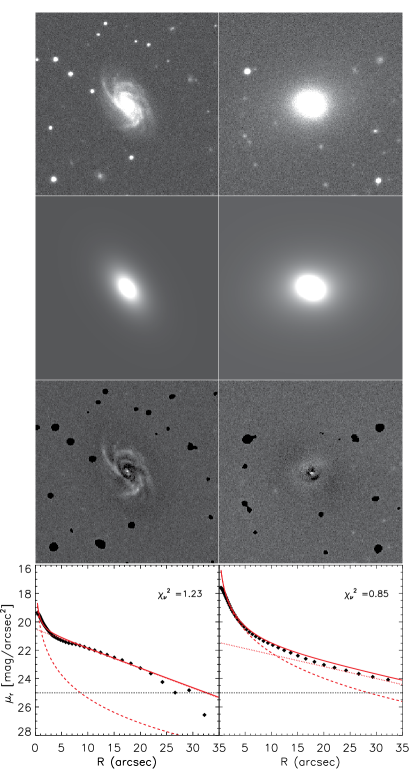

Two examples of the resulting bulge-disk decompositions are shown in Fig. 1. We first performed the decomposition in band as described above. We then applied this result to the -band decomposition by fixing all the fitting parameters except for the positions of centers and the bulge and disk magnitudes. This “simultaneous fitting” technique has been reported to minimize the errors of fits (Simard et al. 2002, 2011) and is widely used (e.g., Simard et al. 2011; Lackner & Gunn 2012; Meert et al. 2015). We confirm this through a test on sample galaxies. A drawback of this technique, on the other hand, is that color gradients cannot be measured using this method. Hence, we do not discuss color gradients further in this study. For the bulge fit, we explored the whole range of down to the index of exponential disks (1.0).
We note that there are some recent findings (e.g., Erwin et al. (2015)) on low mass hot classical-like bulges having , so that some bulges in our sample galaxies might possibly have the intrinsic Sérsic index less than 1222This was kindly pointed out by the referee.. However, following the classical definition of a bulge component as a centrally compact stellar region of a galaxy, we adopted a bulge Sérsic index range of . Therefore, our bulge component has a steeper light profile than the exponential disk component. We confirm that permitting a Sérsic index range with lower than 1 has negligible impact on our results throughout the paper.
3.2. Quality Estimation of Fits
Here we discuss the quality of our fits based on the measurement. The value of reflects the goodness of fits, but a small value does not always guarantee a physically-sound fit (Meert et al. 2015). The reduced chi-squared () distribution of our decompositions is shown in Fig. 2-(a). The peak value is around 1.1, and the distribution shows a gradual decrease from the peak on both sides. We inspected some galaxies with or : that is, their color-composite images, model and residual images of decompositions, and one-dimensional radial profiles. The majority of galaxies having a small are red early-type galaxies. This is caused by the fact that their relatively simple structure is fitted tightly already with one component (bulge) and an additional component (i.e., disk) is largely unnecessary. On the other hand, those with a large value of are complex systems that are poorly fitted by just a disk and bulge mix. Examples include interacting galaxies and late-type galaxies with prominent features such as spiral arms, rings, or bars. Among the poor- galaxies were some featureless galaxies, those with strong dust extinction, and those where SDSS pointing fails to find the center of the galaxies. We removed 264 galaxies which have as we consider them poor fits, leaving 9,976 galaxies behind.
Fig. 2-(b) shows the distribution of the Sérsic index of bulges. More than 30 percent of bulges have low values (). This roughly agrees with the late-type galaxy fraction found in the local universe (Oh et al. 2013; Khim et al. 2015). There is another peak at . Their mean value of is 1.24 and not very different from the rest of the sample. Their mean is 0.15. We inspected the images of these objects and found that the fit is not particularly poorer than the rest of the sample. Instead we found a point-like source in the galaxy center. Indeed, Weinzirl et al. (2009) pointed this out earlier and used a third point-like component at the center in addition to disk and bulge. In our study, we adopted the two-component decomposition technique and thus the presence of this peak may at least partly be a result of the shortcoming of our two-component approach. We will discuss the reliability of measurements in Section 4.2 in more detail.
3.3. Comparison with the Literature
We compare our results with Simard et al. (2011, hereafter S11) and Meert et al. (2015, hereafter M15) because they too used the same fitting functions as ours: a free Sérsic function for the bulge component and an exponential disk. Cross-matching with S11 and M15 resulted in 11,384 and 11,345 galaxies, respectively.
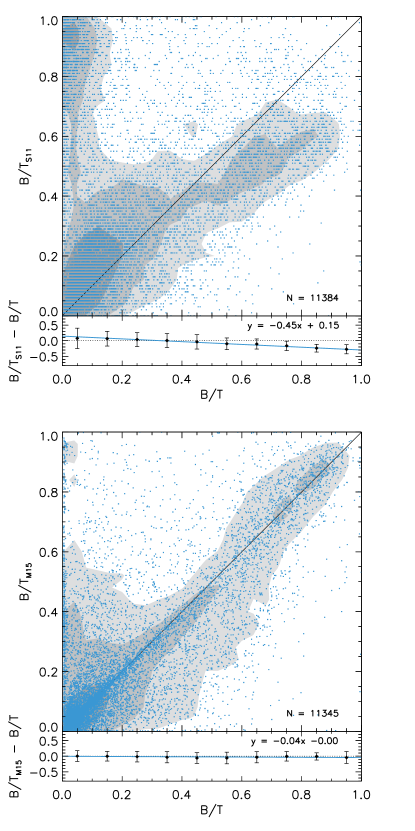
Fig.3 shows the comparison between the databases in terms of , the most important parameter we aim to derive in this study. The agreement is substantially better with M15 (bottom panel) which is at least partially due to the fact that we use the same decomposition software galfit as M15, while S11 used gim2d, and it has been shown that different fitting algorithms often indicate different values of structural parameters (Häussler et al. 2007; Gadotti 2009; Simard et al. 2011; Meert et al. 2015).
Agreement is generally better for bulge-dominant galaxies in both cases. The poorest agreement is found on small galaxies and between S11 and us. For example, there are many galaxies for which S11 derived a much higher value of than us (the vertical band of points at in the top panel of Fig. 3). We inspected their images and fits individually and found that our fits were generally more trustworthy. But, more importantly, we would like to emphasize the fact that it is very difficult to measure on disk-dominant galaxies using the techniques that are widely used today especially on the observational data of SDSS quality. We could not pin down the source of differences between studies because details of the parameters used for decompositions in previous databases are not explicitly given. It is our hope that giving full details of our fitting procedure and parameters will make future comparison more feasible.
4. Results
4.1. Optical Colors of Bulges
The color of a galaxy provides information on the age, metallicity of constituent stellar populations and internal dust extinction. It is thus interesting to check if the colors of bulges we derive here show any trend and to see how such trends can be interpreted. An accurate derivation of the colors of bulges requires reliable measurements of in the associated bands. We present bulge colors against in Fig. 4-(c). By and large, the bulge colors are measured to be uniformly red within errors.
The bulge colors of disk-dominated () galaxies are noteworthy. Their median colors are similar to the rest of the sample but with a much larger scatter. There are quite a few bulges that are unusually blue (e.g., ) for a bulge. Their composite images show blue colors consistently, and if our decomposition is reliable, it would mean that some bulges of the low galaxies are indeed of notably different stellar properties from the rest of the sample.
There also are a large number of excessively red bulges at . Note that the typical color of the largest bulges is (Fig. 4-(c)). It is consistent with the mean color of elliptical galaxies that contain a negligible amount of dust. If bulges are similarly devoid of dust, their extremely red colors in the lowest bin are difficult to understand. Even if we adopt an unexpectedly large value of dust extinction of , a population similarly old and metal-rich to the bulges in the large galaxies only become as red as . In Fig. 4-(c), there is a long tail toward red colors, extending vertically beyond the limits of the figure, with some bulge colors derived to be as red as !. These bulge colors do not appear astrophysically plausible. This has been noted previously by other studies (Mendel et al. 2014; Fernández Lorenzo et al. 2014).
However excessively red bulge colors derived from decomposition can be explained. The excessively red colors of bulges are likely caused by a methodological limitation. Importantly, the logarithmic ratio of values in the associated bands is employed in the derivation of bulge color from galaxy color. The bulge color, , is calculated as follows:
| (3) | |||||
where and are and -band magnitudes of bulge, and are and -band magnitudes of galaxy, and and are and -band bulge to total ratio, respectively. As shown in Equation 3, bulge color is derived from galaxy color (Fig. 4-(a)) and the ratio between the values of in and bands (Fig. 4-(b)). The large ratios of the small galaxies in panel are the cause of the red tail in the small galaxies in panel .
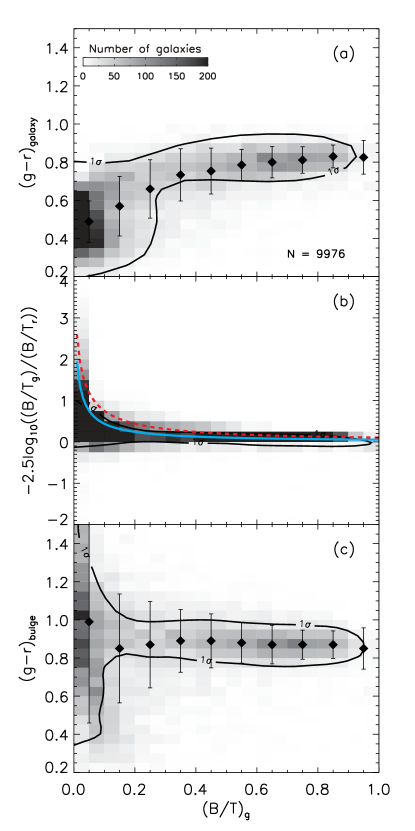
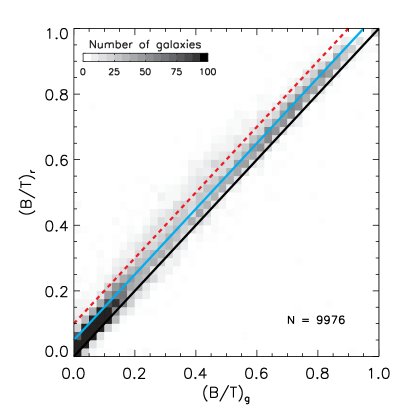
Figure 5 shows the comparison between the values measured in and bands. The agreement looks good from a cursory inspection, but the ratio between them, as appears in Equation 3, can be dramatically large especially in small galaxies. For example, if we assume that the typical difference in between and bands is , that translates to and 0.07 for the galaxies of and 0.8, respectively. More dramatic cases () can be easily found simply by looking further into the details of Figure 5. In conclusion, the excessively red colors of bulges derived in our decompositions and other studies probably do not reflect the real astrophysical properties of bulges but instead a shortcoming of the methodology which is currently widespread. Small differences in measured in different wavelengths can result in significant bulge color reddening as becomes small. We have thus decided to remove 3,956 galaxies with out of 9,976, leaving only 6,020 galaxies for our further analysis.
4.2. Bulge to total ratio and galaxy morphology
The relative size of the bulge component in a galaxy has been known to correlate with the morphology of its host galaxy in the sense that the value of becomes larger as galaxy morphology moves from late to early types (Hubble 1926, 1936; Kent 1985; Simien & de Vaucouleurs 1986; Hudson et al. 2010). As a sanity check, we compare our values against galaxy morphology and other morphology indicators (concentration index, the Sérsic index, and velocity dispersion) in Fig. 6. The concentration index used here is defined as adopting SDSS Petrosian radii. Galaxy morphology information is from Khim et al. (2015) who performed visual morphology classification on nearby () SDSS DR7 galaxies. The Sérsic indices shown are those derived from our decomposition.
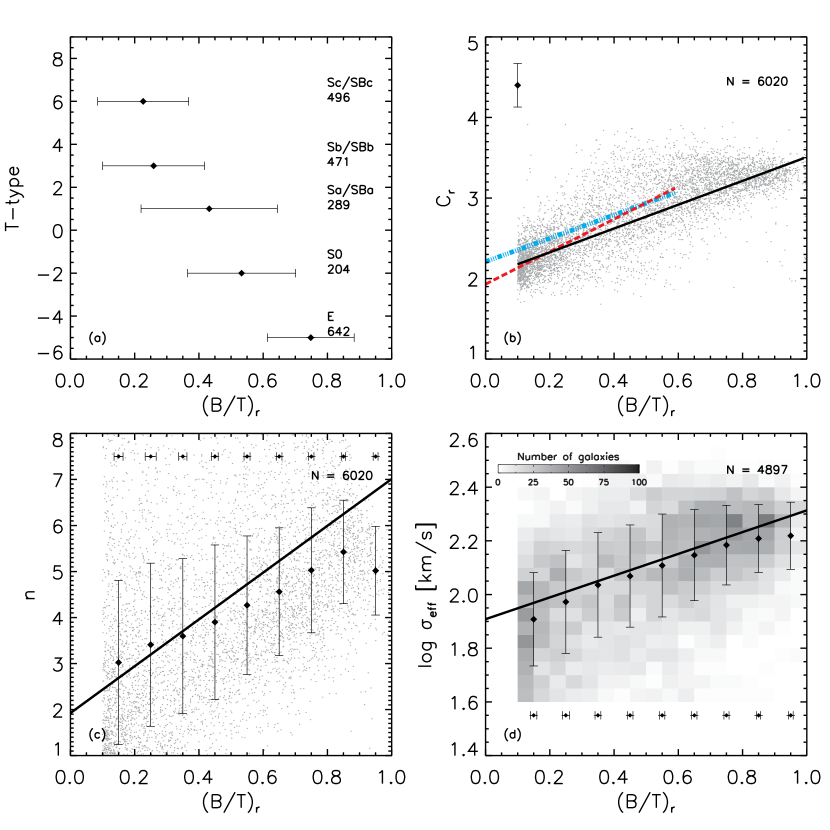
The ratio indeed correlates well with morphology (Fig. 6, panel a). Although there is a fairly large scatter, the trend is clear. We note that the of late type spirals (e.g. at ) is somewhat overestimated because we excluded low galaxies ().
The correlation with concentration index (panel b) is also reasonably clear (the Pearson correlation coefficient is for galaxies with ), as recently confirmed on similar samples (Gadotti 2009; Lackner & Gunn 2012). We derived a linear fit (solid line) to the sample with for which decomposition seems more reliable and the resulting linear fit is as follows:
| (4) |
For comparison, the fits of earlier studies (Gadotti 2009; Lackner & Gunn 2012) are also shown in the Figure.
The panel shows the comparison against the Sérsic index of the bulge component. The solid line shows the least square linear fit. The Pearson correlation coefficient is 0.30 and thus the correlation is not strong, but the trend is as expected. It is very difficult to accurately measure the Sérsic index from two-component decomposition on SDSS-quality images. For example, the poor point spread function of the SDSS data causes to be measured lower than true, while lacking a point-like source at the galactic center in the decomposition procedure tends to result in a higher value of than true. But it might also imply that a larger bulge does not strictly mean a larger value of of the .
Morphology is known to correlate with velocity dispersion, too (e.g., Oh et al. 2013; Khim et al. 2015). Naturally, a positive correlation between and velocity dispersion has been reported (e.g., Hudson et al. 2010). We show our result in panel . We employ the velocity dispersion from the OSSY catalog and apply the aperture correction for the bulge circular effective radius following Cappellari et al. (2006) which derived the aperture-correction relation based on a luminosity-weighted spectra. We chose only galaxies with and to ensure a good quality of velocity dispersion measurement. This cut in velocity dispersion and associated error removes 19% (1123 out of 6020 galaxies) of our sample. The removal fraction is larger for galaxies with smaller values of : 39% for , 16% for , 4% for , 0.9% for . A positive but weak correlation between the two parameters is found, which agrees well with the result on the cluster galaxy sample of Hudson et al. (2010).
Compared to classical bulges, pseudobulges are in general said to have lower values of velocity dispersion (Kormendy & Kennicutt 2004; Kormendy 2015). Recently, Fabricius et al. (2012) suggested that they generally have . This corresponds to based on the fit found from our sample. This issue will be revisited in Section 4.4.
The ratios derived from our decomposition appear to be sensible. This indirectly demonstrates that our scheme for choosing the initial guess parameters, and their boundaries for decomposition, was effective. All in all, it indeed seems possible to describe the whole Hubble sequence as a single sequence of .
4.3. Color-Magnitude Diagram
The Color-Magnitude Diagram (CMD) has been widely used to study the formation and evolution of galaxies (e.g., Sandage & Visvanathan 1978; Bower et al. 1992; Strateva et al. 2001; Blanton et al. 2003; Driver et al. 2006). We now inspect the bulge properties in the CMD in the hope of finding some clues to their formation.
Fig. 7 shows the CMD of our sample. Panel shows the galaxy properties. Contours present the distribution of galaxies split into groups based on . Note that the 1 contours gradually shift from the blue cloud to the red sequence with increasing . Wide varieties of are present in the red sequence region. On the other hand, blue cloud galaxies () almost exclusively have low values of .
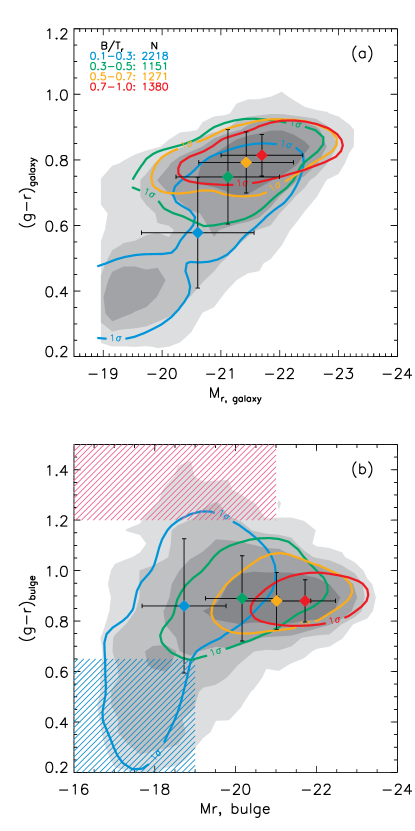
Panel shows the CMD for the bulges. Bulge colors are consistently red regardless of and bulge luminosity. The simplest explanation for this is that bulges are essentially of similar stellar populations, although the age-metallicity degeneracy on optical colors (Worthey 1994; Yi 2003; Johnston et al. 2012, 2014) must also be remembered. If we take the median values (as shown in this figure) bulges are slightly redder than the integrated light of the galaxies (panel ). This is expected as decomposition removes the (generally blue) disk component from the bulge light in most galaxies.
There is a larger scatter in color among the bulges in the lower galaxies. In the lowest bin, the extremely red bulge colors (red hatched region on the top) can be interpreted in the same manner as discussed in Section 4.1 (unphysical values originated from the shortcoming of the decomposition technique). The scatter on the blue side (blue hatched region in the bottom) however appears to have physical origins. Visual inspection of their optical images suggests the presence of blue star forming regions.
When we check the emission line properties of the galaxies within the blue dash-line box using the SDSS-fiber spectroscopic data, 88% (491 galaxies out of 557 galaxies) of them are classified as actively star forming galaxies based on the diagnostics proposed by Baldwin et al. (1981) (e.g. the BPT diagram). For comparison, only 44% of the redder () bulges in the same bin are classified as star forming galaxies. Admittedly, the 3” diameter SDSS fiber collects light from both bulge and disk components, but it is still useful to check the relative significance of star formation between red and blue bulges.
4.4. Scaling Relations
We present the bulge properties in various scaling relations in this section and compare them with those of elliptical galaxies.
4.4.1 Kormendy Relation
The Kormendy scaling relation has been used to study the structural parameters of both ellipticals and spiral bulges (Kormendy 1977; Bernardi et al. 2003a; La Barbera et al. 2003; Gadotti 2009; Fisher & Drory 2010). Specifically, it shows the relation between the effevtive surface brightness and effective radius for the bulges in our sample, binned by , as shown in Fig. 8. The fitting coefficients are given in Table 3. The dashed line shows the maximum likelihood of the Kormendy relation suggested for early-type galaxies by Bernardi et al. (2003b). The bulges in the highest galaxies () closely overlap with the relation derived for early-type galaxies. But the departure becomes larger for the bulges in smaller galaxies. This trend implies that the bulges in lower galaxies have a lower stellar density for any given effective radius.
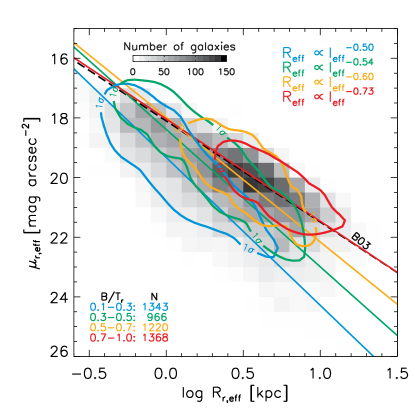
“Exponential” bulges are often considered as a product of secular evolution of bar or disk structure (Carollo 1999; Kormendy & Kennicutt 2004). Specifically, Carollo (1999) reported that the mean surface brightness of their exponential bulges are significantly fainter than those of “classical” bulges. The bulges in our low galaxies () seem to be consistent with their exponential bulges, while most of the bulges in our high () galaxies seem more comparable to classical bulges. Intermediate bulges lie smoothly in between. This all naturally leads to the possibility that bulges have different formation mechanisms depending on their relative size (Silk & Bouwens 1999; Carollo 1999; Kormendy & Kennicutt 2004; Fisher & Drory 2010; Fernández Lorenzo et al. 2014)
4.4.2 Faber-Jackson Relation
We now inspect if bulges follow the same Faber-Jackson relation (Faber & Jackson 1976) as early-type galaxies. Fig. 9 shows our bulges in comparison with the relation found for early-type galaxies by Bernardi et al. (2003b). We fit the bulge properties in this plane ( vs. ) using a linear fit and transform it into the relation. The fits are given in Table 3.
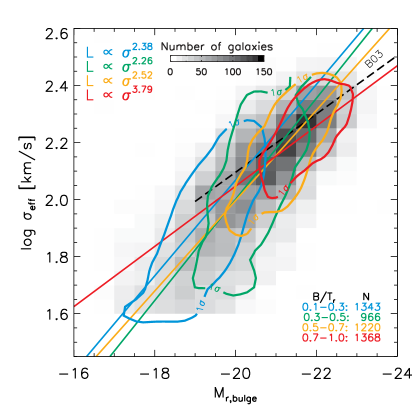
When all the bulges are used, we find a reasonably tight correlation but with a slope (3.01) that is much shallower than that of early-type galaxies. The bulges in the highest galaxies (red contour) seem to be in reasonable agreement with early-type galaxies: the slope in our sample is 3.79 and that of early-type galaxies is 3.92. However, the bulges in lower galaxies gradually show larger departure from the early-type galaxy sequence. This trend does not seem to be caused by the inclination effects. We checked the relation between the apparent axis ratio of galaxy and the central velocity dispersion in low galaxies () and found no significant trend.
The gradual displacement with decreasing from the early-type sequence is clearly visible. Note that many of the bulges in the small galaxies were removed from this diagram because their velocity dispersion was measured to be too small compared to the measurement uncertainty, as mentioned in Section 4.2. If we could measure their velocity dispersions accurately and include them in this analysis, the true trend would likely be even more dramatic. This trend’s slope is often interpreted as a result of decreasing mass-to-light ratio (e.g., Kormendy & Kennicutt 2004). The bulges in the lowest galaxies have properties consistent with those of pseudobulges (Kormendy & Kennicutt 2004, see their Fig.18). The star formation in the bulges of our low galaxies seems to have been persistent, because otherwise a simple fading (by aging) of the stellar population would bring them closer to the early-type sequence quickly, while we do not see such faint bulges in the low velocity dispersion () regions. Star formation in larger bulges seems to have ceased earlier. This finding is consistent with what we discussed on the Kormendy relation in the previous section.
The departure from the early-type sequence of the bulges for low galaxies can also be explained by differences in kinematic structure. For a given bulge luminosity (e.g., ) lower bulges have a lower velocity dispersion than what is expected from the early-type relation. This is possible if the bulges in the low galaxies are more dominated by (disky) ordered motions (Kormendy & Illingworth 1982; Kormendy & Kennicutt 2004). Mergers likely disrupt the previous momentum of merging systems and thus increase the velocity dispersion. Small bulges will grow in mass and velocity dispersion through mergers, eventually populating in the region that is occupied by the bulges in the highest galaxies, in a similar way suggested for galaxies (Desroches et al. 2007; Bernardi et al. 2011; Montero-Dorta et al. 2015).
| range | Kormendya | Faber-Jacksonb |
|---|---|---|
| B03c |
-
a
The exponent n of the Kormendy relation:
-
b
The exponent n of the Faber-Jackson relation:
-
c
The fitting exponents of the Kormendy and Faber-Jackson relations from Bernardi et al. (2003b), respectively.
4.4.3 The Fundamental Plane
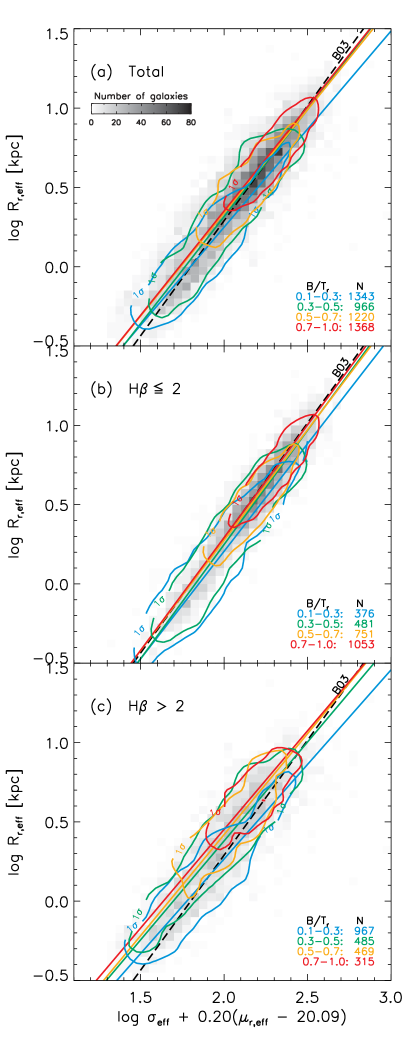
Elliptical galaxies exhibit a tight sequence in the fundamental plane (Dressler 1987; Djorgovski & Davis 1987, hereafter FP), and it is generally attributed to the state of dynamical equilibrium and relatively constant stellar properties. We hereby check if bulges follow the same trend.
The FP of our bulges is shown in Fig. 10. The reference line for SDSS early-type galaxies is adopted from Bernardi et al. (2003c). The fitting coefficients are given in Table 4. Bulges exhibit a FP that is very close to that of early-type galaxies. The bulges in the higher galaxies are naturally larger in size and faster in random motion. The impact of does not appear to be obvious at least in terms of the slope.
| range | Totala | Ha | Ha | ||||||||||||
|---|---|---|---|---|---|---|---|---|---|---|---|---|---|---|---|
| b | b | b | |||||||||||||
| 1.24 | 0.02 | -2.22 | 0.04 | 0.10 | 1.36 | 0.04 | -2.51 | 0.08 | 0.07 | 1.19 | 0.02 | -2.12 | 0.04 | 0.10 | |
| 1.35 | 0.02 | -2.38 | 0.05 | 0.09 | 1.44 | 0.03 | -2.63 | 0.05 | 0.07 | 1.25 | 0.03 | -2.12 | 0.06 | 0.09 | |
| 1.30 | 0.02 | -2.26 | 0.05 | 0.08 | 1.39 | 0.03 | -2.51 | 0.06 | 0.06 | 1.27 | 0.04 | -2.13 | 0.08 | 0.09 | |
| 1.31 | 0.02 | -2.28 | 0.05 | 0.07 | 1.42 | 0.02 | -2.55 | 0.05 | 0.06 | 1.24 | 0.06 | -2.04 | 0.13 | 0.09 | |
| B03c | 1.45 | 0.05 | -2.61 | 0.08 | 0.05 | ||||||||||
-
a
The orthogonal fitting slope and intercept (a,b) of the following edge-on view FP:
-
b
The scatter orthogonal to the plane.
-
c
The orthogonal fitting slope, intercept of Bernardi et al. (2003c) for their early-type galaxies in case of Evolution Selection Effects, and the scatter.
We divide the sample by the absorption line strength of which is known to be sensitive to the presence of young stars (Trager et al. 2000) and thus widely used as a tracer of recent star formation(e.g., Proctor & Sansom 2002). As a simple choice, we use a cut of 2Å. Stellar populations of are generally assumed to be dominantly composed of old stars (Trager et al. 2000).
Panels and show the subsamples of low and high values of H. The low-Hsample shows a slope that is closer to the FP of early-type galaxies, with a smaller RMS scatters (see Table 4). A large fraction (1804 out of 2661, 68%) of them are in a bulge dominant () galaxies. For comparison, this fraction becomes much lower (32%) in the disk-dominant () galaxies. This strongly suggests that the “tilt” and scatter in the FP are at least partially originating from the presence of young stars, or the detailed star formation episodes in the recent history. This conclusion on is qualitatively consistent with what has been suggested earlier on (Forbes et al. 1998; Choi et al. 2009; Graves et al. 2009; Jeong et al. 2009; Suh et al. 2010; Springob et al. 2012).
5. Discussion on spectral line properties
We found in the previous section that bulges belonging to galaxies with smaller show a gradually larger departure from the early-type galaxy scaling relations. A mean age difference, in the sense of younger stellar ages in smaller bulges, appears to explain a large fraction of these trends. We here discuss the likely age difference that can be estimated from the spectroscopic data on our sample galaxies.
Fig. 11 shows the SDSS spectroscopic measurements of our galaxies in comparison to a simple stellar population (SSP) models (Thomas et al. 2003). The SDSS measurements sample the light inside of the 3”-diameter fiber. The median effective diameter of our bulges derived from decomposition is 10.4”, and so the SDSS fiber collects the most of light from the bulge component. Even the smallest bulge in our sample of is 2.4” in diameter – only slightly smaller than the SDSS fiber. Among the bulges inspected in our scaling relation studies in Section 4, 90% of them have within 3” diameter derived from our decomposition. However, we also note that the fraction reduces down to 70% in low galaxies () suggesting that there is some contamination from disk stars in low galaxies. Nonetheless, it is reasonably safe to use the SDSS spectroscopic data to represent bulge properties, except for the low galaxies (see also the discussion of Coelho & Gadotti (2011) on the possible disk contamination in the SDSS fiber.
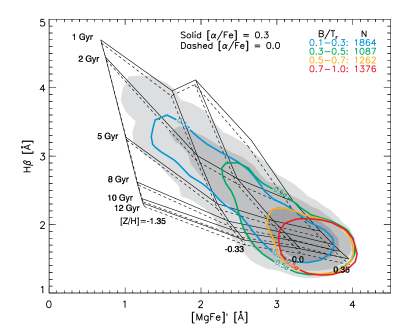
The bulges in the highest galaxies are consistent with uniformly old and metal-rich populations, similarly to massive elliptical galaxies. Smaller bulges however show a longer tail toward younger ages and lower metallicity. The contour of the bulges in the lowest galaxies reaches down to the SSP age of 1 Gyr. Since there must be a spread in age in real bulge stars, an SSP age of 1 Gyr effectively means that there currently is star formation.
The low metallicity of the bulges in the low galaxies derived from this analysis is noteworthy. To begin with, it is compatible with the positive relation between galaxy mass and metallicity (Tremonti et al. 2004; Gallazzi et al. 2005). Bulges are generally thought be to metal rich, and if this low metallicity derived here for the bulges in the low galaxies is due to the “frosting effect” of young stars mixed with a dominant component of old stars, then the youngest population in them would be concluded to be of very low in metallicity. This contradicts the general expectation that younger generations of stars in a closed system are more metal-rich due to chemical recycling. If the low metallicity derived here is true, it strongly implies that bulges are far from being closed systems. Cold gas flows from the vicinity of the baryonic galaxy are probably composed of low metallicity gas which will turn into the formation of low metallicity stars even in the later stage of galaxy evolution. A similar phenomenon has been reported observationally in the Hubble Space Telescope data on the bulge dominant galaxy NGC 4150 (Kaviraj et al. 2012).
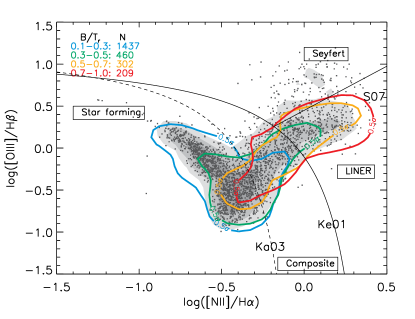
This phenomenon (younger, yet less metal-rich) is also supported by their emission line properties in the BPT diagram (Fig. 12 and Table 5). The bulges in the lower galaxies are more commonly found in the star forming region. The role of a bulge on the star formation and AGN activities of host galaxies has been investigated (e.g., Bell et al. 2012; Saintonge et al. 2012; Lang et al. 2014; Bluck et al. 2014a, b). The phenomenon seems robust, but it is difficult to conclude solely based on our analysis whether the bulge affects AGN and star formation activities directly, or if it is the other way around.
The decomposition yields disk properties as well as bulge properties. An investigation on disk properties is in progress.
| range | SF | composite | AGN | Rest |
|---|---|---|---|---|
| 48.6 | 9.6 | 6.5 | 35.3 | |
| 21.2 | 10.8 | 8.0 | 60 | |
| 5.9 | 7.3 | 10.5 | 76.3 | |
| 2.0 | 4.6 | 8.6 | 84.8 |
6. Summary
To investigate the properties of stellar bulges ranging from the large classical bulges of early-type galaxies to the much smaller bulges of late-type galaxies, we have performed a two-dimensional bulge-disk decomposition for 14,233 galaxies in the redshift range from the SDSS DR12 using the program galfit. The main results and their implications on the bulge formation can be summarized as follows.
It is difficult to derive the size of bulge especially on small-bulge galaxies. This sounds obvious; but in truth it is more a result of the shortcomings of the decomposition technique which affects the colors of the low-galaxies dramatically. As a result, ratios smaller than roughly 0.1 are very uncertain when SDSS data are used. It is important for decomposition studies to explicitly give the details of their decomposition method, as the details have large impacts on the derivation of critical parameters, such as .
For the galaxies of , bulge color is almost constant () regardless of bulge size. The bulges in the low galaxies show a large spread in , and the blue bulges strongly hint at the presence of younger stellar populations.
The results obtained from the three scaling relations (Kormendy relation, Faber-Jackson relation, and the fundamental plane) suggest that bulges have a different mixture of their constituent stellar populations. The bulges in the lower galaxies have fainter surface brightness on average at fixed effective radius in the Kormendy relation, and this variation seems to be gradual as a function of bulge size.
The bulges in lower galaxies show a lower velocity dispersion for a given bulge luminosity. This hints at the possibility that they are more dominated by (rotational) ordered motion. However, the photometric data we use here are not sufficient to make conclusive comments on kinematic properties of bulges. The stellar light properties are easier to access through the SDSS data, and thus we investigate on the absorption and emission line properties of effectively “bulges”. Some bulges in low galaxies appear to be substantially younger than those in large galaxies, roughly by an order of magnitude in SSP age. This is somewhat surprising because we earlier noted that the “average” optical color of bulges is roughly fixed against a variation in bulge size. A large fraction of the spread in slope and of the scatter in scaling relations seems to originate from the variation in stellar age, in other words, mass-to-light ratio. A varied mixture of minor and major mergers and a different degree of environmental effect would result in a wide range of which would then naturally explain the smooth distribution of bulges of differing size in the scaling relations.
If the results of our decomposition are robust, most bulges are similar to elliptical galaxies. But it is also clear that the bulges in low galaxies are increasingly deviating from the bulges in early-type galaxies with decreasing ratio. A gradual age difference can explain some of the observed properties but probably does not tell the whole story. If we may combine what is visible in our study with what has been suggested in other studies, it seems natural to conclude that the properties of bulges are a delicate result of the past history of mass build-up including star formation, mergers, and even secular and environmental effects. This may sound obvious because it probably applies to all galaxies. Yet, the variation in the properties of bulges are much wider than that of elliptical galaxies and, accordingly, so maybe their formation processes.
| Parameters | Description |
|---|---|
| SDSS ObjID | SDSS DR12 Object ID |
| SDSS Spectroscopic Redshift | |
| Conversion factor of arcsec to kpc at redshift z (kpc / arcsec) | |
| Fitted R.A. of both bugle and disk (degree) | |
| Error of fitted R.A. (degree) | |
| Fitted Dec. of both of bulge and disk (degree) | |
| Error of fitted Dec. (degree) | |
| -band apparent magnitude of bulge | |
| Error of -band apparent magnitude of bulge | |
| -band apparent magnitude of bulge | |
| Error of -band apparent magnitude of bulge | |
| Semimajor effective radius of bulge (pixel) | |
| Error of semimajor effective radius of bulge (pixel) | |
| Sérsic index of bulge | |
| Error of Sérsic index of bulge | |
| Axis ratio of bulge | |
| Error of axis ratio of bulge | |
| Position angle of bulge (degree, from North to East) | |
| Error of position angle of bulge (degree) | |
| -band apparent magnitude of disk | |
| Error of -band apparent magnitude of disk | |
| -band apparent magnitude of disk | |
| Error of -band apparent magnitude of disk | |
| Semimajor scale length of disk (pixel) | |
| Error of semimajor scale length of disk (pixel) | |
| Axis ratio of disk | |
| Error of axis ratio of disk | |
| Position Angle of disk in degrees (degree, from North to East) | |
| Error of Position Angle of disk (degree) | |
| -band bulge to total ratio | |
| Error of -band bulge to total ratio | |
| -band bulge to total ratio | |
| Error of -band bulge to total ratio | |
| Reduced of fit in band | |
| Reduced of fit in band |
Note. — The percentages in each line add up to 100%.
| SDSS ObjID | |||||
|---|---|---|---|---|---|
| 1237655130373161135 | 0.0423376 | 0.83525435 | 242.75532 | 0.00792 | 49.79537 |
| 1237654948378837139 | 0.0412290 | 0.81445694 | 243.74803 | 0.00396 | 50.34115 |
| 1237654948915839016 | 0.0435533 | 0.85799471 | 244.45464 | 0.00396 | 50.33038 |
| 1237668611197698265 | 0.0420984 | 0.83077079 | 244.80742 | 0.00396 | 50.30850 |
| 1237654949452709950 | 0.0488313 | 0.95596235 | 245.02977 | 0.00396 | 50.55449 |
| 0.00396 | 17.89 | 0.01 | 16.76 | 0.04 | 4.16 |
| 0.00396 | 14.97 | 0.00 | 13.94 | 0.01 | 42.93 |
| 0.00396 | 15.70 | 0.00 | 14.80 | 0.05 | 18.37 |
| 0.00396 | 17.61 | 0.01 | 16.64 | 0.06 | 5.39 |
| 0.00396 | 16.55 | 0.00 | 15.69 | 0.05 | 12.25 |
| 0.32 | 4.94 | 0.42 | 0.30 | 0.01 | 52.84409 |
| 1.09 | 5.60 | 0.07 | 0.73 | 0.00 | 223.24847 |
| 1.65 | 5.74 | 0.21 | 0.82 | 0.00 | 62.05409 |
| 0.50 | 4.48 | 0.25 | 0.49 | 0.01 | 160.41439 |
| 0.91 | 3.78 | 0.15 | 0.60 | 0.00 | 126.14346 |
| 0.54 | 14.41 | 0.00 | 13.81 | 0.00 | 21.70 |
| 0.39 | 16.34 | 0.01 | 16.80 | 0.06 | 22.18 |
| 0.68 | 16.62 | 0.02 | 16.03 | 0.09 | 32.93 |
| 0.52 | 16.43 | 0.00 | 15.79 | 0.02 | 12.66 |
| 0.37 | 16.87 | 0.02 | 16.34 | 0.07 | 31.37 |
| 0.05 | 0.71 | 0.00 | 214.86409 | 0.22 | 0.03897 |
| 1.12 | 0.60 | 0.02 | 197.39847 | 2.78 | 0.77934 |
| 1.02 | 0.94 | 0.03 | 83.27409 | 16.71 | 0.70001 |
| 0.12 | 0.78 | 0.01 | 133.82439 | 1.82 | 0.25222 |
| 1.12 | 0.60 | 0.01 | 103.73346 | 2.52 | 0.57315 |
| 0.00034 | 0.06197 | 0.00214 | 1.702 | 1.680 | |
| 0.00158 | 0.93303 | 0.00350 | 0.980 | 0.953 | |
| 0.00387 | 0.75637 | 0.01747 | 0.864 | 0.814 | |
| 0.00174 | 0.31370 | 0.01254 | 0.999 | 1.023 | |
| 0.00451 | 0.64535 | 0.01813 | 0.948 | 0.976 |
Note. — Table 7 is published in its entirety in the electronic edition of the Astrophysical Journal Supplement Series. A portion is shown here for guidance regarding its form and content.
References
- Alam et al. (2015) Alam, S., Albareti, F. D., Allende Prieto, C., et al. 2015, ApJS, 219, 12
- Allen et al. (2006) Allen, P. D., Driver, S. P., Graham, A. W., et al. 2006, MNRAS, 371, 2
- Athanassoula (2016) Athanassoula, E. 2016, Galactic Bulges, 418, 391
- Baldwin et al. (1981) Baldwin, J. A., Phillips, M. M., & Terlevich, R. 1981, PASP, 93, 5
- Baum (1959) Baum, W. A. 1959, PASP, 71, 106
- Bell et al. (2012) Bell, E. F., van der Wel, A., Papovich, C., et al. 2012, ApJ, 753, 167
- Bender et al. (1993) Bender, R., Burstein, D., & Faber, S. M. 1993, ApJ, 411, 153
- Benson et al. (2007) Benson, A. J., Džanović, D., Frenk, C. S., & Sharples, R. 2007, MNRAS, 379, 841
- Bernardi et al. (2003a) Bernardi, M., Sheth, R. K., Annis, J., et al. 2003, AJ, 125, 1849
- Bernardi et al. (2003b) Bernardi, M., Sheth, R. K., Annis, J., et al. 2003, AJ, 125, 1882
- Bernardi et al. (2003c) Bernardi, M., Sheth, R. K., Annis, J., et al. 2003, AJ, 125, 1866
- Bernardi et al. (2011) Bernardi, M., Roche, N., Shankar, F., & Sheth, R. K. 2011, MNRAS, 412, L6
- Bertin & Arnouts (1996) Bertin, E., & Arnouts, S. 1996, A&AS, 117, 393
- Blanton et al. (2003) Blanton, M. R., Hogg, D. W., Bahcall, N. A., et al. 2003, ApJ, 594, 186
- Bluck et al. (2014a) Bluck, A. F. L., Mendel, J. T., Ellison, S. L., et al. 2014, MNRAS, 441, 599
- Bluck et al. (2014b) Bluck, A. F. L., Ellison, S. L., Patton, D. R., et al. 2014, arXiv:1412.3862
- Bower et al. (1992) Bower, R. G., Lucey, J. R., & Ellis, R. S. 1992, MNRAS, 254, 601
- Broeils & Courteau (1997) Broeils, A. H., & Courteau, S. 1997, Dark and Visible Matter in Galaxies and Cosmological Implications, 117, 74
- Byun & Freeman (1995) Byun, Y. I., & Freeman, K. C. 1995, ApJ, 448, 563
- Capaccioli (1989) Capaccioli, M. 1989, World of Galaxies (Le Monde des Galaxies), 208
- Cappellari & Emsellem (2004) Cappellari, M., & Emsellem, E. 2004, PASP, 116, 138
- Cappellari et al. (2006) Cappellari, M., Bacon, R., Bureau, M., et al. 2006, MNRAS, 366, 1126
- Carollo (1999) Carollo, C. M. 1999, ApJ, 523, 566
- Choi et al. (2009) Choi, Y., Goto, T., & Yoon, S.-J. 2009, MNRAS, 395, 637
- Coelho & Gadotti (2011) Coelho, P., & Gadotti, D. A. 2011, ApJ, 743, L13
- Cowie et al. (1996) Cowie, L. L., Songaila, A., Hu, E. M., & Cohen, J. G. 1996, AJ, 112, 839
- De Lucia et al. (2006) De Lucia, G., Springel, V., White, S. D. M., Croton, D., & Kauffmann, G. 2006, MNRAS, 366, 499
- Desroches et al. (2007) Desroches, L.-B., Quataert, E., Ma, C.-P., & West, A. A. 2007, MNRAS, 377, 402
- Djorgovski & Davis (1987) Djorgovski, S., & Davis, M. 1987, ApJ, 313, 59
- Dressler (1987) Dressler, A. 1987, ApJ, 317, 1
- Driver et al. (2006) Driver, S. P., Allen, P. D., Graham, A. W., et al. 2006, MNRAS, 368, 414
- Erwin et al. (2015) Erwin, P., Saglia, R. P., Fabricius, M., et al. 2015, MNRAS, 446, 4039
- Faber & Jackson (1976) Faber, S. M., & Jackson, R. E. 1976, ApJ, 204, 668
- Fabricius et al. (2012) Fabricius, M. H., Saglia, R. P., Fisher, D. B., et al. 2012, ApJ, 754, 67
- Falcón-Barroso et al. (2002) Falcón-Barroso, J., Peletier, R. F., & Balcells, M. 2002, MNRAS, 335, 741
- Fernández Lorenzo et al. (2014) Fernández Lorenzo, M., Sulentic, J., Verdes-Montenegro, L., et al. 2014, ApJ, 788, LL39
- Fisher et al. (1996) Fisher D., Franx M., Illingworth G., 1996, ApJ, 459, 110
- Fisher & Drory (2010) Fisher, D. B., & Drory, N. 2010, ApJ, 716, 942
- Forbes et al. (1998) Forbes, D. A., Ponman, T. J., & Brown, R. J. N. 1998, ApJ, 508, L43
- Freeman (1970) Freeman, K. C. 1970, ApJ, 160, 811
- Gallazzi et al. (2005) Gallazzi, A., Charlot, S., Brinchmann, J., White, S. D. M., & Tremonti, C. A. 2005, MNRAS, 362, 41
- Gadotti (2009) Gadotti, D. A. 2009, MNRAS, 393, 1531
- Graves et al. (2009) Graves, G. J., Faber, S. M., & Schiavon, R. P. 2009, ApJ, 698, 1590
- Häussler et al. (2007) Häussler, B., McIntosh, D. H., Barden, M., et al. 2007, ApJS, 172, 615
- Hubble (1926) Hubble, E. P. 1926, ApJ, 64, 321
- Hubble (1936) Hubble, E. P. 1936, The Realm of the Nebulae, Yale Univ. Press, Yale.
- Hudson et al. (2010) Hudson, M. J., Stevenson, J. B., Smith, R. J., et al. 2010, MNRAS, 409, 405
- Jablonka et al. (1996) Jablonka, P., Martin, P., & Arimoto, N. 1996, AJ, 112, 1415
- Jeong et al. (2009) Jeong, H., Yi, S. K., Bureau, M., et al. 2009, MNRAS, 398, 2028
- Johnston et al. (2012) Johnston, E. J., Aragón-Salamanca, A., Merrifield, M. R., & Bedregal, A. G. 2012, MNRAS, 422, 2590
- Johnston et al. (2014) Johnston, E. J., Aragón-Salamanca, A., & Merrifield, M. R. 2014, MNRAS, 441, 333
- Kaviraj et al. (2012) Kaviraj, S., Crockett, R. M., Whitmore, B. C., et al. 2012, MNRAS, 422, L96
- Kauffmann et al. (2003) Kauffmann, G., Heckman, T. M., Tremonti, C., et al. 2003, MNRAS, 346, 1055
- Kelvin et al. (2012) Kelvin, L. S., Driver, S. P., Robotham, A. S. G., et al. 2012, MNRAS, 421, 1007
- Kent (1985) Kent, S. M. 1985, ApJS, 59, 115
- Kewley et al. (2001) Kewley, L. J., Dopita, M. A., Sutherland, R. S., Heisler, C. A., & Trevena, J. 2001, ApJ, 556, 121
- Khim et al. (2015) Khim, H.-g., Park, J., Seo, S.-W., et al. 2015, arXiv:1507.04069
- Kim et al. (2008) Kim, M., Ho, L. C., Peng, C. Y., et al. 2008, ApJ, 687, 767
- Kormendy (1977) Kormendy, J. 1977, ApJ, 218, 333
- Kormendy & Illingworth (1982) Kormendy, J., & Illingworth, G. 1982, ApJ, 256, 460
- Kormendy & Kennicutt (2004) Kormendy, J., & Kennicutt, R. C., Jr. 2004, ARA&A, 42, 603
- Kormendy & Ho (2013) Kormendy, J., & Ho, L. C. 2013, ARA&A, 51, 511
- Kormendy (2015) Kormendy, J. 2015, arXiv:1504.03330
- La Barbera et al. (2003) La Barbera, F., Busarello, G., Merluzzi, P., Massarotti, M., & Capaccioli, M. 2003, ApJ, 595, 127
- Lackner & Gunn (2012) Lackner, C. N., & Gunn, J. E. 2012, MNRAS, 421, 2277
- Lang et al. (2014) Lang, P., Wuyts, S., Somerville, R. S., et al. 2014, ApJ, 788, 11
- Lee & Yi (2013) Lee, J., & Yi, S. K. 2013, ApJ, 766, 38
- MacArthur et al. (2003) MacArthur, L. A., Courteau, S., & Holtzman, J. A. 2003, ApJ, 582, 689
- Meert et al. (2013) Meert, A., Vikram, V., & Bernardi, M. 2013, MNRAS, 433, 1344
- Meert et al. (2015) Meert, A., Vikram, V., & Bernardi, M. 2015, MNRAS, 446, 3943
- Mendel et al. (2014) Mendel, J. T., Simard, L., Palmer, M., Ellison, S. L., & Patton, D. R. 2014, ApJS, 210, 3
- Montero-Dorta et al. (2015) Montero-Dorta, A. D., Shu, Y., Bolton, A. S., Brownstein, J. R., & Weiner, B. J. 2015, arXiv:1505.03866
- Oh et al. (2011) Oh, K., Sarzi, M., Schawinski, K., & Yi, S. K. 2011, ApJS, 195, 13
- Oh et al. (2012) Oh, S., Oh, K., & Yi, S. K. 2012, ApJS, 198, 4
- Oh et al. (2013) Oh, K., Choi, H., Kim, H.-G., Moon, J.-S., & Yi, S. K. 2013, AJ, 146, 151
- Peletier et al. (1999) Peletier, R. F., Balcells, M., Davies, R. L., et al. 1999, MNRAS, 310, 703
- Peng et al. (2002) Peng, C. Y., Ho, L. C., Impey, C. D., & Rix, H.-W. 2002, AJ, 124, 266
- Peng et al. (2010) Peng, C. Y., Ho, L. C., Impey, C. D., & Rix, H.-W. 2010, AJ, 139, 2097
- Proctor & Sansom (2002) Proctor, R. N., & Sansom, A. E. 2002, MNRAS, 333, 517
- Saintonge et al. (2012) Saintonge, A., Tacconi, L. J., Fabello, S., et al. 2012, ApJ, 758, 73
- Sandage & Visvanathan (1978) Sandage, A., & Visvanathan, N. 1978, ApJ, 223, 707
- Sarzi et al. (2006) Sarzi, M., et al. 2006, MNRAS, 366, 1151
- Schawinski et al. (2007) Schawinski, K., Thomas, D., Sarzi, M., et al. 2007, MNRAS, 382, 1415
- Sérsic (1968) Sérsic, J. L. 1968, Atlas de Galaxies Australes (Córdoba: ObS, Astron., Univ. Nac. Córdoba
- Silk & Bouwens (1999) Silk, J., & Bouwens, R. 1999, Ap&SS, 265, 379
- Simard et al. (2002) Simard, L., Willmer, C. N. A., Vogt, N. P., et al. 2002, ApJS, 142, 1
- Simard et al. (2011) Simard, L., Mendel, J. T., Patton, D. R., Ellison, S. L., & McConnachie, A. W. 2011, ApJS, 196, 11
- Simien & de Vaucouleurs (1986) Simien, F., & de Vaucouleurs, G. 1986, ApJ, 302, 564
- Springob et al. (2012) Springob, C. M., Magoulas, C., Proctor, R., et al. 2012, MNRAS, 420, 2773
- Strateva et al. (2001) Strateva, I., Ivezić, Ž., Knapp, G. R., et al. 2001, AJ, 122, 1861
- Suh et al. (2010) Suh, H., Jeong, H., Oh, K., et al. 2010, ApJS, 187, 374
- Thomas et al. (2003) Thomas, D., Maraston, C., & Bender, R. 2003, MNRAS, 339, 897
- Toomre & Toomre (1972) Toomre, A., & Toomre, J. 1972, ApJ, 178, 623
- Trager et al. (2000) Trager, S. C., Faber, S. M., Worthey, G., & González, J. J. 2000, AJ, 119, 1645
- Tremonti et al. (2004) Tremonti, C. A., Heckman, T. M., Kauffmann, G., et al. 2004, ApJ, 613, 898
- Weinzirl et al. (2009) Weinzirl, T., Jogee, S., Khochfar, S., Burkert, A., & Kormendy, J. 2009, ApJ, 696, 411
- White & Rees (1978) White, S. D. M., & Rees, M. J. 1978, MNRAS, 183, 341
- Worthey (1994) Worthey, G. 1994, ApJS, 95, 107
- Yi (2003) Yi, S. K. 2003, ApJ, 582, 202
- York et al. (2000) York, D. G., et al. 2000, AJ, 120, 1579
- Zhao et al. (2015) Zhao, D., Aragón-Salamanca, A., & Conselice, C. J. 2015, MNRAS, 448, 2530