ALMA Imaging and Gravitational Lens Models of South Pole Telescope–
Selected Dusty, Star-Forming Galaxies at High Redshifts
Abstract
The South Pole Telescope has discovered one hundred gravitationally lensed, high-redshift, dusty, star-forming galaxies (DSFGs). We present 0.5′′ resolution 870 Atacama Large Millimeter/submillimeter Array imaging of a sample of 47 DSFGs spanning , and construct gravitational lens models of these sources. Our visibility-based lens modeling incorporates several sources of residual interferometric calibration uncertainty, allowing us to properly account for noise in the observations. At least 70% of the sources are strongly lensed by foreground galaxies (), with a median magnification , extending to . We compare the intrinsic size distribution of the strongly lensed sources to a similar number of unlensed DSFGs and find no significant differences in spite of a bias between the magnification and intrinsic source size. This may indicate that the true size distribution of DSFGs is relatively narrow. We use the source sizes to constrain the wavelength at which the dust optical depth is unity and find this wavelength to be correlated with the dust temperature. This correlation leads to discrepancies in dust mass estimates of a factor of 2 compared to estimates using a single value for this wavelength. We investigate the relationship between the [CII] line and the far-infrared luminosity and find that the same correlation between the [CII]/ ratio and found for low-redshift star-forming galaxies applies to high-redshift galaxies and extends at least two orders of magnitude higher in . This lends further credence to the claim that the compactness of the IR-emitting region is the controlling parameter in establishing the “[CII] deficit.”
Subject headings:
galaxies: high-redshift — galaxies: ISM — galaxies: star formation1. Introduction
With the Atacama Large Millimeter/submillimeter Array (ALMA) now in full operation, our understanding of dust-enshrouded star formation at high redshifts is advancing more rapidly than ever before. The most intense star formation in the universe takes place in dusty, star-forming galaxies (DSFGs), at high redshifts (), creating new stars at rates of yr-1 (see a recent review by Casey et al. 2014). The otherwise high UV luminosity from massive young stars in these galaxies is almost entirely reprocessed by interstellar dust, which absorbs the short-wavelength radiation and re-radiates it at far-infrared (FIR) and (sub)millimeter wavelengths. Although DSFGs represent a significant contribution to the comoving star formation rate density out to at least (e.g., Chapman et al., 2005; Casey et al., 2013), producing a realistic population of DSFGs has long been a challenge for theoretical models of galaxy evolution (e.g., Baugh et al., 2005; Davé et al., 2010; Hayward et al., 2013; Narayanan et al., 2015).
Observations of these galaxies benefit from a strongly negative “K-correction” at submillimeter wavelengths (e.g., Blain & Longair, 1993), in which the dimming due to increased cosmological distance is countered by the rapidly rising dust spectral energy distribution (SED) at fixed observing wavelength. DSFGs were initially discovered in low-resolution (′′) 850 deep images (Smail et al., 1997; Barger et al., 1998; Hughes et al., 1998), and high-resolution follow-up studies at submillimeter wavelengths remain challenging, as are observations at other wavelengths that do not benefit from the negative K-correction. One fairly straightforward method of gaining resolution is to target a sample of gravitationally lensed galaxies, such as those discovered by the South Pole Telescope (Carlstrom et al., 2011; Vieira et al., 2010; Mocanu et al., 2013) or the Herschel Space Observatory (Negrello et al., 2010; Wardlow et al., 2013). Follow-up observations of these galaxies at FIR/submillimeter wavelengths, where they are brightest, with interferometers such as ALMA and the Submillimeter Array have shown that the bulk of the brightest objects are consistent with strong gravitational lensing (e.g., Hezaveh et al., 2013; Vieira et al., 2013; Bussmann et al., 2013). Lensed samples offer the opportunity to study DSFGs at higher resolution and using fainter observational diagnostics than otherwise possible (e.g., Swinbank et al., 2010; Fu et al., 2012; Bothwell et al., 2013; Spilker et al., 2014).
Taking advantage of gravitational lensing requires careful modeling to understand its effects. In this paper, we present lens models of a sample of 47 DSFGs discovered in South Pole Telescope data and observed by ALMA at ” resolution. Hezaveh et al. (2013) presented models of four sources which were spatially resolved at the ′′ resolution of the first data acquired for this project; here we expand this work to include the completed dataset, including all sources and array configurations. As in Hezaveh et al. (2013), our models are performed in the Fourier plane native to the interferometer, and marginalized over several common calibration uncertainties. The resulting intrinsic source properties span a large range in luminosity, and we use these derived properties to explore the intrinsic size distribution of DSFGs, their dust SEDs, and the relation between the [CII] fine structure line and the FIR luminosity.
In Section 2, we describe the selection criteria and ALMA observations. Section 3 describes our gravitational lens modeling technique, with the results of these models detailed in Section 4. In Section 5 we use these models to address selected topics of interest, including the intrinsic size distribution of DSFGs and the relationship between the [CII] fine structure line and the FIR luminosity. We conclude in Section 6. Throughout this work, we assume a flat WMAP9 CDM cosmology, , , and (Hinshaw et al., 2013). We define the far-infrared luminosity to be integrated over rest-frame (Helou et al., 1988).
2. Sample Selection and Observations
The selection criteria used to generate the SPT DSFG sample are described in detail by Weiß et al. (2013). Briefly, sources were selected to have dust-like spectral indices between 1.4 and 2 mm (i.e., / ; Mocanu et al. 2013). Further selection criteria remove synchrotron-dominated and low-redshift () contaminant sources. Redshifts for some of the SPT DSFGs are presented in Strandet et al. (2016). Optical and near-infrared spectroscopic redshifts of the foreground lenses, where available, will be presented in Rotermund et al., in prep. Finally, we make use of optical and infrared imaging data obtained from a variety of facilities, including the Hubble Space Telescope, Very Large Telescope, Magellan-Baade telescope, and Spitzer/IRAC.
To refine the coarse SPT positions, each source was observed at higher spatial resolution to improve the positional accuracy, typically at 870 using the Large Apex BOlometer CAmera (LABOCA) or at 1.3 mm using the Submillimeter Array (SMA). From this catalog, we selected 47 bright sources which could be placed into four groups of targets that lie within 15∘ of each other on the sky in order to share calibrator sources. The targets are listed in Table 1. In Figure 1 we compare the objects in the subsample observed by ALMA with all SPT sources and with the Herschel-selected objects observed by Bussmann et al. (2013, 2015).
These 47 SPT sources were observed by ALMA at 870 as part of Cycle 0 program 2011.0.00958.S (PI D. Marrone). The ALMA observations were carried out in eight sessions from November 2011 to August 2012 and are summarized in Table 2. Given the limited number of antennas available at the beginning of Cycle 0 (minimum 14), each group of sources was observed with two different array configurations, corresponding to approximately 0.5 and 1.5′′ resolution, to provide better sampling of the plane. Over the series of observations the number of antennas increased (up to 25), providing greater sensitivity in later observations. Additional sources with precisely known positions from the International Celestial Reference Frame (ICRF; Ma et al. 1998) were observed to verify the astrometric and antenna baseline solutions. Each source was observed for 60–90 s per array configuration. The total observing time for all calibrators and science targets was 9.4 hours.
Four basebands, each processing 2 GHz of telescope bandwidth, were centered near 336.8, 338.8, 348.8, and 350.8 GHz. The correlator was configured to provide 128 channels of 15.6 MHz width for each baseband. Bandpass calibration was performed by observing a bright quasar at the beginning of each track. Time-dependent amplitude and phase variations were calibrated using several quasars near (typically within of) the science targets. The flux scale was determined at the beginning of each track using an available solar system object or quasar with a recently determined flux density, as detailed in Table 2. This flux scale is estimated to be correct to within 10%, although we allow an amplitude re-scaling between the two observations of each group of sources in our modeling (see Section 3). We estimate the noise on each visibility measurement by calculating the scatter after differencing successive visibilities on the same baseline, baseband, and polarization. After calibration, the data from each track were combined and imaged using Briggs weighting (robust parameter ). This weighting represents a compromise which somewhat favors higher resolution at the expense of sensitivity.
In four objects (SPT0125-47, SPT0125-50, SPT2103-60, SPT2354-58), we serendipitously detected a spectral feature in the ALMA data. As we consider only models of the continuum emission in this work, for these sources, we exclude the spectral window containing the spectral line.
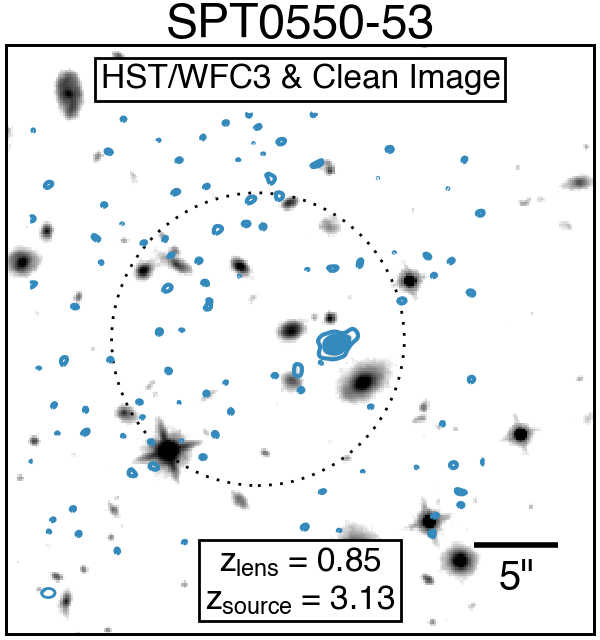
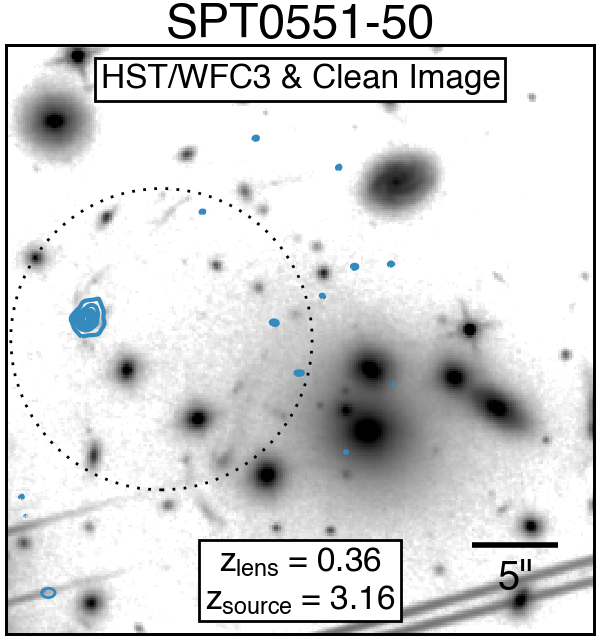
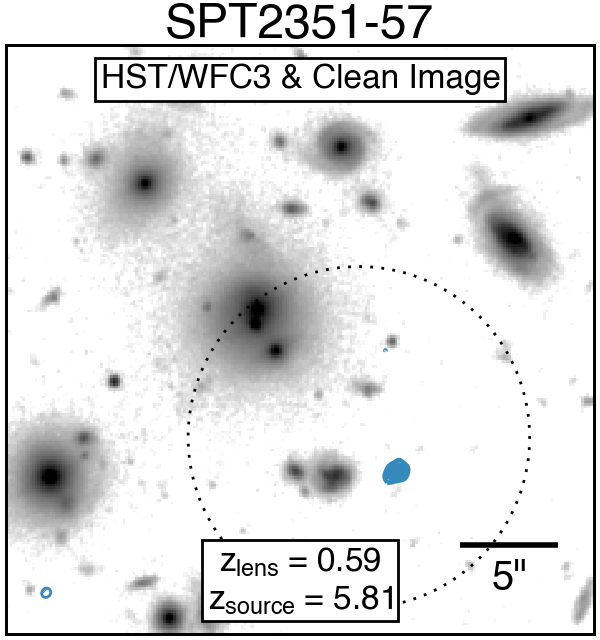
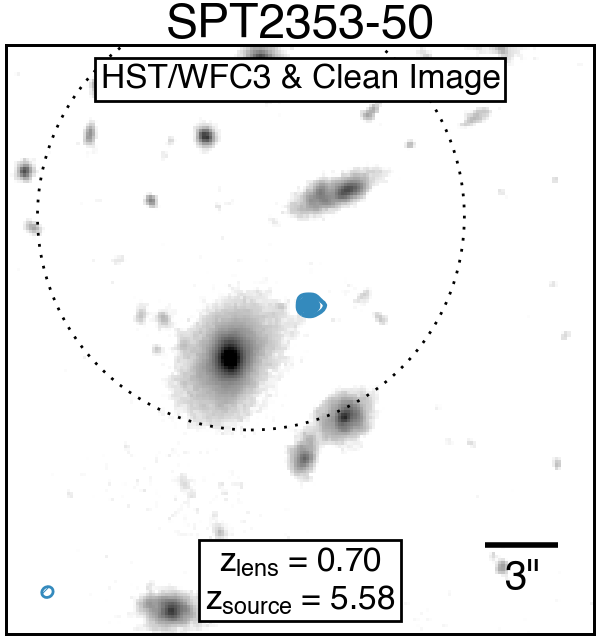
Another four objects (SPT0550-53, SPT0551-50, SPT2351-57, SPT2353-50) appear to be lensed by galaxy groups or clusters. HST imaging shows numerous galaxies in the vicinity of the 870 emission. Images of these sources are shown in Appendix B. The ALMA measurements show only single images, and the ALMA field of view does not encompass the expected locations of counterimages. For these sources, the lensing geometry cannot be constrained by the ALMA data alone. Beyond counting them among the sources identified as lensed, we ignore them for the remainder of this paper.
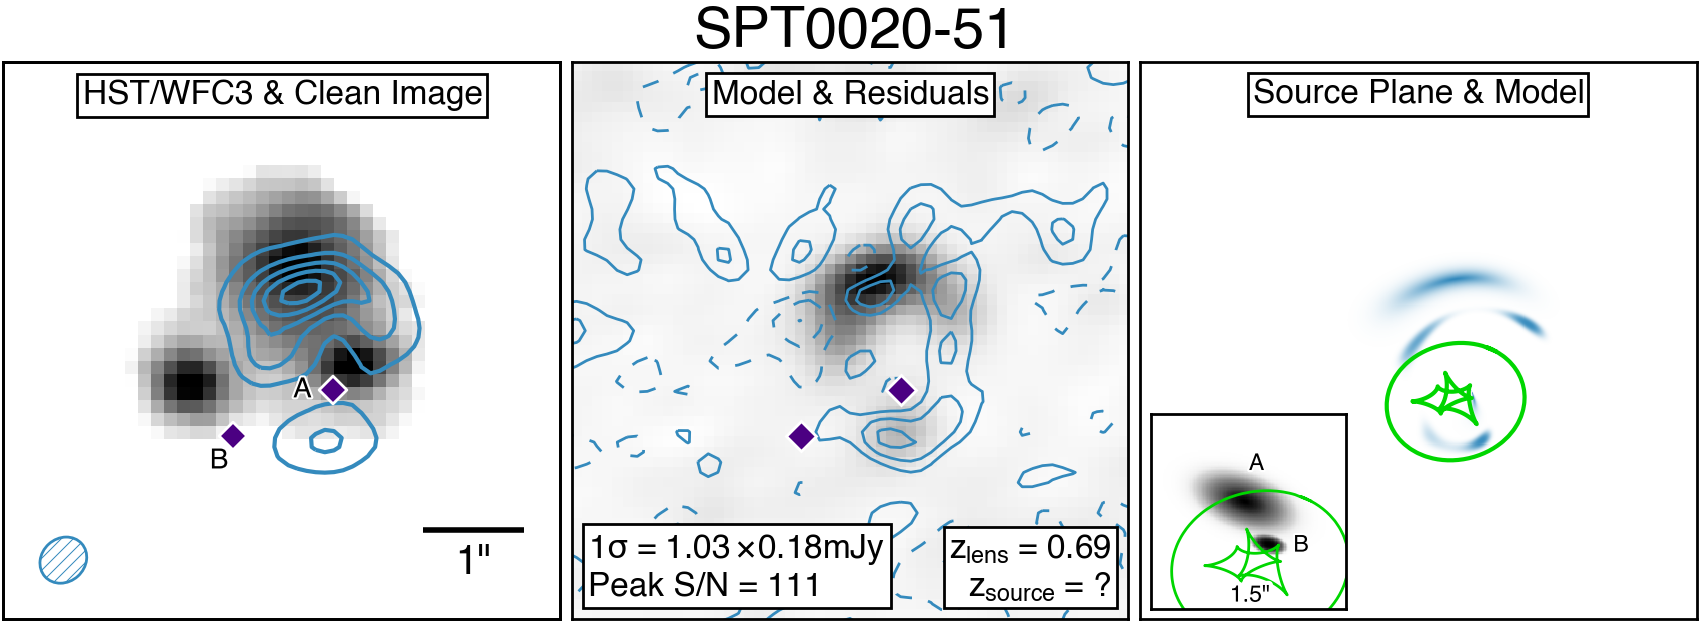
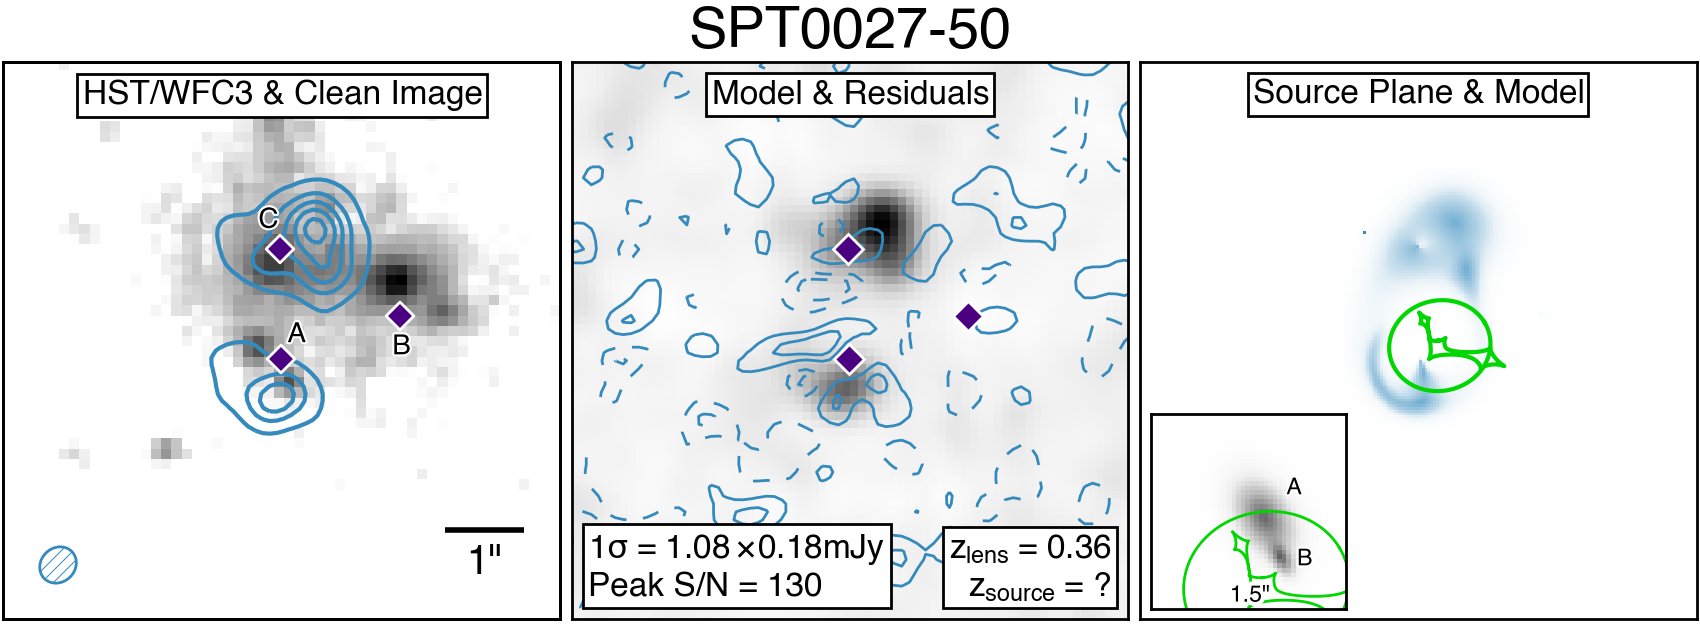
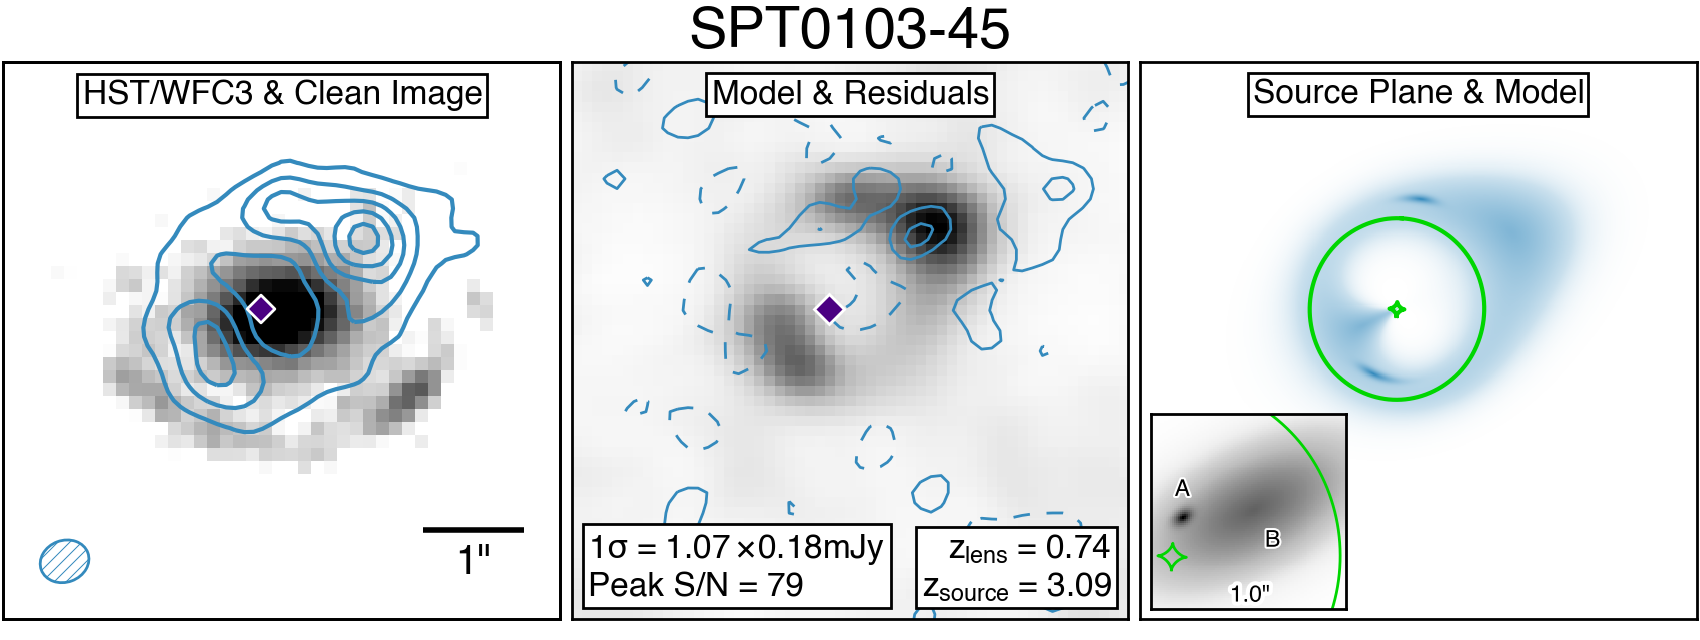
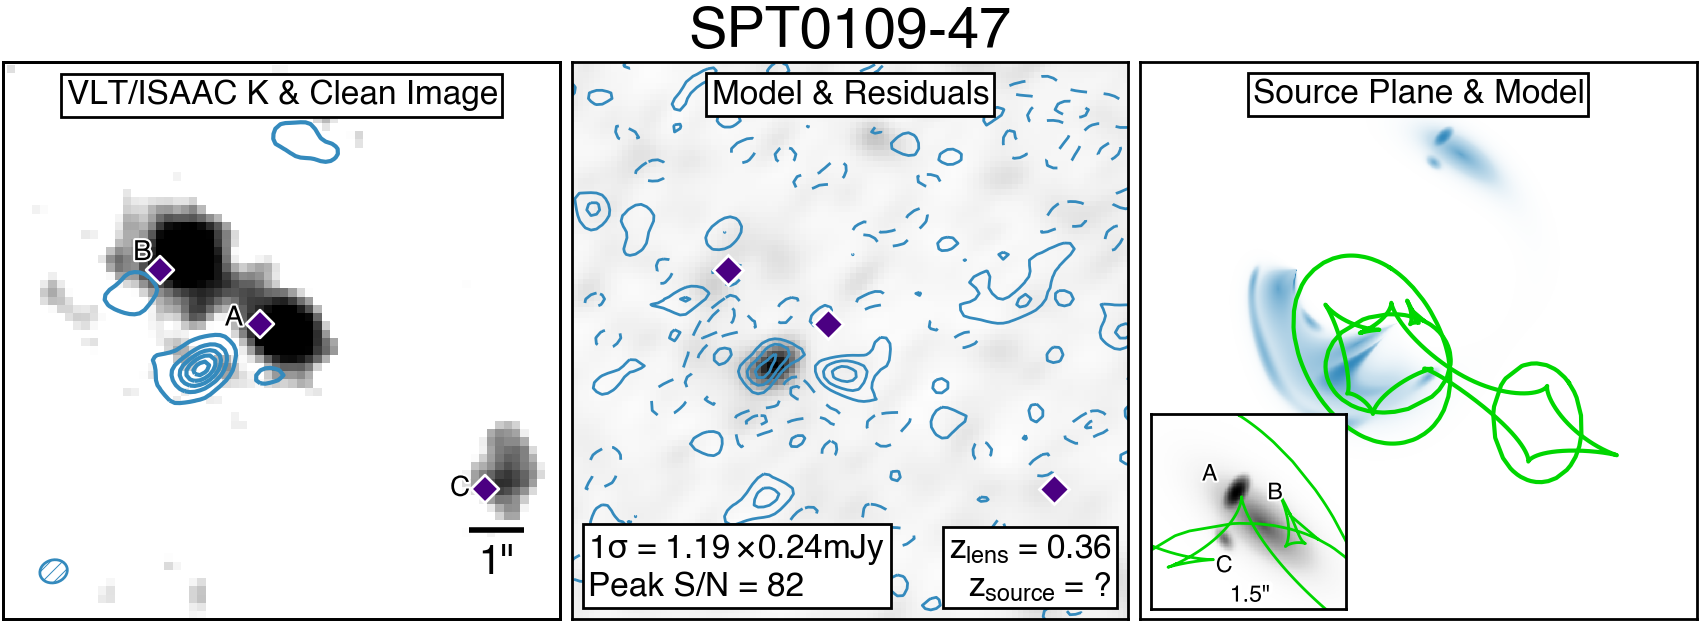
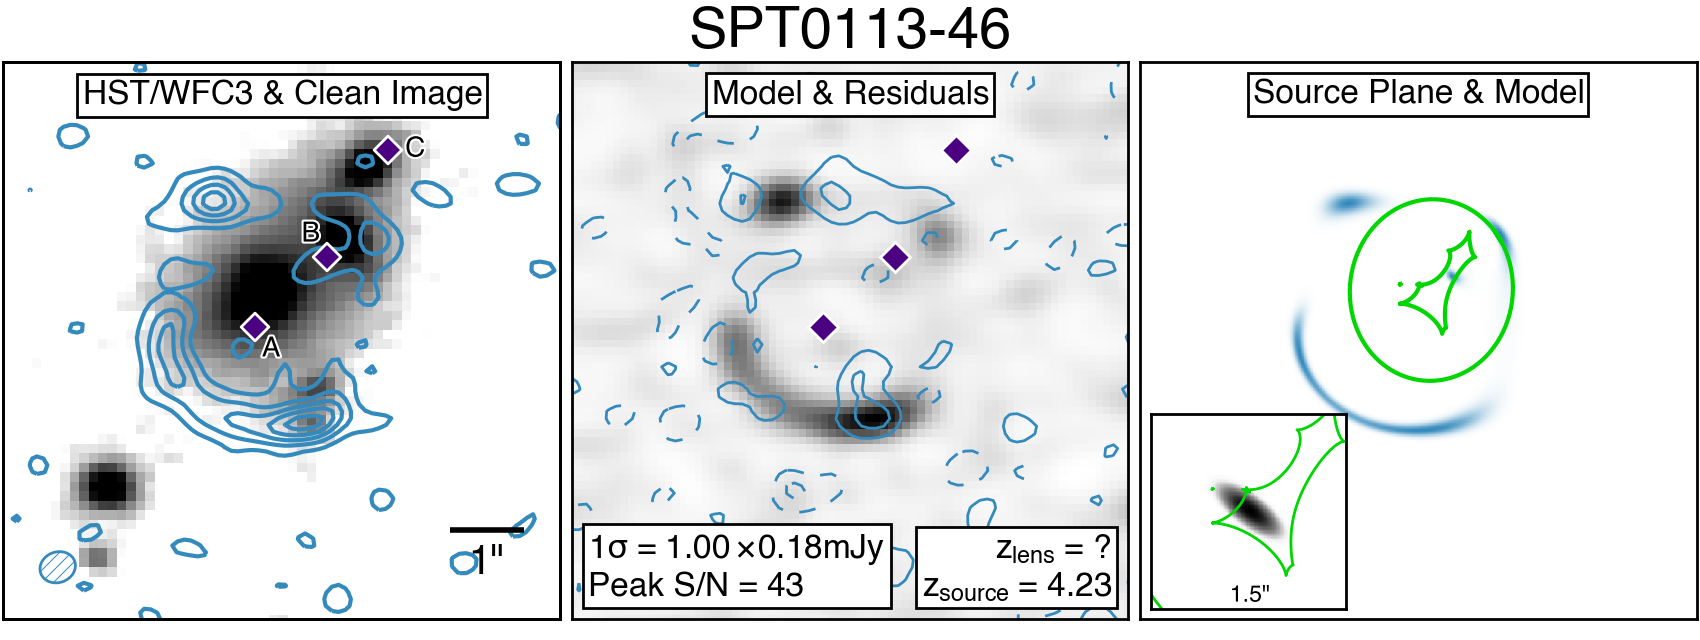
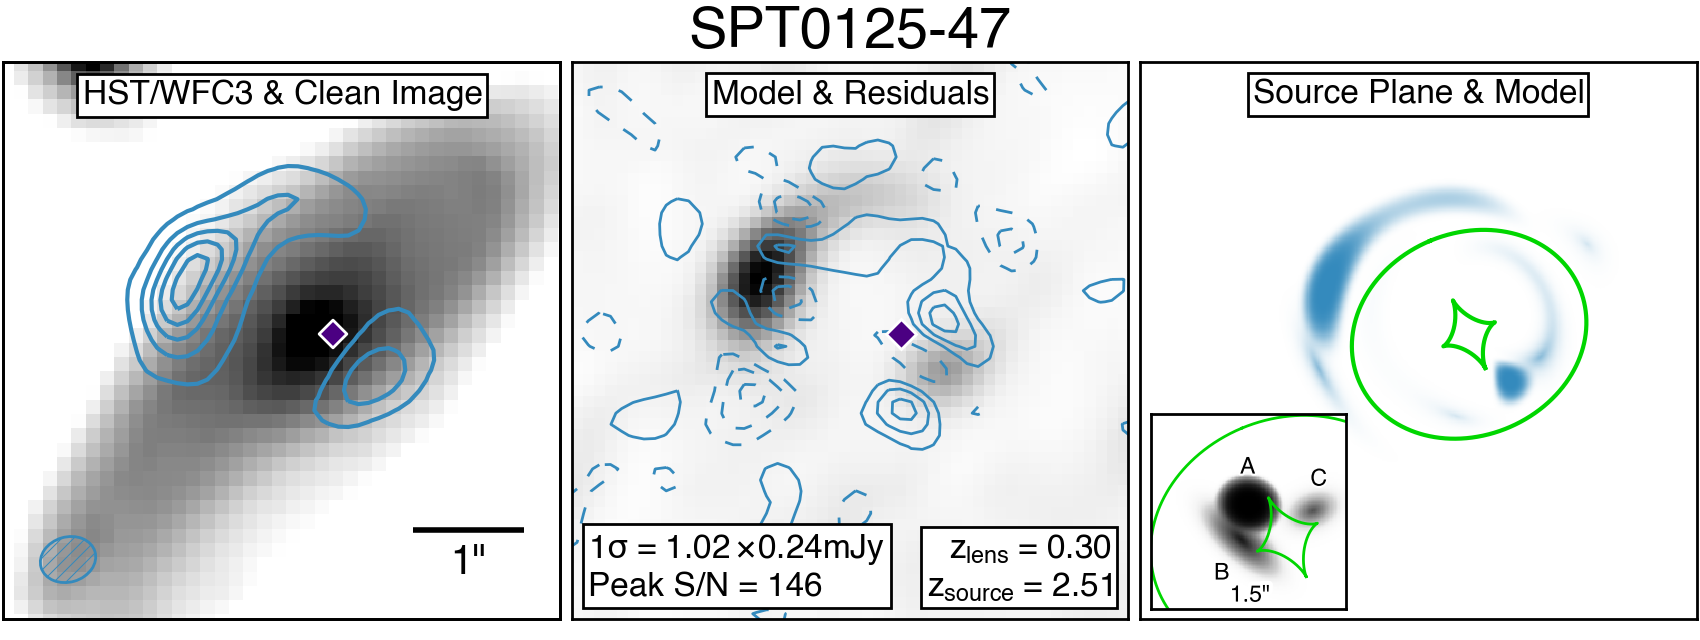
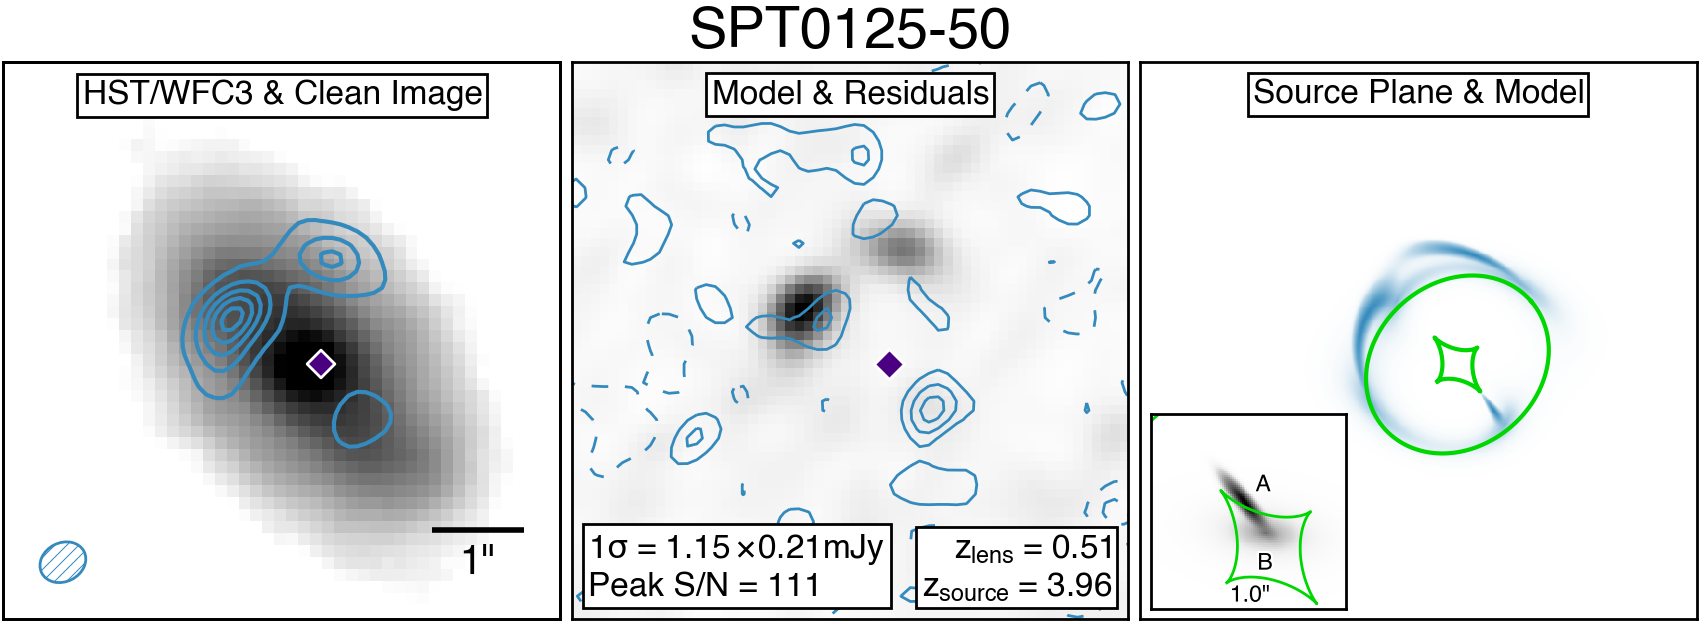
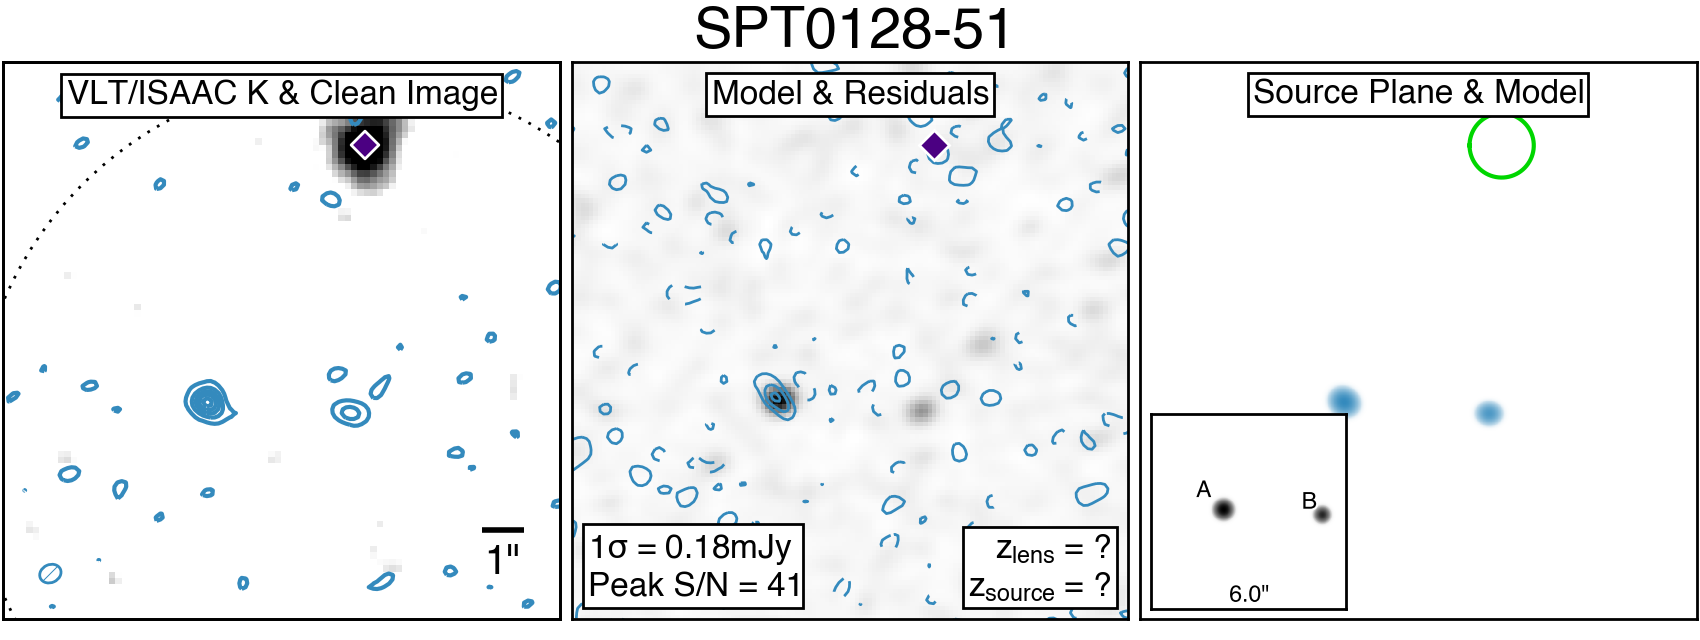
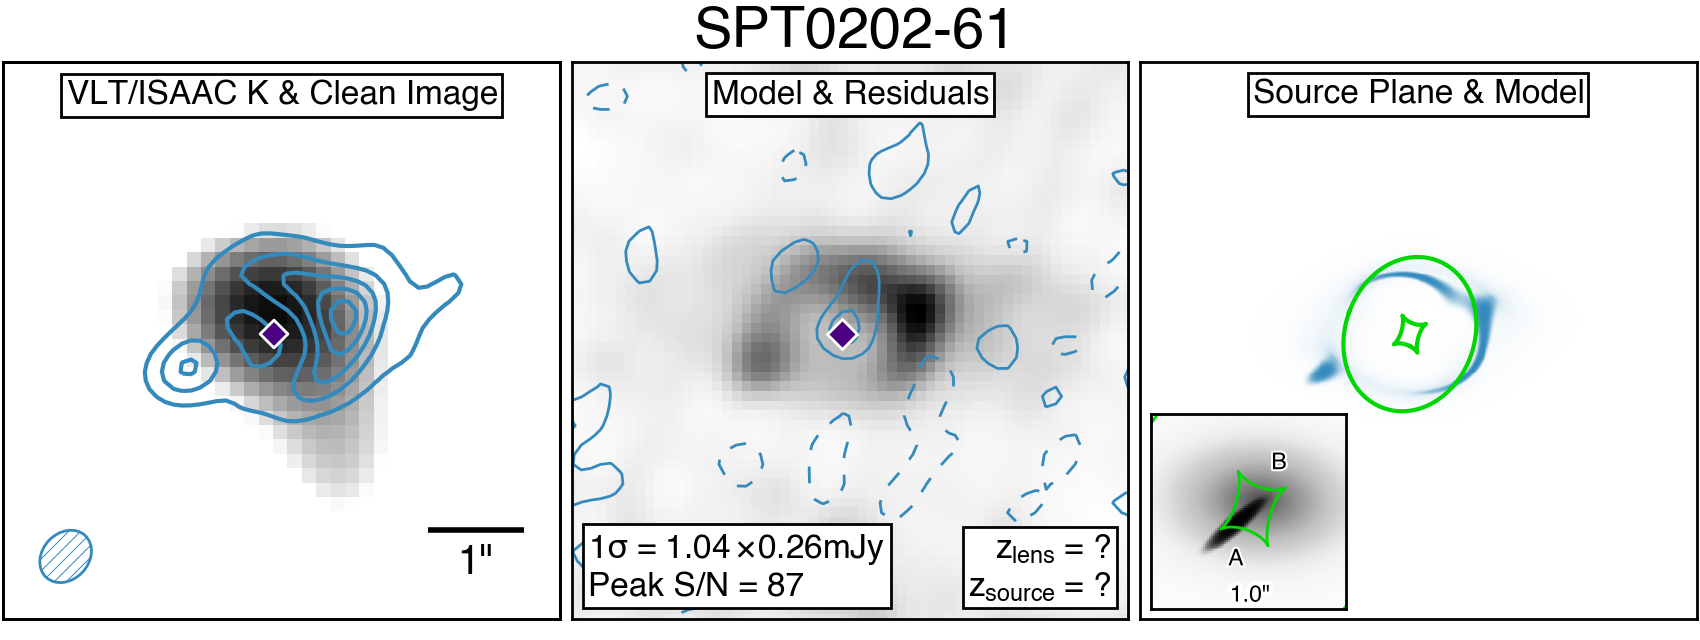
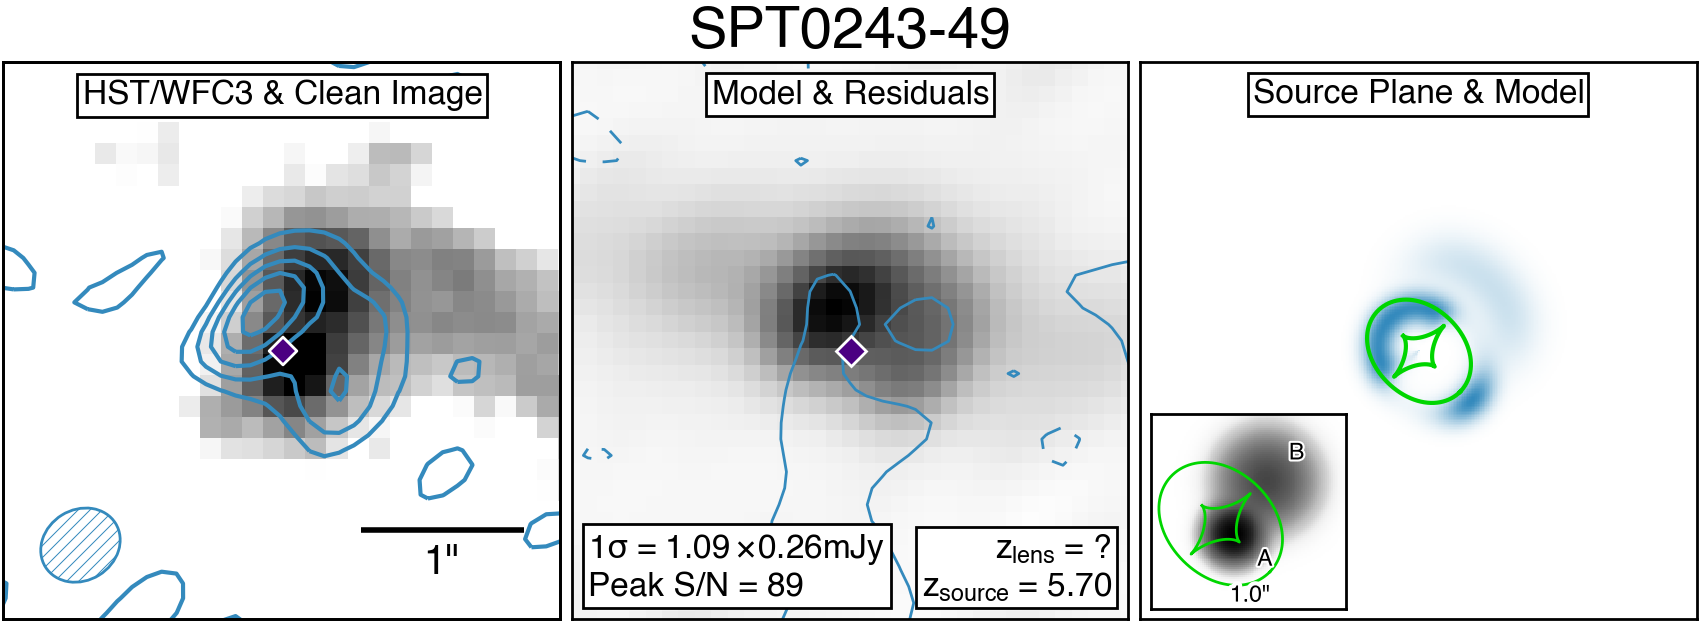
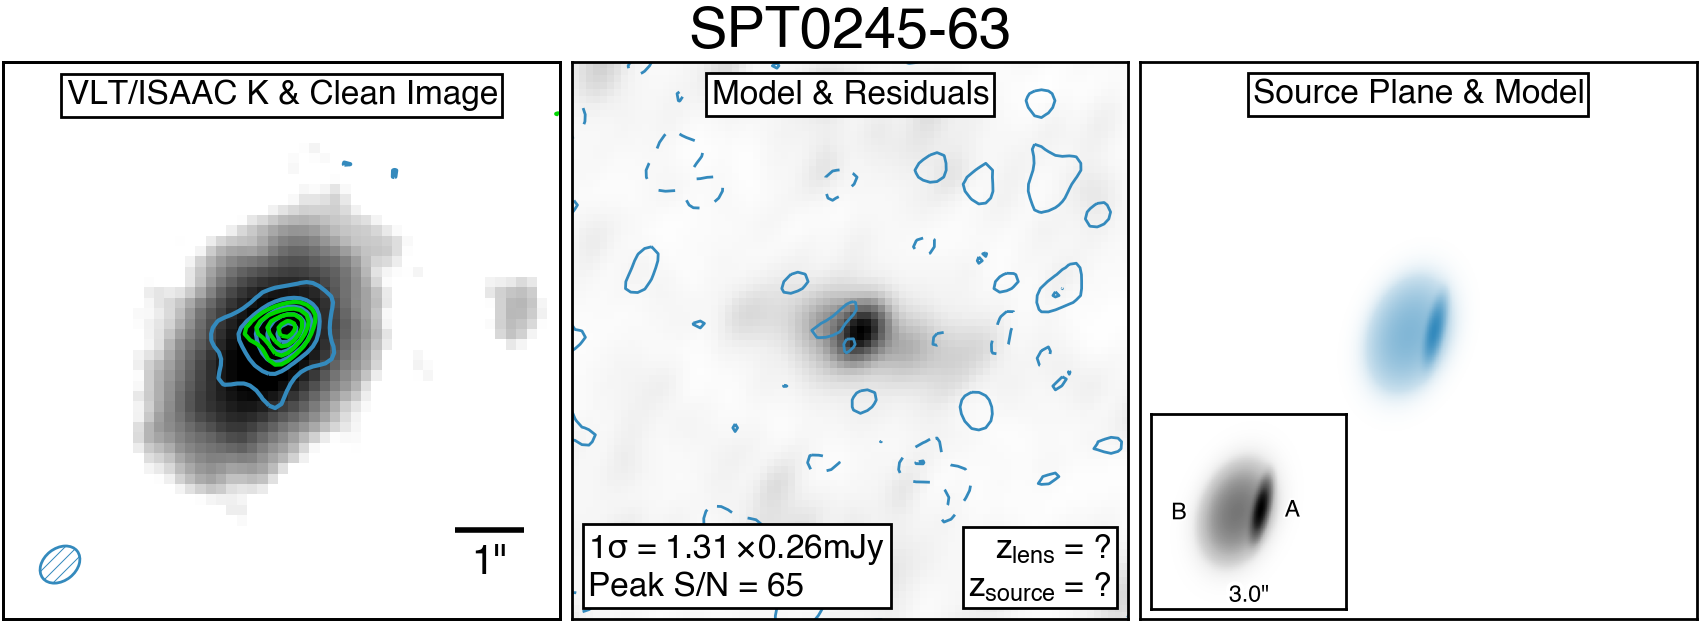
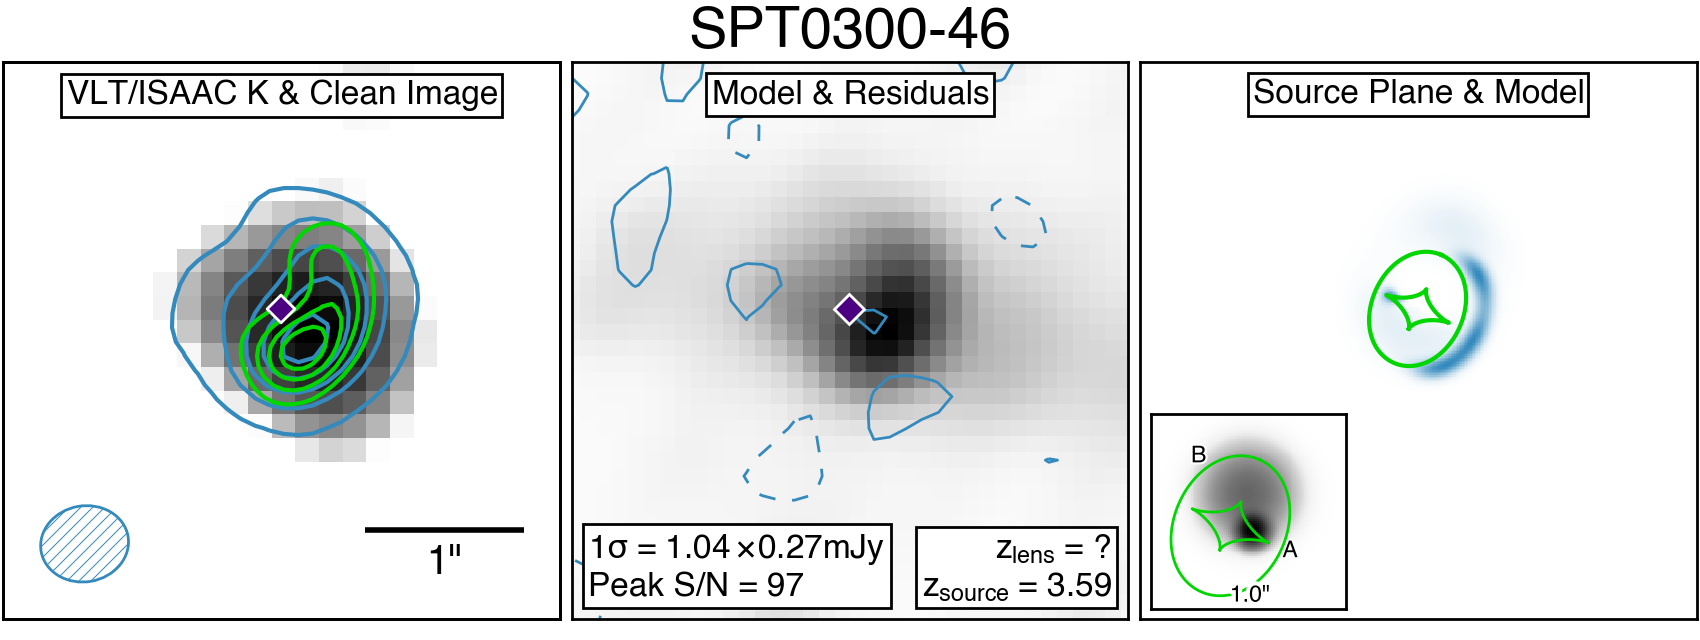
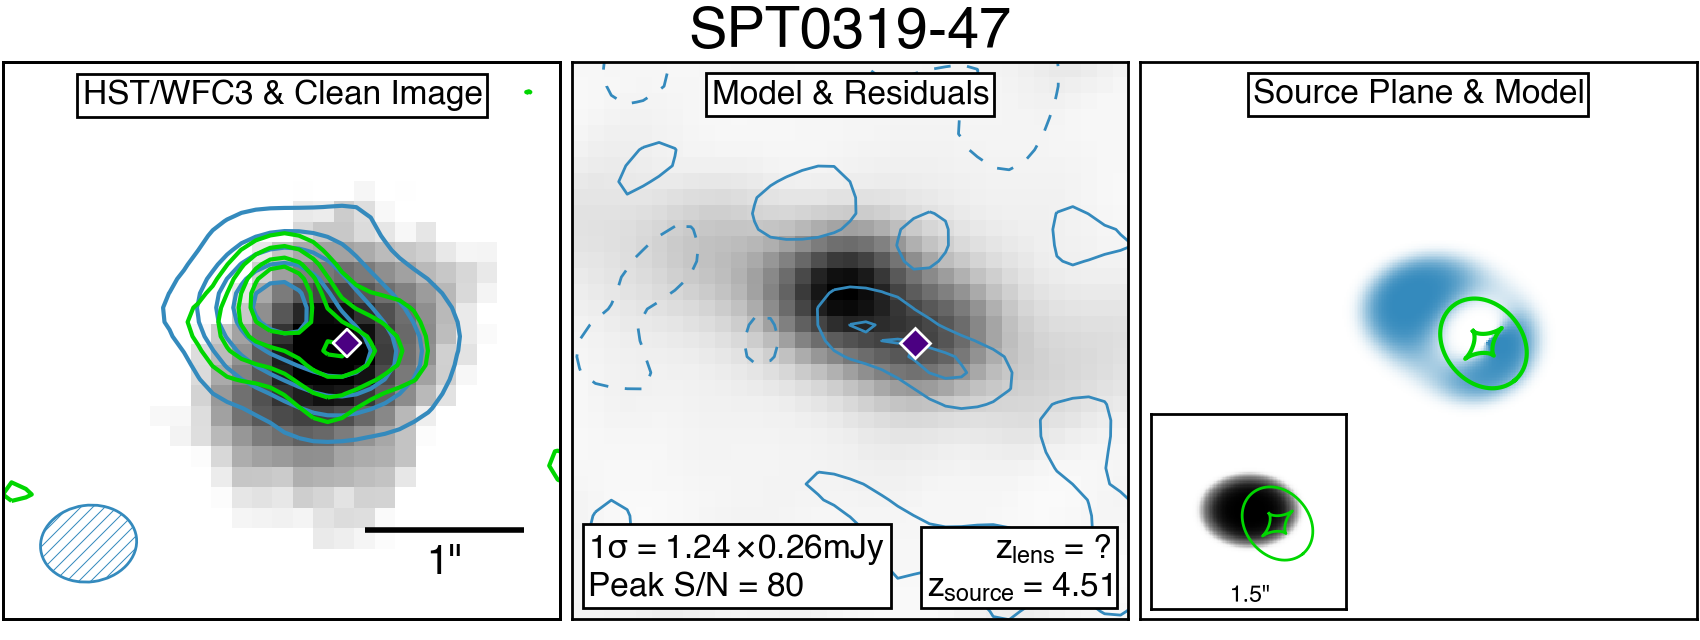
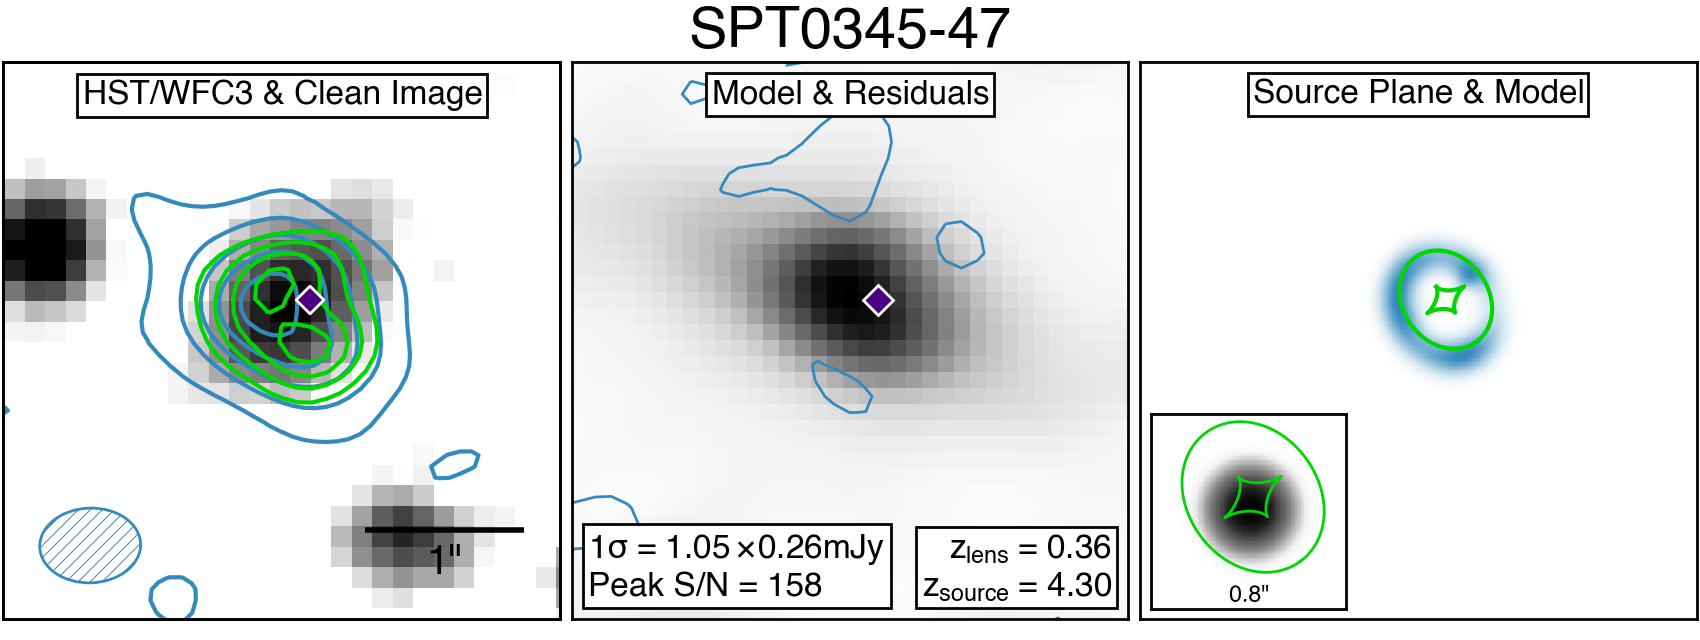
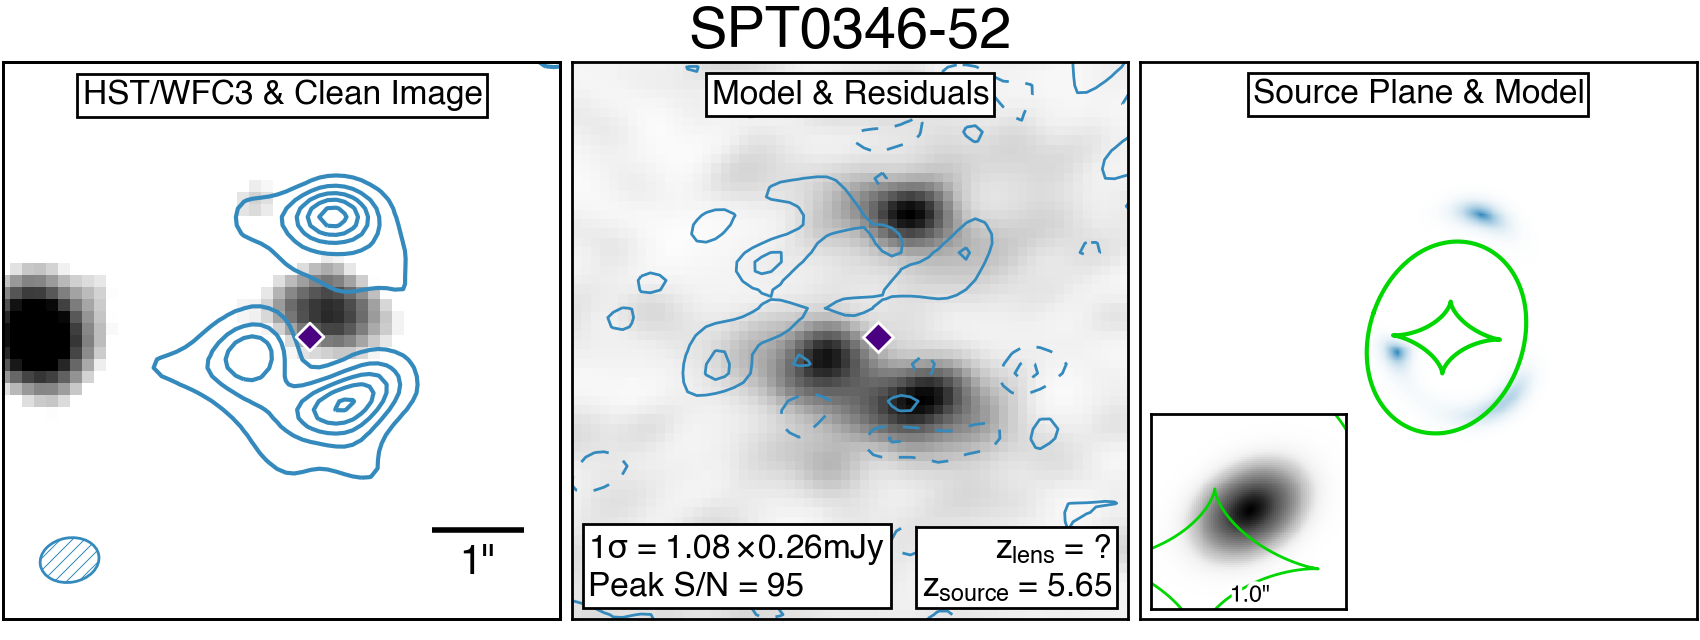
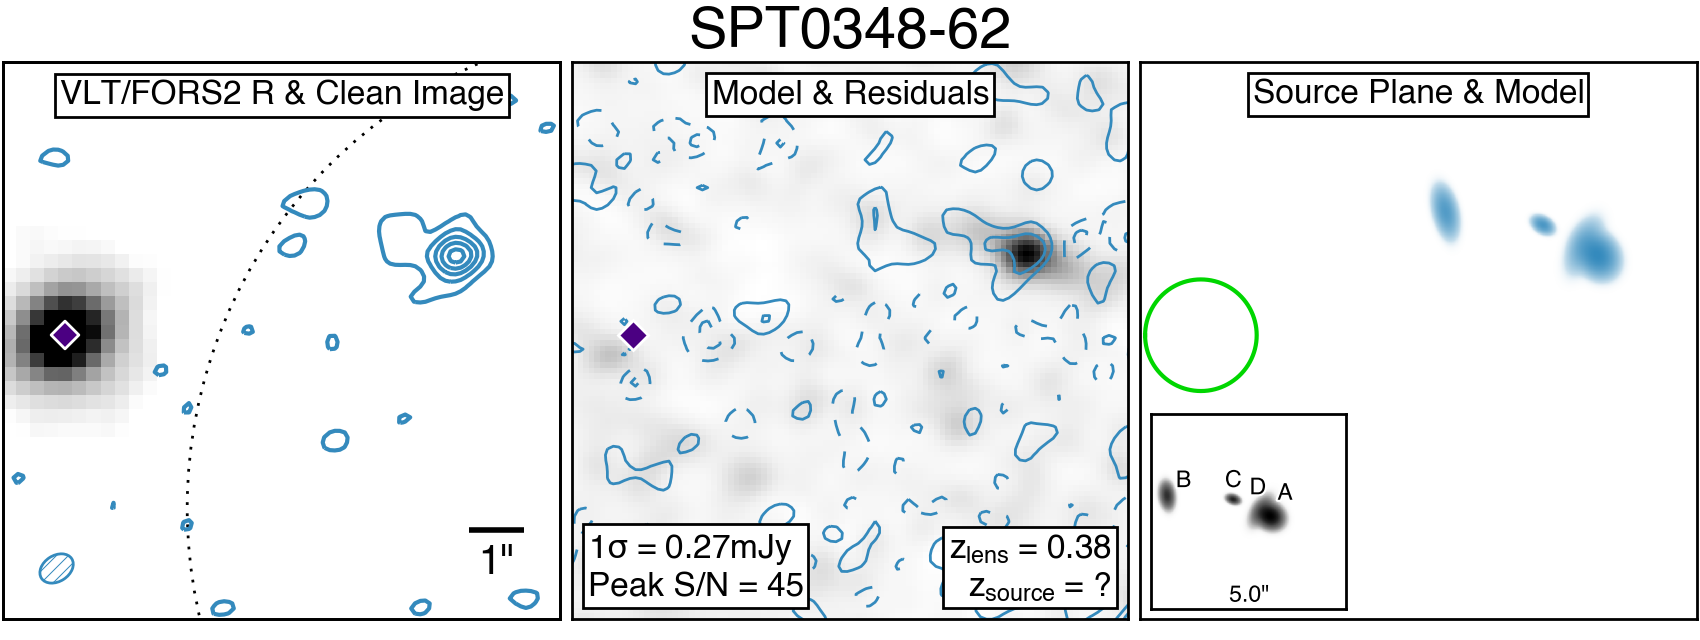
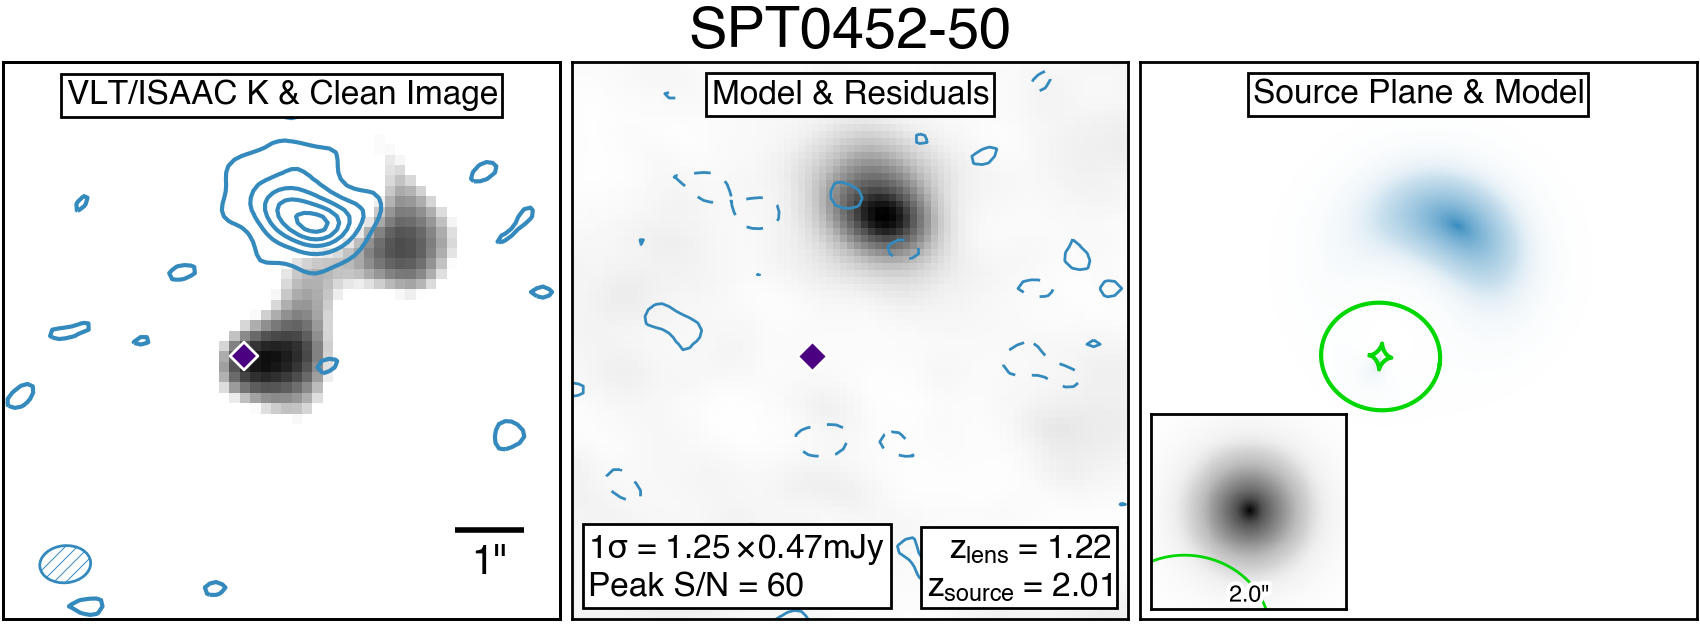
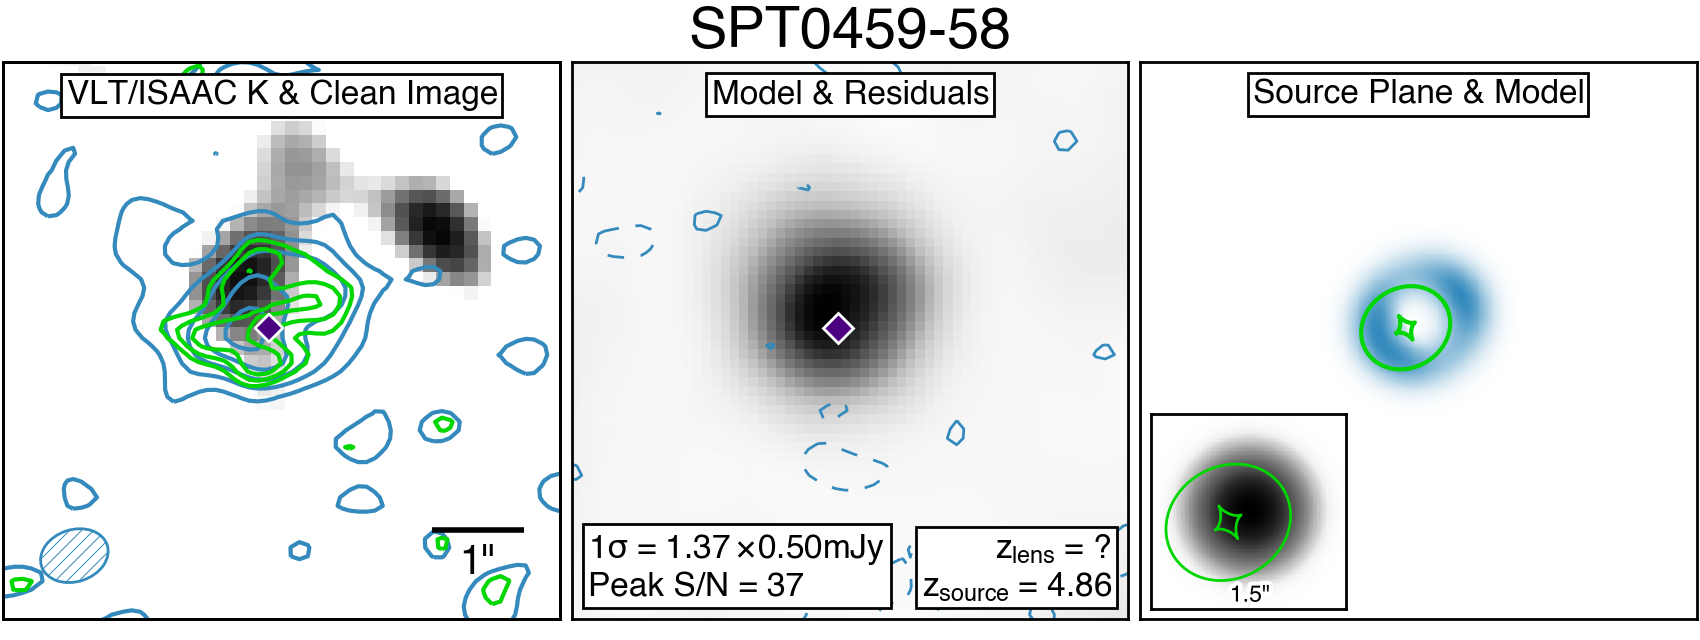
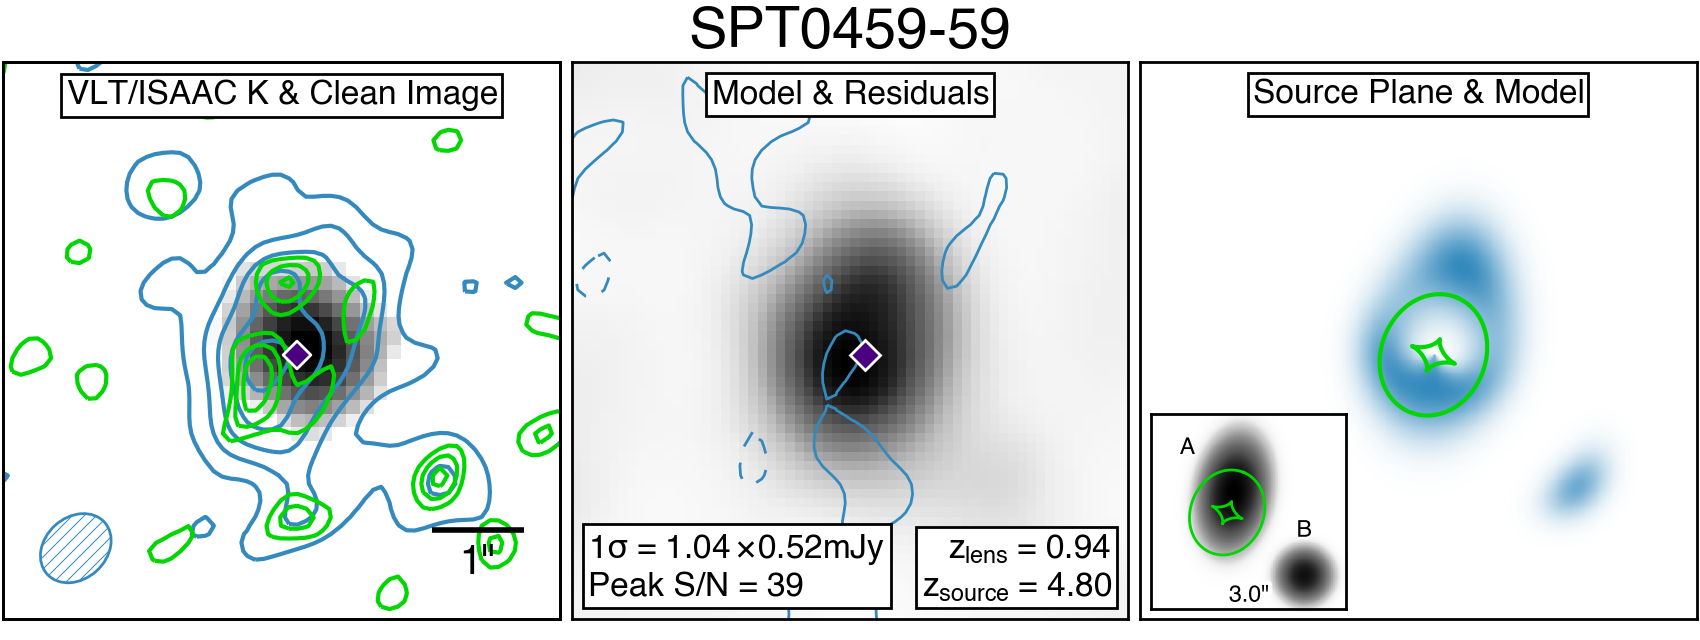
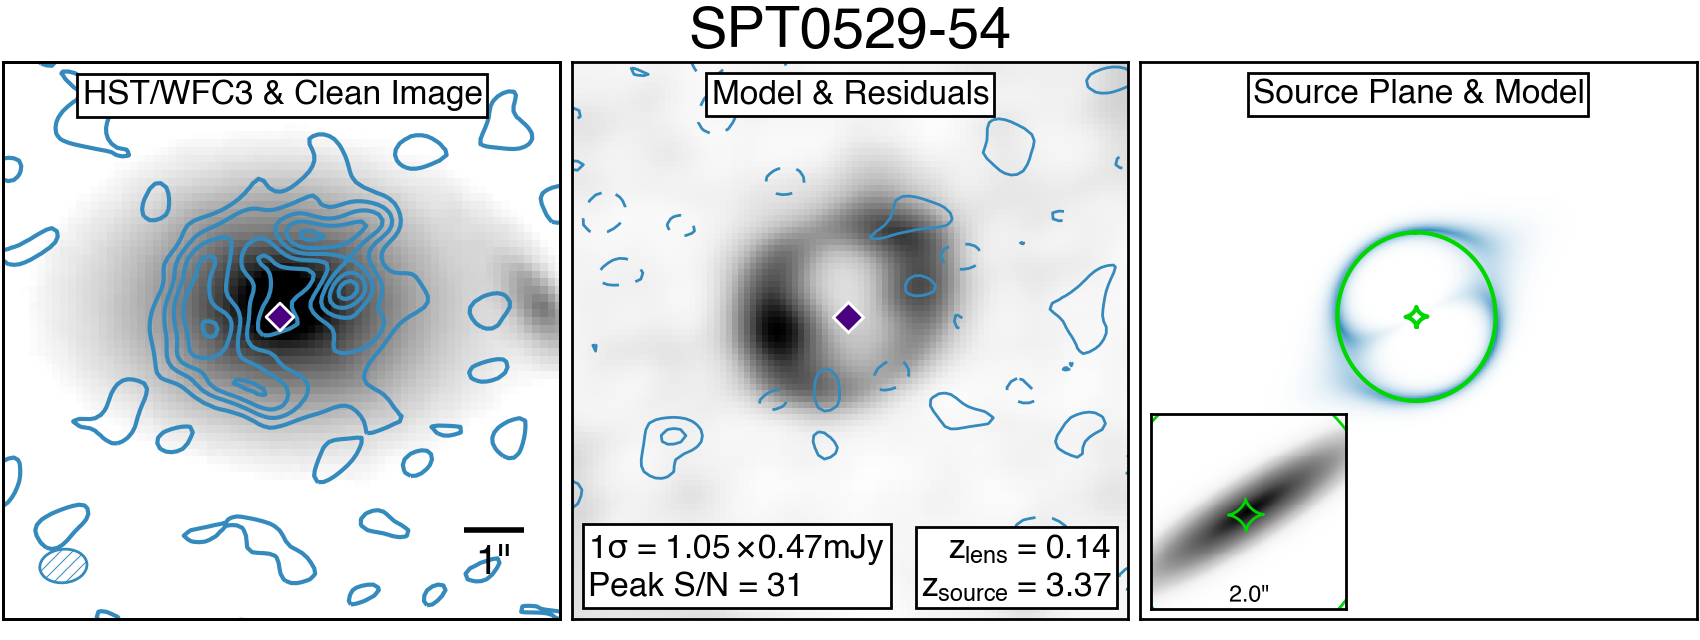
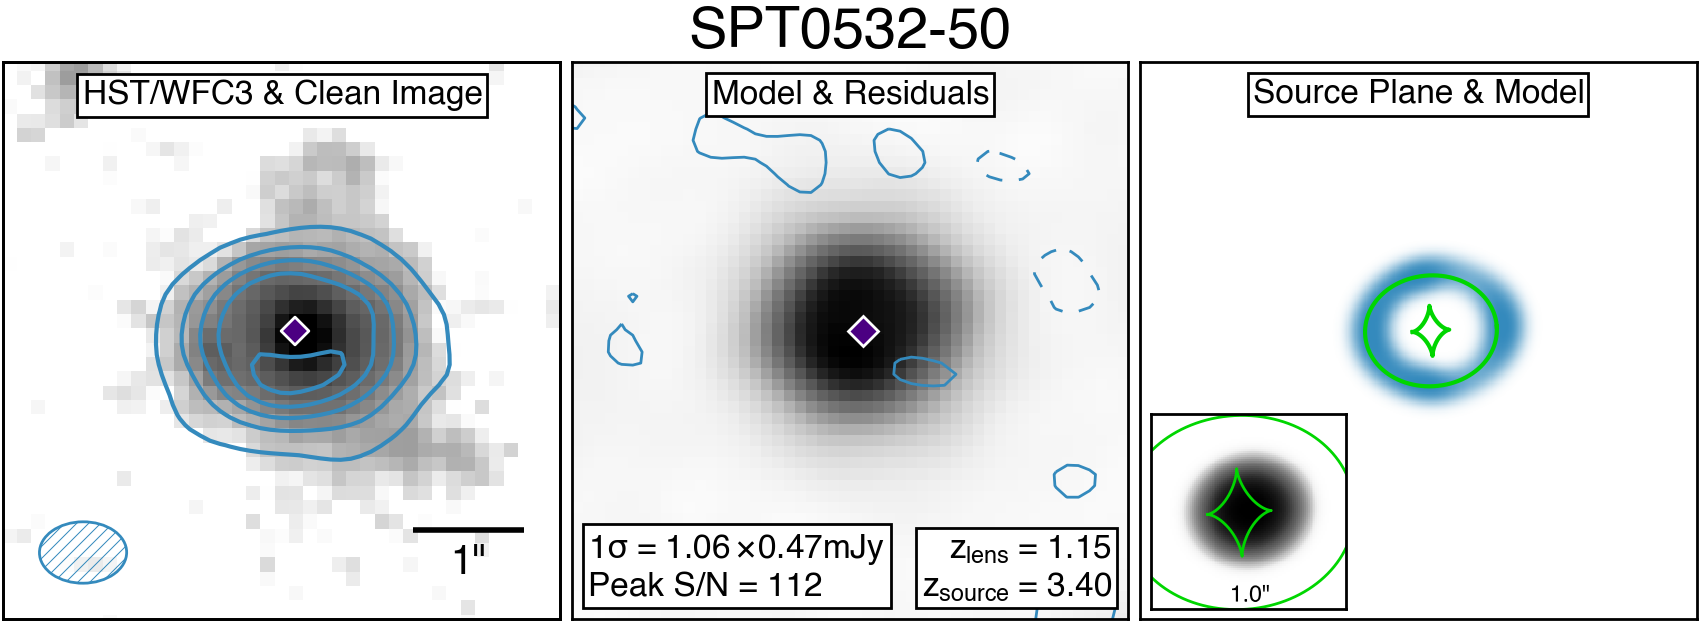
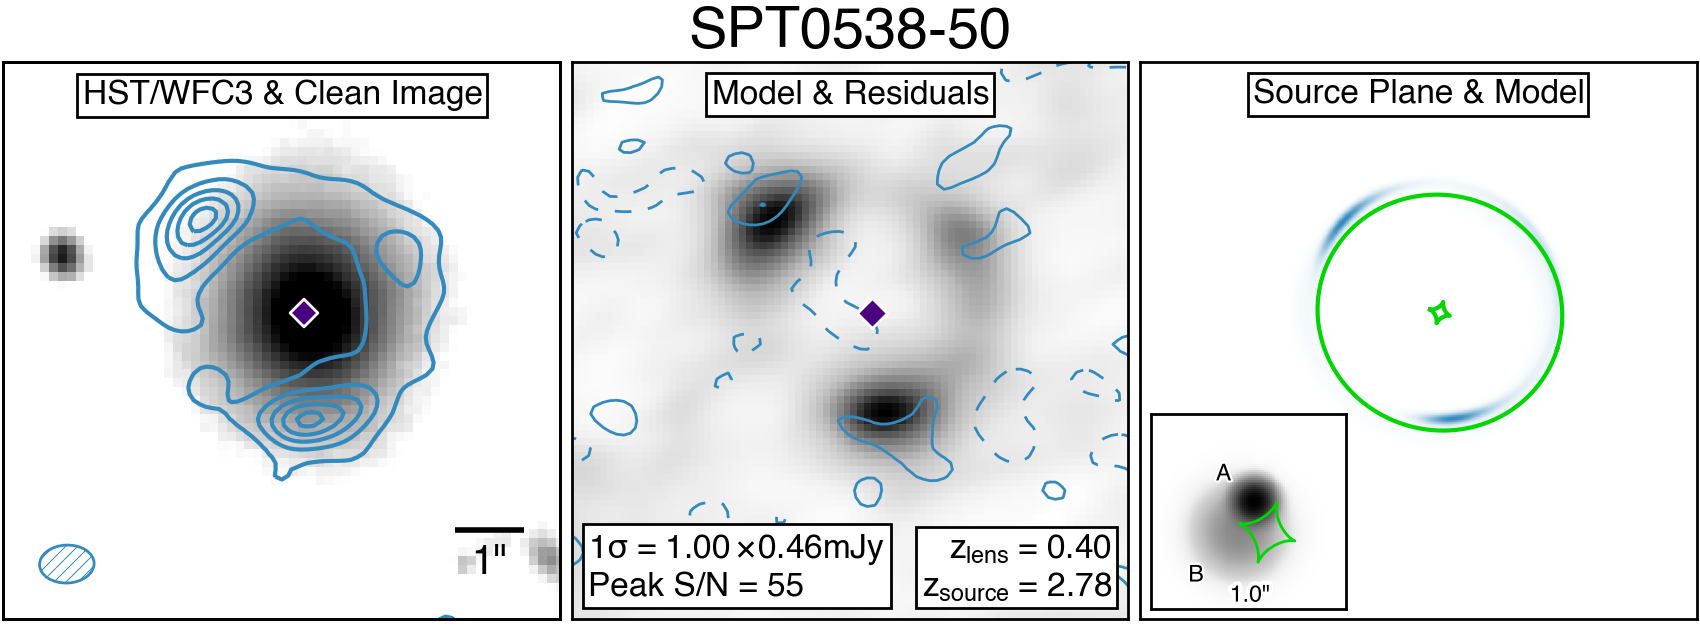
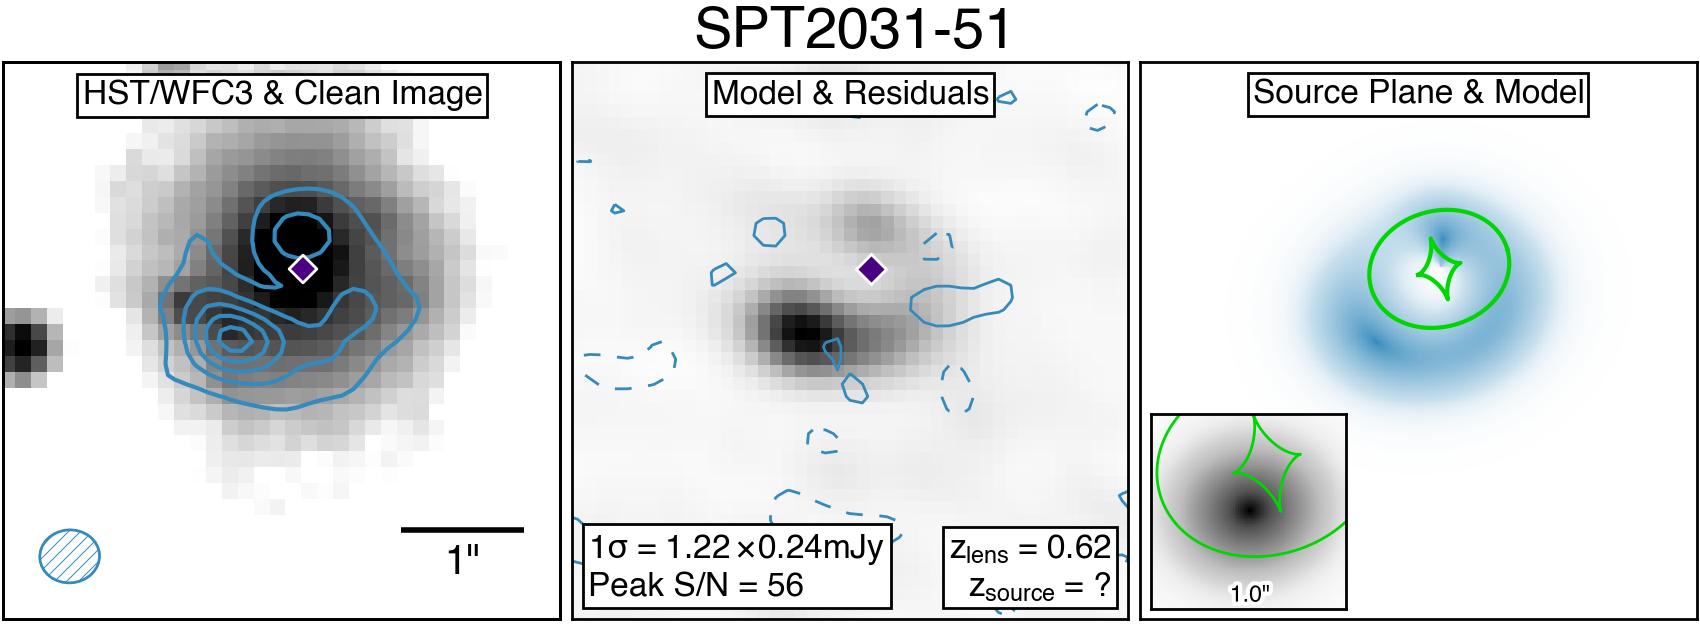
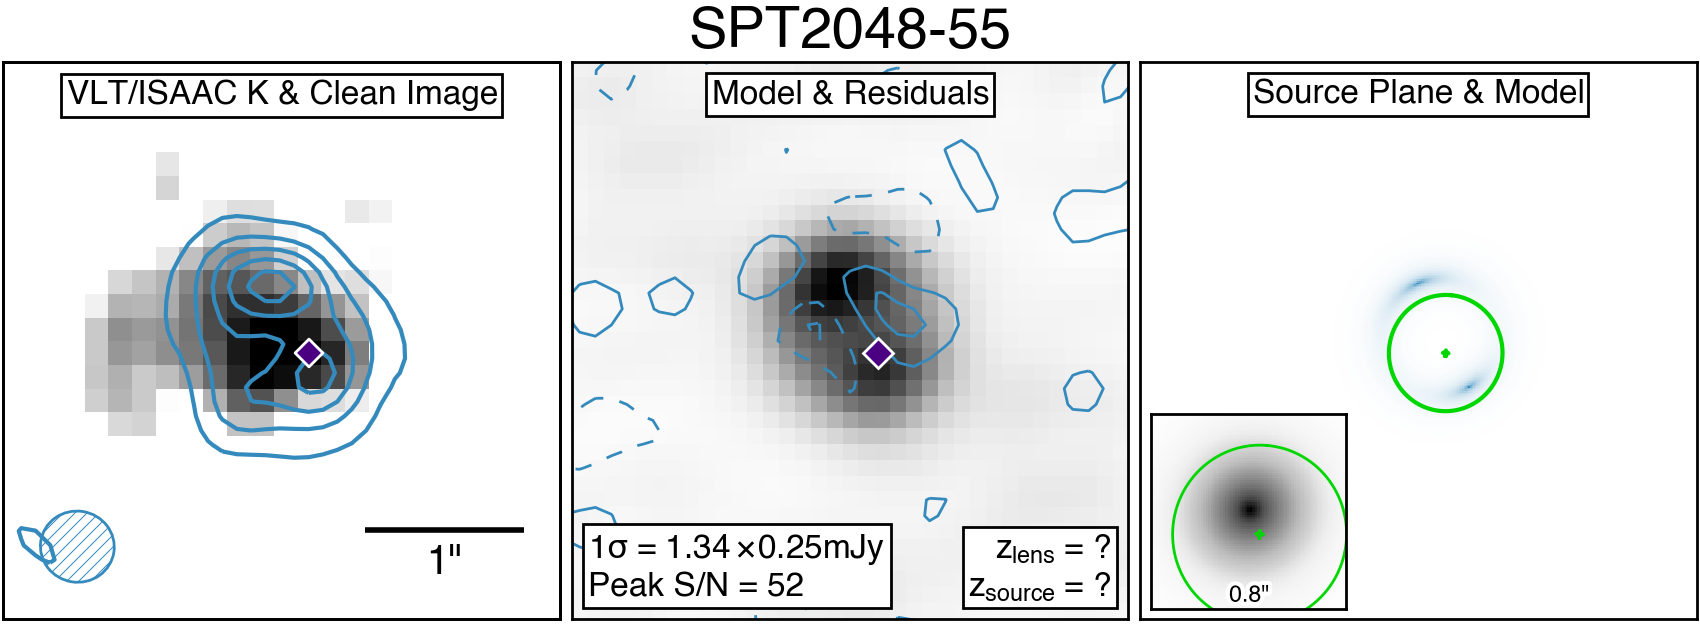
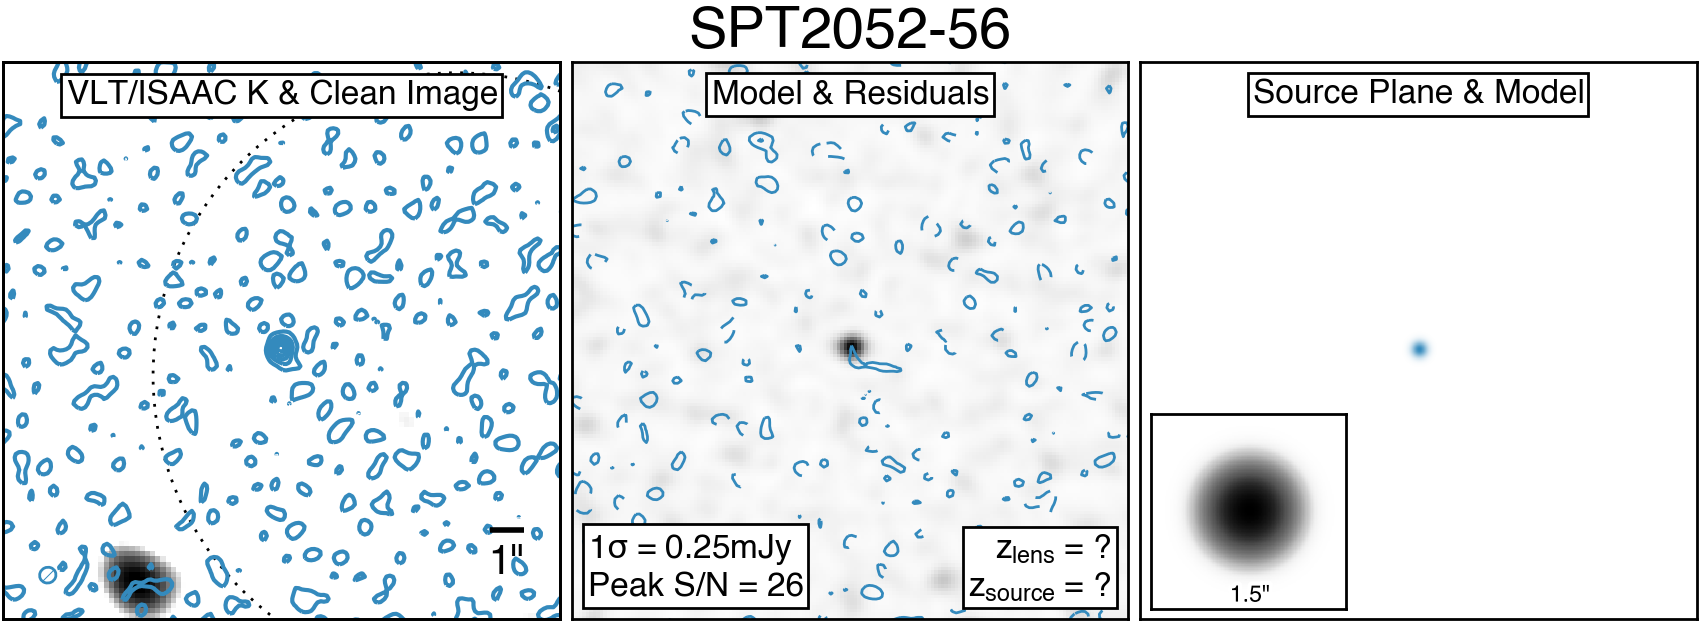
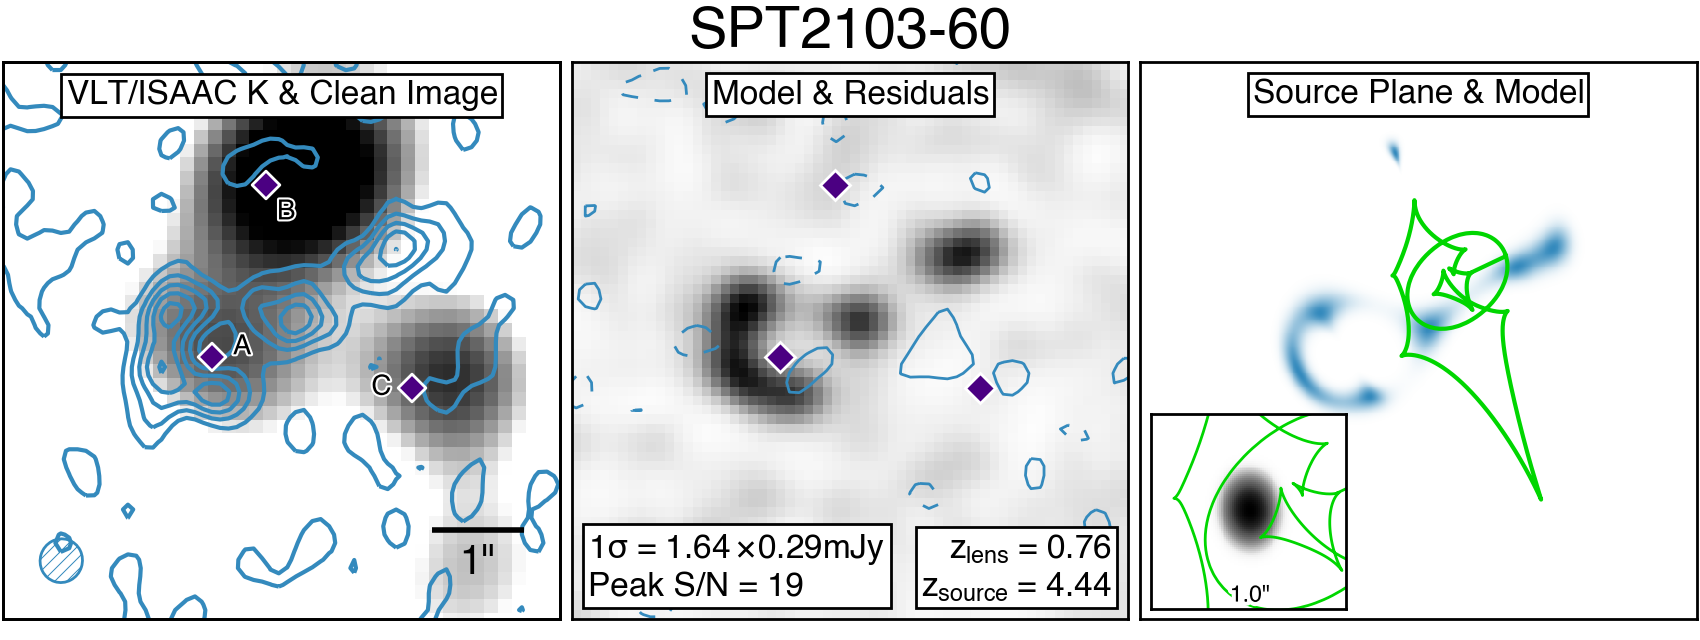
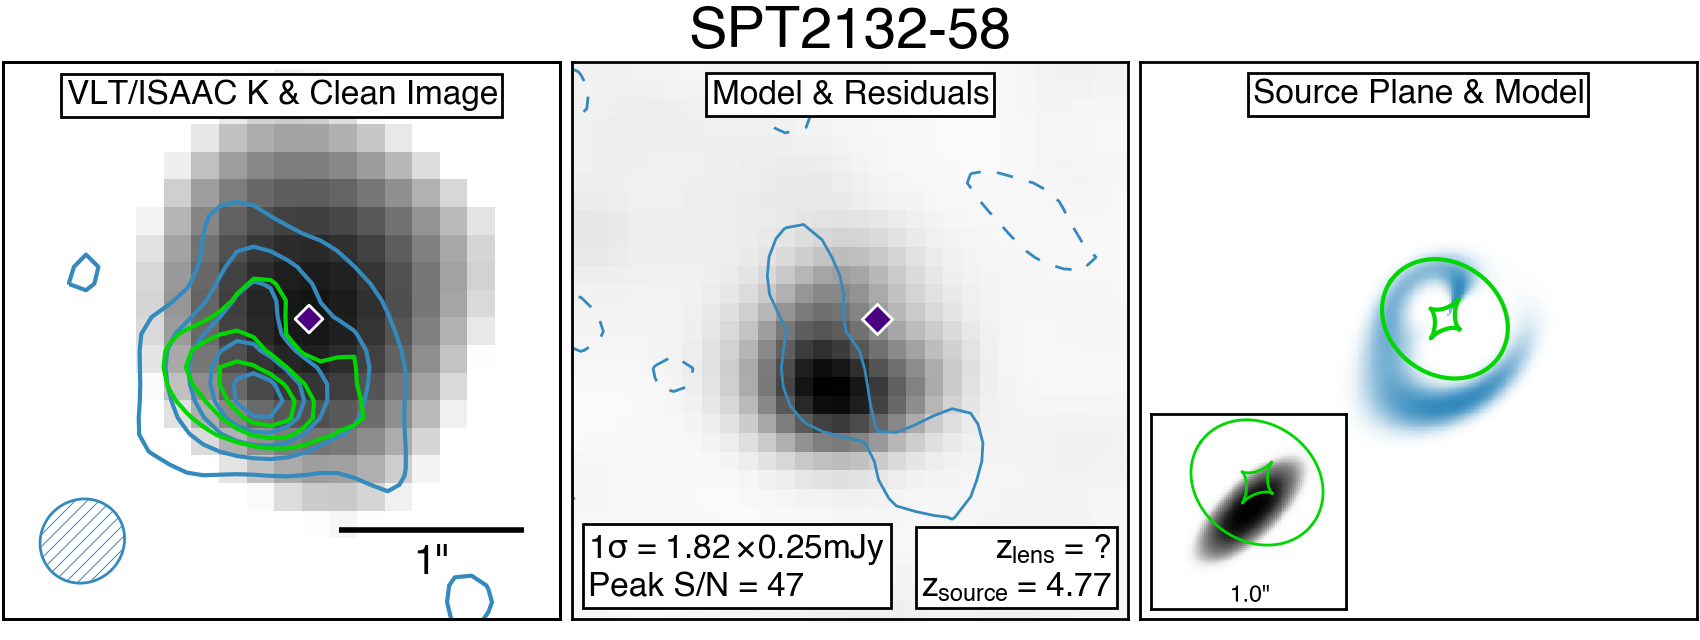
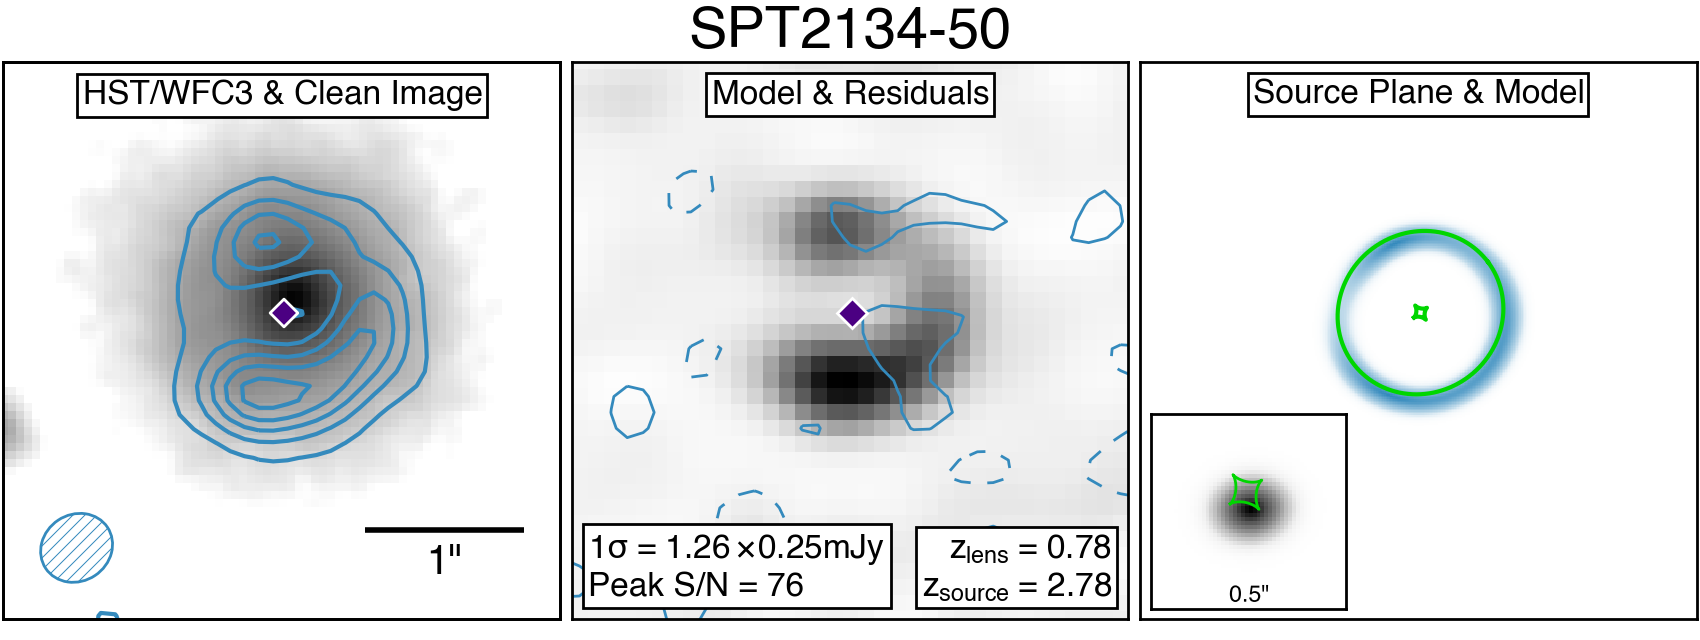
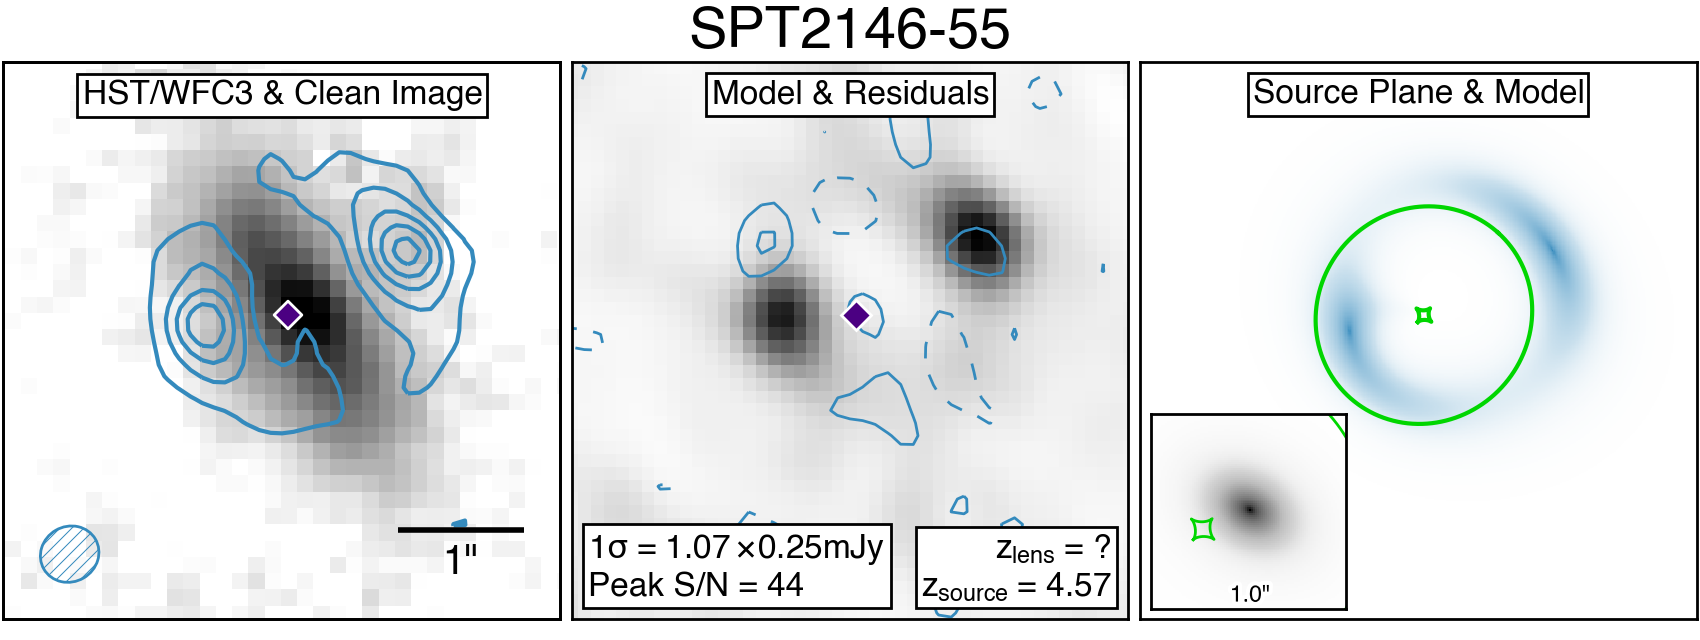
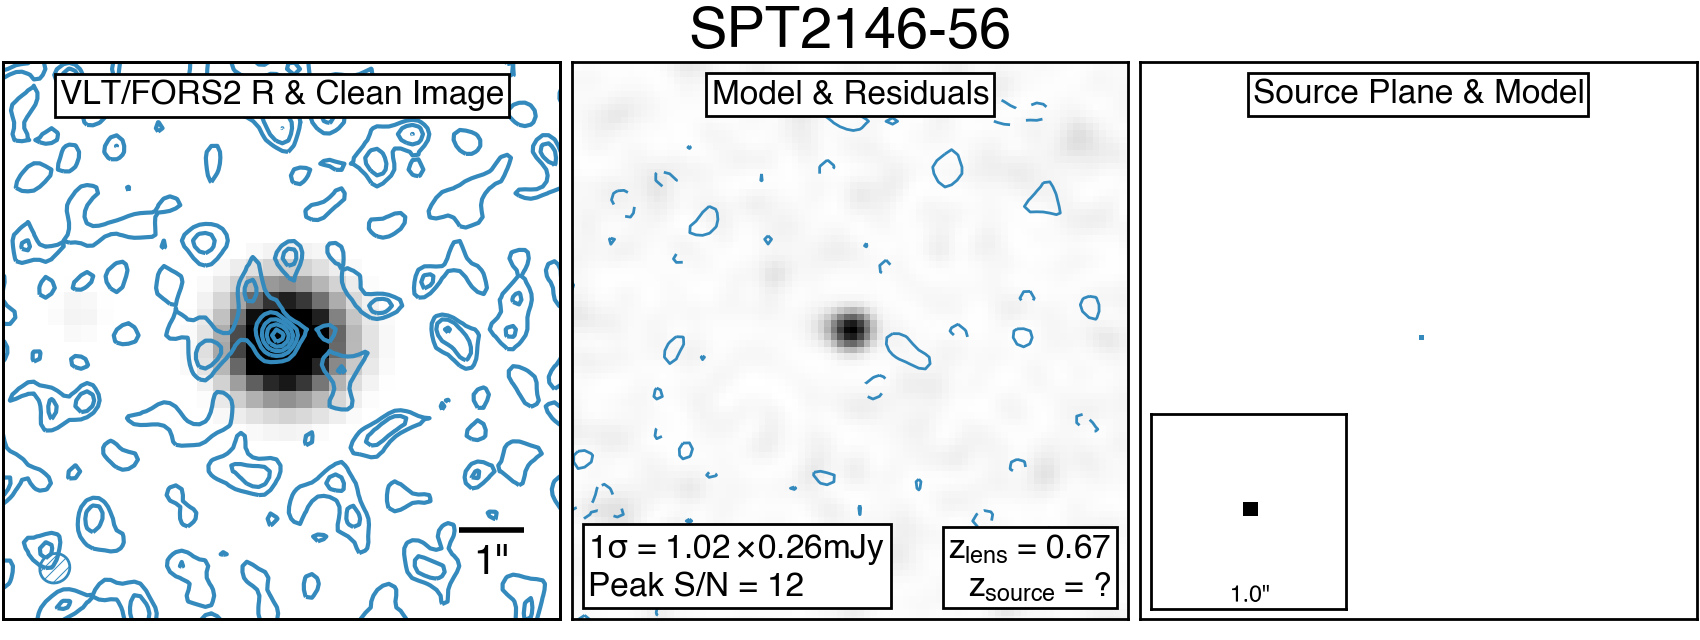
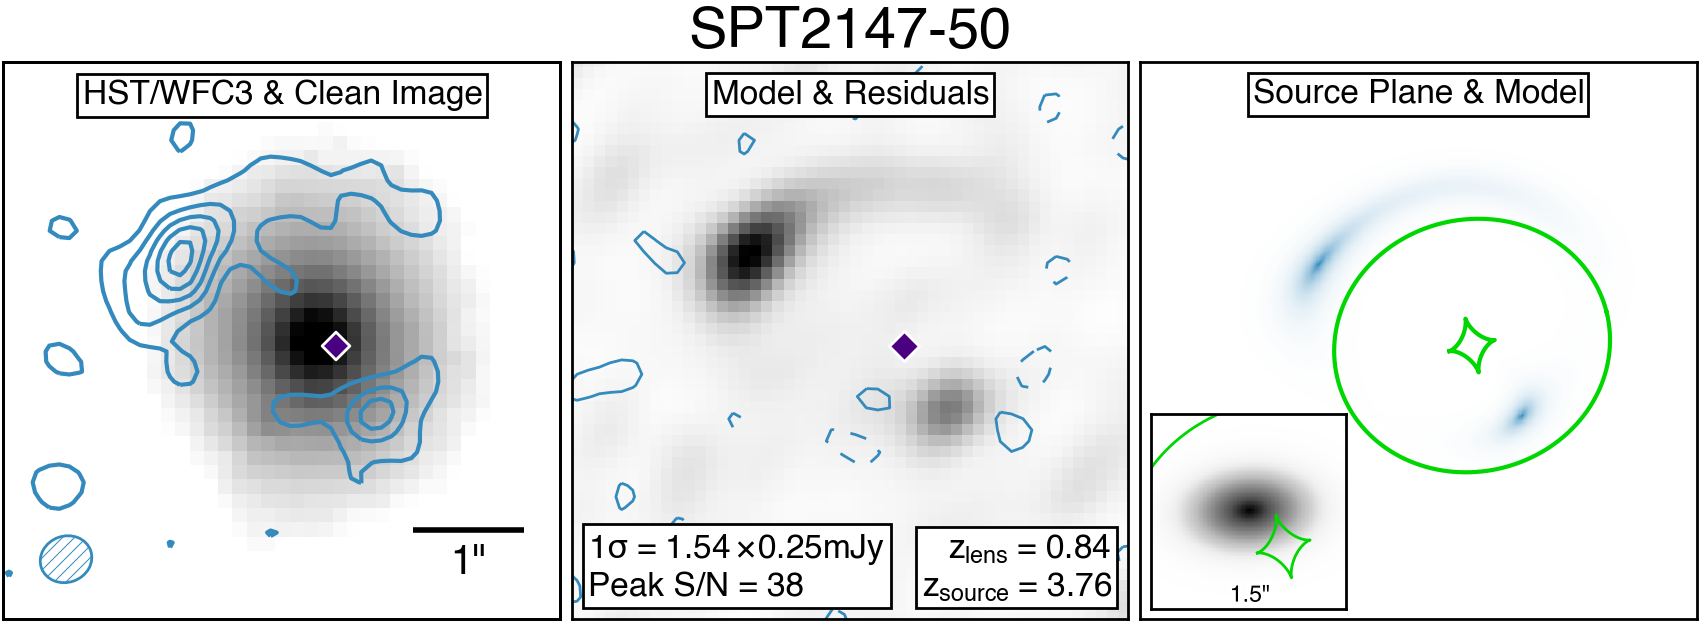
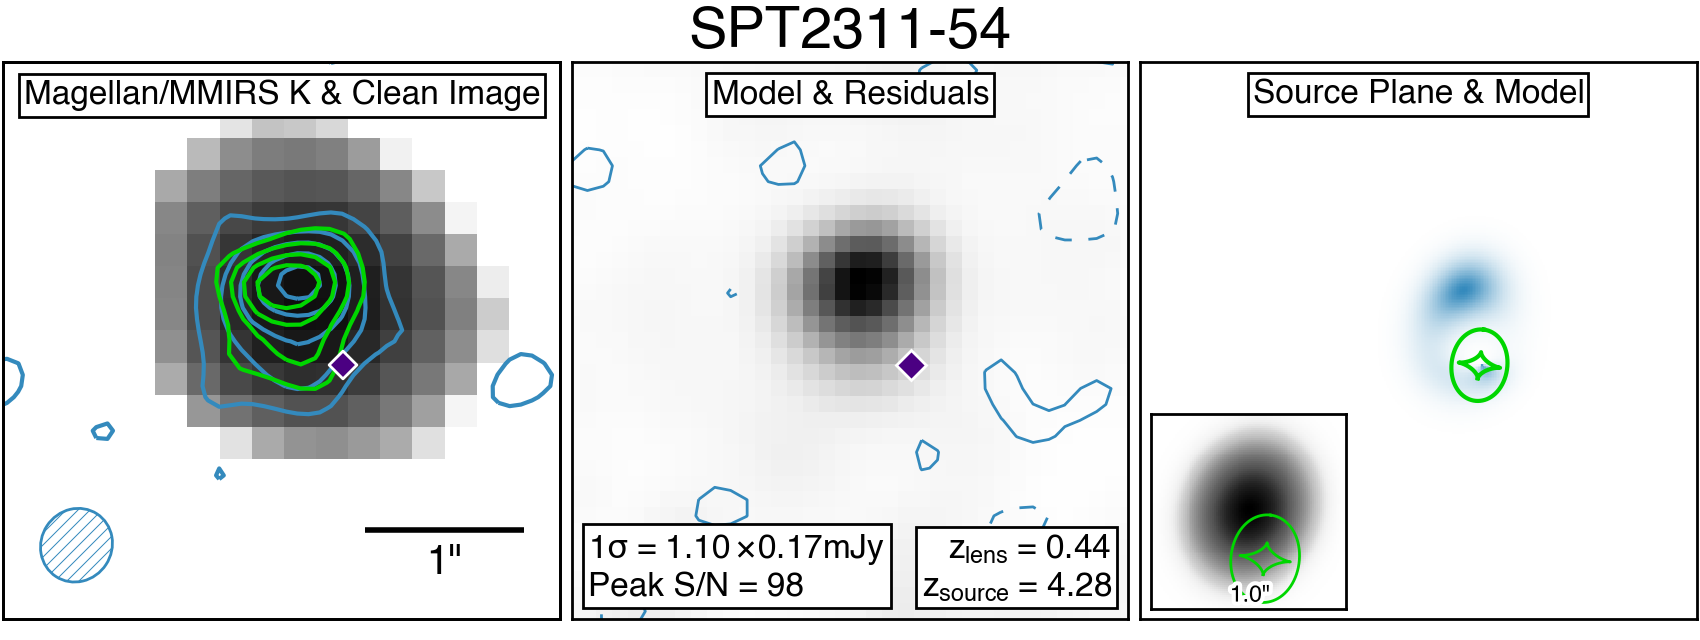
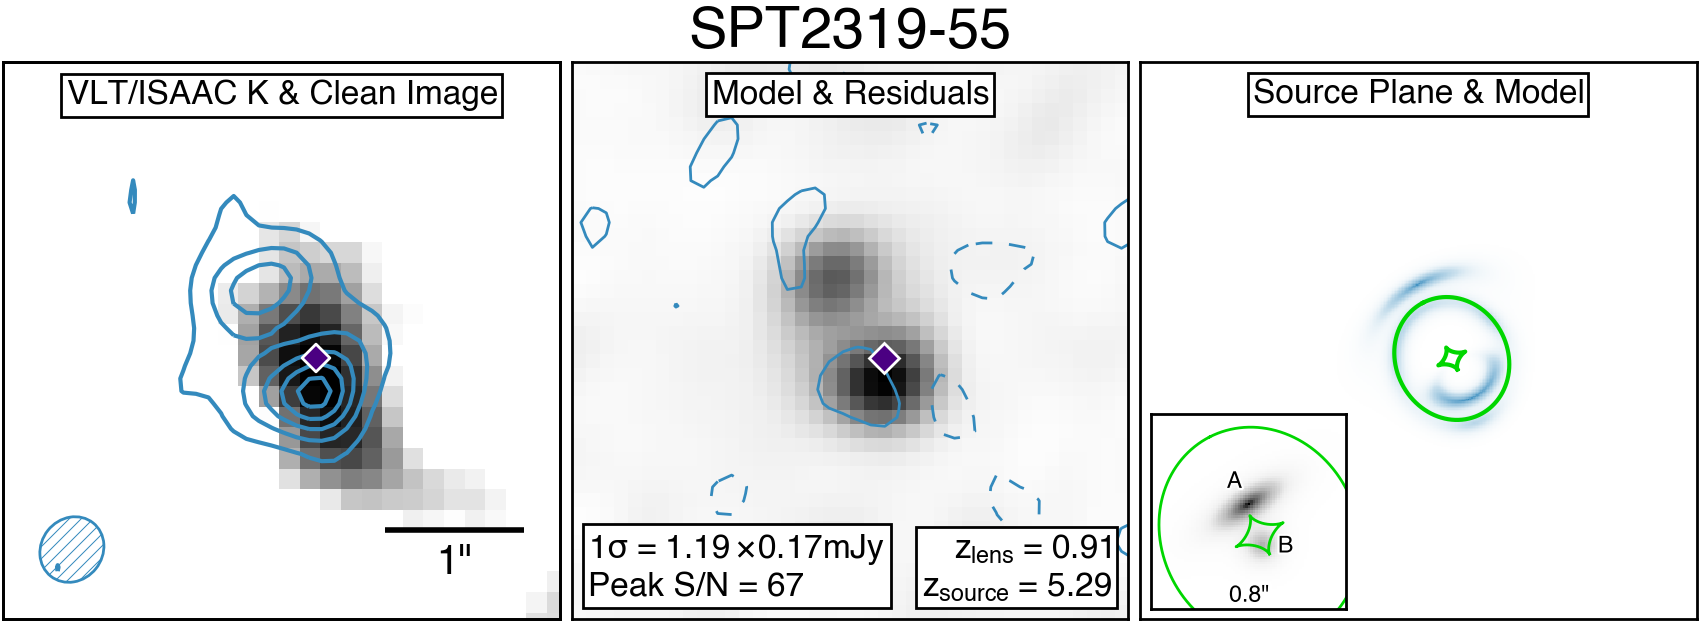
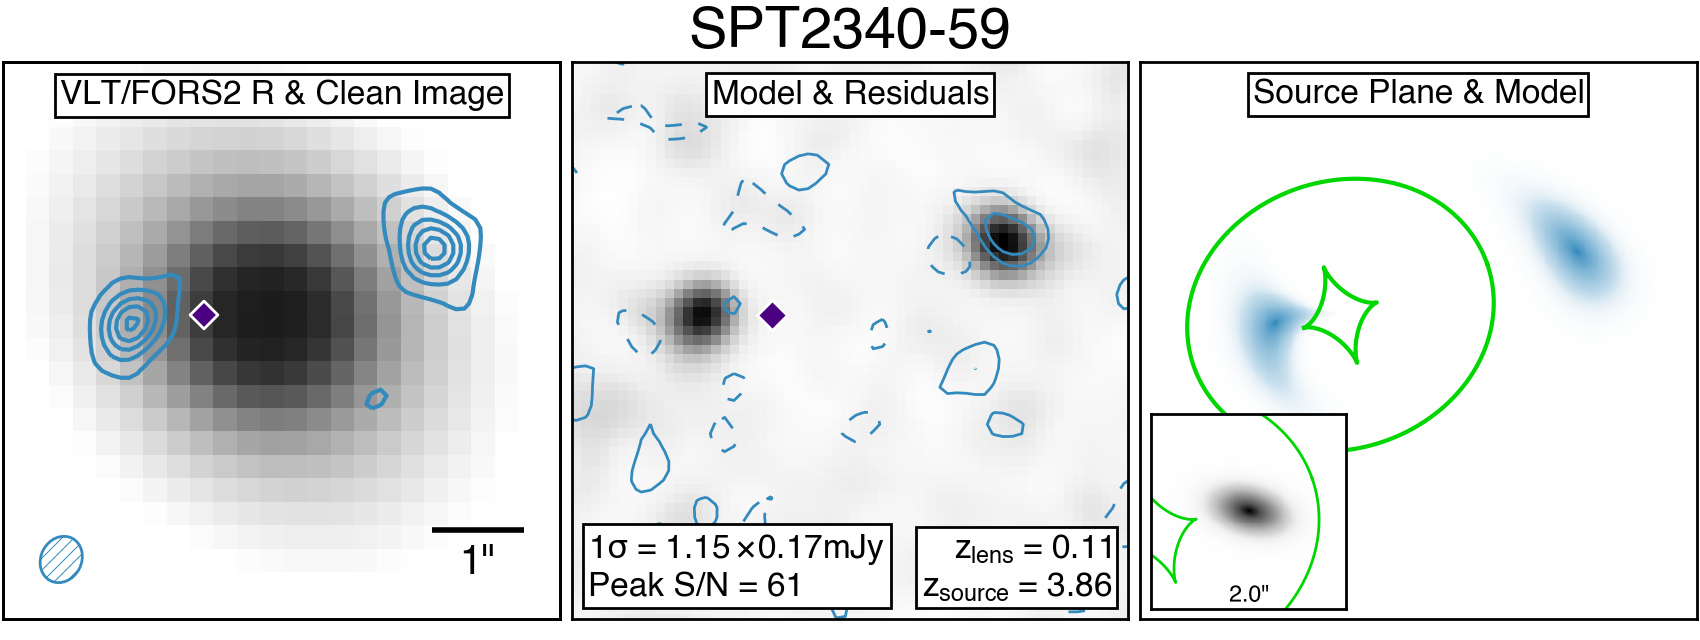
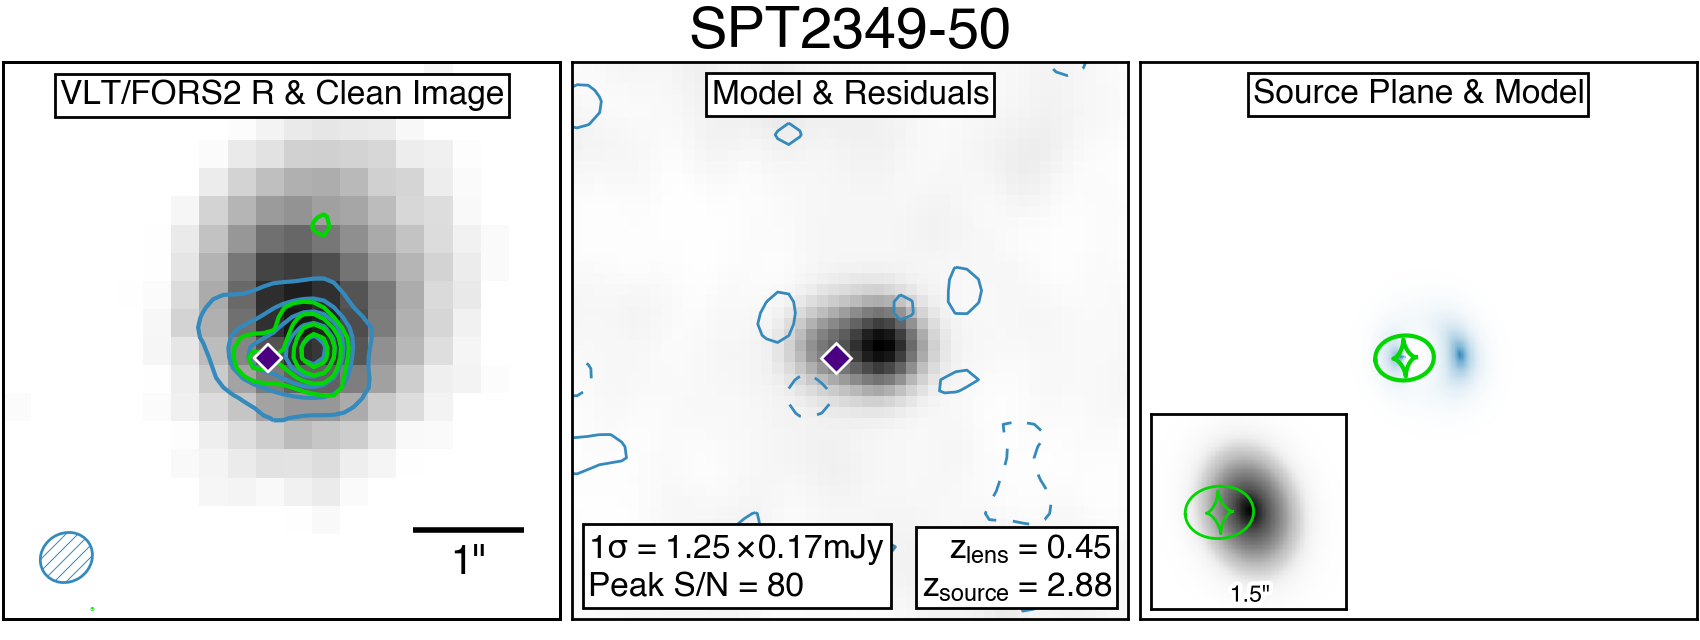
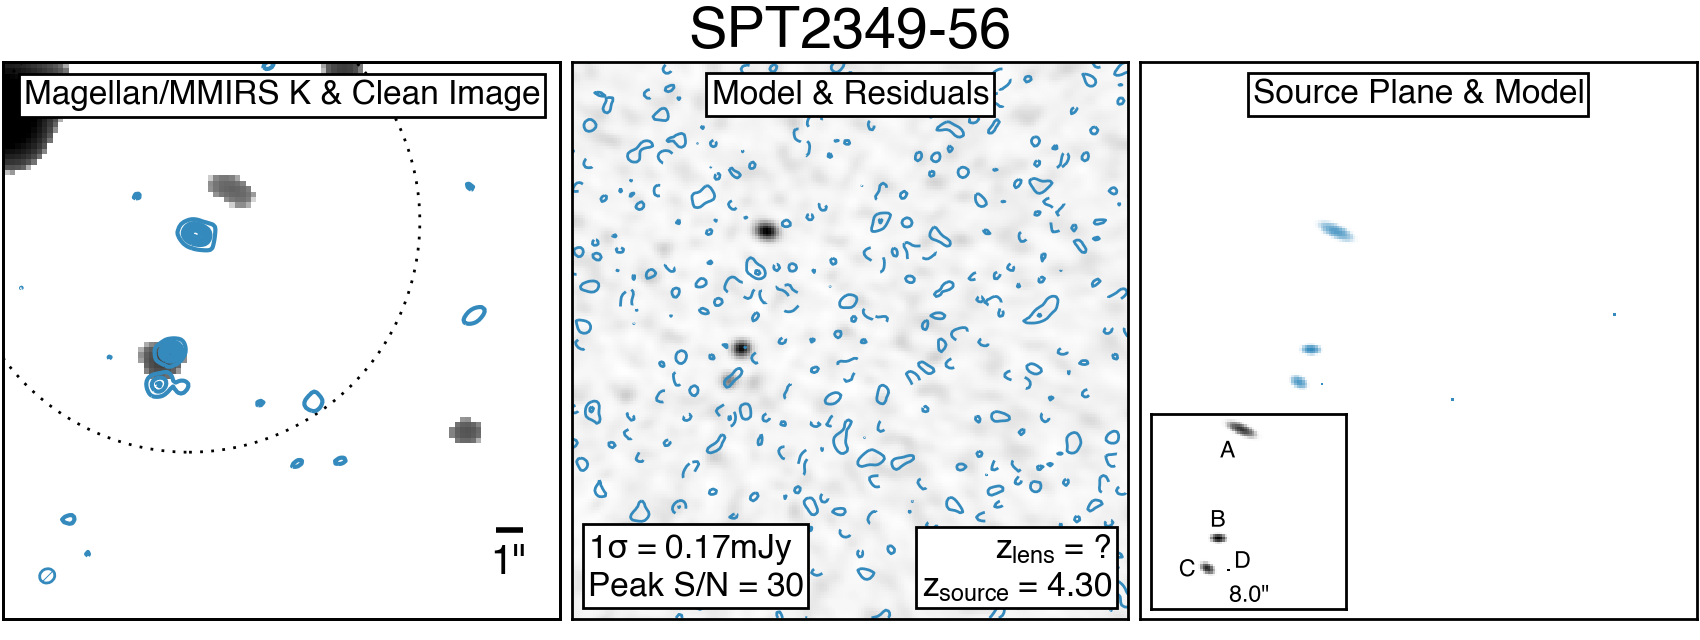
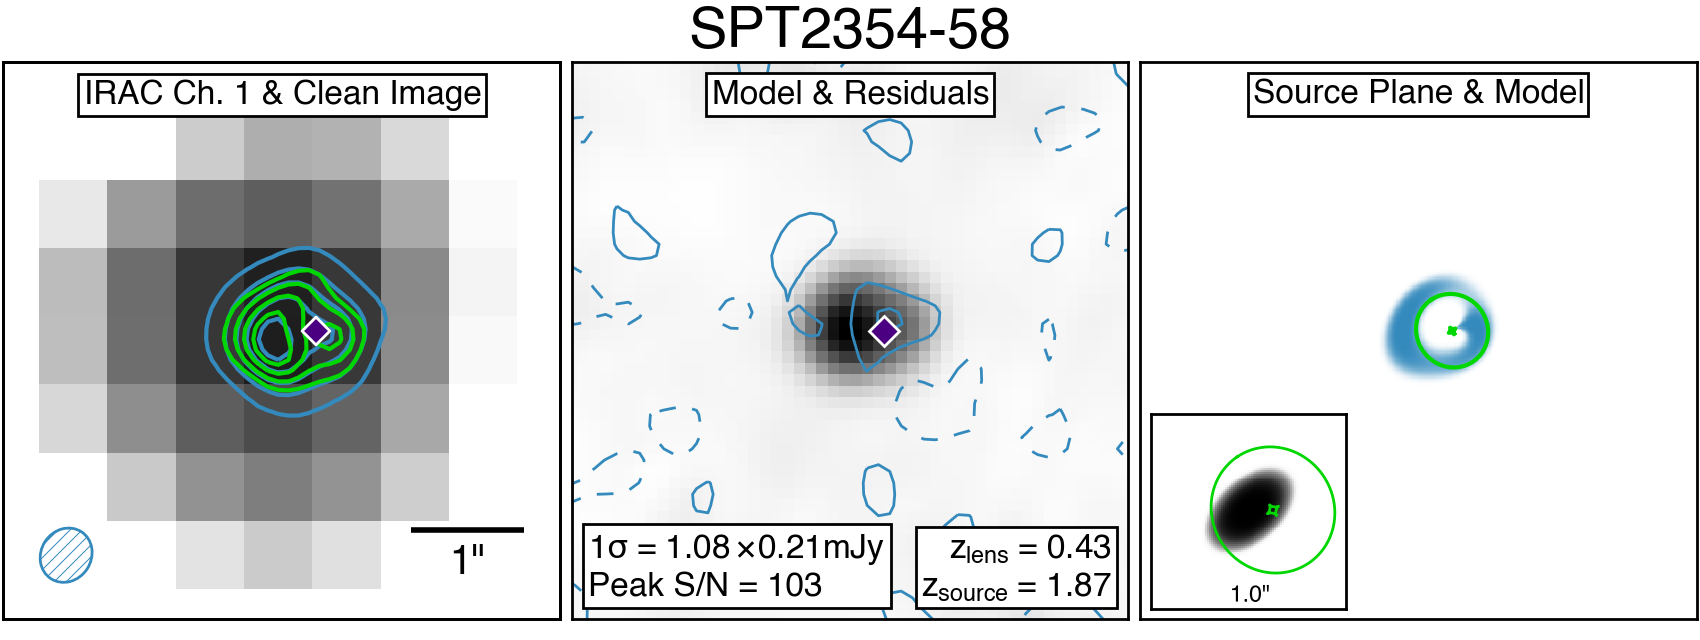
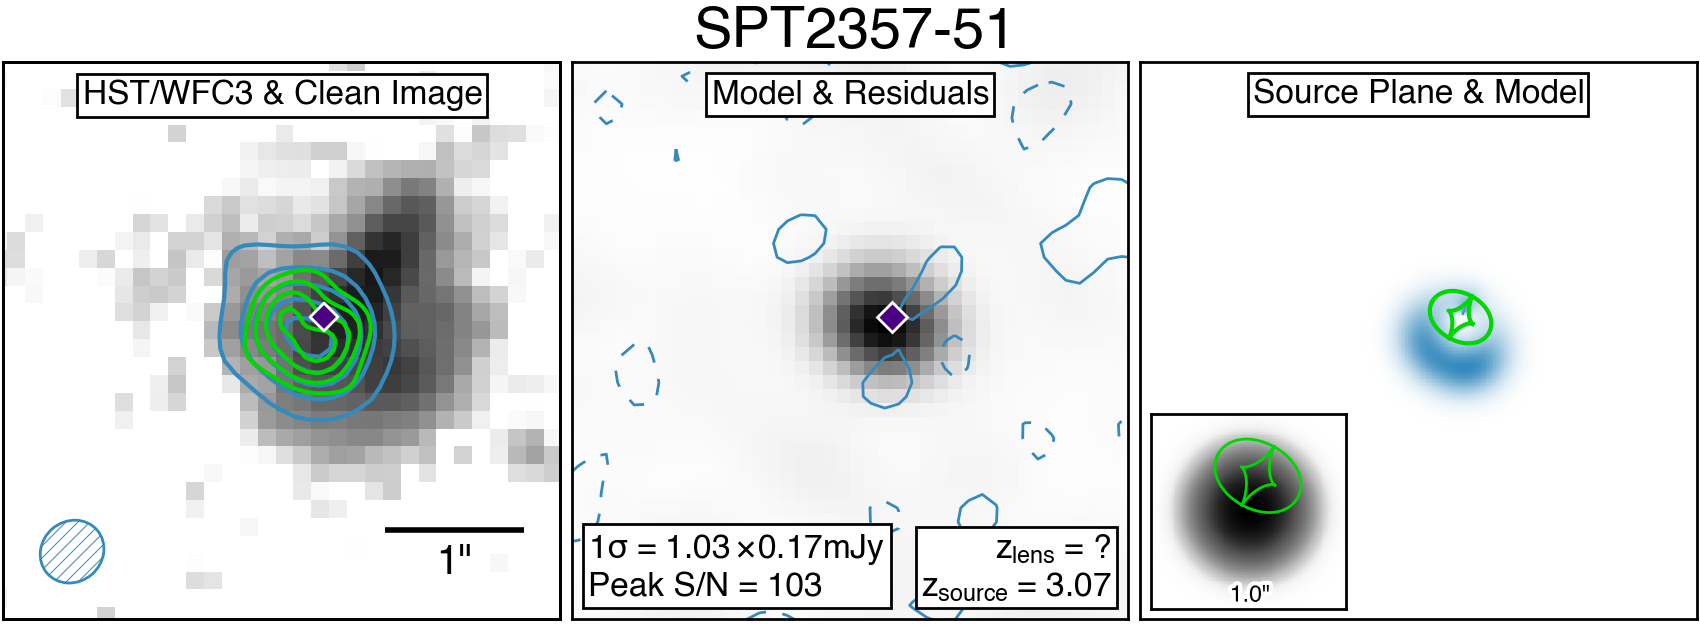
Images of the sources we model in this paper, overlaid on the best-available near-IR or optical imaging, are shown in Fig. 2.

| Short Name | IAU Name | RAALMA | DecALMA | ||||
|---|---|---|---|---|---|---|---|
| mJy | mJy | ||||||
| SPT0020-51 | SPT-S J002023-5146.3 | 00:20:23.45 | -51:46:34.80 | 70 8 | 77 8 | 0.693 | … |
| SPT0027-50 | SPT-S J002706-5007.3 | 00:27:06.84 | -50:07:19.00 | 138 16 | 126 13 | … | … |
| SPT0103-45 | SPT-S J010312-4538.9 | 01:03:11.57 | -45:38:51.90 | 124 14 | 105 11 | 0.740 | 3.0917 |
| SPT0109-47 | SPT-S J010949-4702.1 | 01:09:49.91 | -47:02:09.50 | 109 14 | 82 9 | 0.669 | … |
| SPT0113-46 | SPT-S J011308-4617.7 | 01:13:09.03 | -46:17:56.90 | 79 11 | 54 6 | … | 4.2328 |
| SPT0125-47 | SPT-S J012507-4723.8 | 01:25:07.18 | -47:23:55.50 | 144 17 | 144 15 | 0.305 | 2.5148 |
| SPT0125-50 | SPT-S J012549-5038.3 | 01:25:48.41 | -50:38:17.40 | 109 14 | 81 9 | 0.510 | 3.9593 |
| SPT0128-51 | SPT-S J012809-5129.7 | 01:28:09.87 | -51:29:43.80 | 19 3 | 17 4 | … | … |
| SPT0202-61 | SPT-S J020258-6121.2 | 02:02:58.86 | -61:21:13.20 | 109 13 | 81 9 | … | … |
| SPT0243-49 | SPT-S J024308-4915.6 | 02:43:09.07 | -49:15:33.00 | 84 10 | 57 7 | … | 5.6991 |
| SPT0245-63 | SPT-S J024544-6320.7 | 02:45:44.23 | -63:20:44.30 | 61 8 | 48 6 | … | … |
| SPT0300-46 | SPT-S J030004-4621.4 | 03:00:04.21 | -46:21:25.30 | 57 8 | 58 7 | … | 3.5954 |
| SPT0319-47 | SPT-S J031931-4724.6 | 03:19:32.37 | -47:24:33.20 | 67 9 | 57 7 | … | 4.5164 |
| SPT0345-47 | SPT-S J034510-4725.7 | 03:45:10.97 | -47:25:40.90 | 89 11 | 92 10 | 0.364 | 4.2958 |
| SPT0346-52 | SPT-S J034640-5205.0 | 03:46:41.19 | -52:05:05.50 | 131 15 | 123 13 | … | 5.6559 |
| SPT0348-62 | SPT-S J034841-6220.9 | 03:48:41.55 | -62:20:55.80 | 52 7 | 40 5 | 0.378 | … |
| SPT0403-58 | SPT-S J040331-5850.1 | 04:03:32.28 | -58:50:06.70 | 40 6 | 50 6 | … | … |
| SPT0404-59 | SPT-S J040446-5949.2 | 04:04:45.82 | -59:49:09.90 | 25 6 | 14 4 | 1.10 | … |
| SPT0418-47 | SPT-S J041839-4751.9 | 04:18:39.27 | -47:51:50.10 | 108 15 | 102 11 | 0.263 | 4.2248 |
| SPT0441-46 | SPT-S J044143-4605.5 | 04:41:44.13 | -46:05:29.50 | 80 12 | 100 11 | 0.882 | 4.4771 |
| SPT0452-50 | SPT-S J045246-5018.5 | 04:52:45.51 | -50:18:40.60 | 43 6 | 64 7 | 1.218 | 2.0104 |
| SPT0459-58 | SPT-S J045901-5805.3 | 04:59:00.47 | -58:05:17.00 | 53 8 | 63 7 | … | 4.8564 |
| SPT0459-59 | SPT-S J045913-5942.4 | 04:59:12.62 | -59:42:21.20 | 61 8 | 68 8 | 0.938 | 4.7993 |
| SPT0529-54 | SPT-S J052903-5436.6 | 05:29:03.37 | -54:36:40.30 | 118 14 | 115 12 | 0.140 | 3.3689 |
| SPT0532-50 | SPT-S J053250-5047.1 | 05:32:51.27 | -50:47:09.50 | 118 14 | 172 18 | 1.15 | 3.3988 |
| SPT0538-50 | SPT-S J053816-5030.8 | 05:38:16.83 | -50:30:52.00 | 125 13 | 146 15 | 0.404 | 2.7817 |
| SPT0550-53b | SPT-S J055002-5356.6 | 05:50:01.08 | -53:56:41.20 | 53 8 | 55 6 | 0.85 | 3.1280 |
| SPT0551-50b | SPT-S J055138-5058.0 | 05:51:38.97 | -50:58:03.30 | 74 10 | 84 9 | 0.365 | 3.1638 |
| SPT2031-51 | SPT-S J203100-5112.3 | 20:30:59.33 | -51:12:26.40 | 64 7 | 53 6 | 0.624 | … |
| SPT2048-55 | SPT-S J204823-5520.7 | 20:48:23.47 | -55:20:43.70 | 54 7 | 56 7 | … | … |
| SPT2052-56 | SPT-S J205239-5611.9 | 20:52:40.87 | -56:11:57.50 | 22 3 | 15 4 | … | … |
| SPT2103-60 | SPT-S J210330-6032.8 | 21:03:31.55 | -60:32:46.40 | 78 10 | 62 7 | 0.76 | 4.4357 |
| SPT2132-58 | SPT-S J213244-5803.1 | 21:32:43.54 | -58:02:54.00 | 58 8 | 57 7 | … | 4.7677 |
| SPT2134-50 | SPT-S J213403-5013.4 | 21:34:03.85 | -50:13:27.10 | 101 12 | 86 9 | 0.776 | 2.7799 |
| SPT2146-55 | SPT-S J214654-5507.9 | 21:46:54.13 | -55:07:52.10 | 54 7 | 49 6 | … | 4.5672 |
| SPT2146-56 | SPT-S J214644-5617.0 | 21:46:44.58 | -56:17:00.90 | 8 2 | 4 3 | 0.673 | … |
| SPT2147-50 | SPT-S J214719-5035.9 | 21:47:19.62 | -50:35:59.00 | 61 8 | 54 6 | 0.845 | 3.7602 |
| SPT2300-51c | SPT-S J230012-5157.4 | 23:00:12.48 | -51:57:23.70 | 20 3 | 4 3 | … | … |
| SPT2311-54 | SPT-S J231124-5450.6 | 23:11:24.26 | -54:50:32.80 | 44 5 | 40 5 | 0.44 | 4.2796 |
| SPT2319-55 | SPT-S J231921-5557.9 | 23:19:22.20 | -55:57:57.80 | 38 5 | 36 5 | 0.91 | 5.2928 |
| SPT2340-59 | SPT-S J234010-5943.3 | 23:40:09.57 | -59:43:30.40 | 34 5 | 35 5 | 0.113 | 3.8641 |
| SPT2349-50 | SPT-S J234942-5053.6 | 23:49:42.70 | -50:53:33.20 | 43 5 | 43 6 | 0.450 | 2.6480 |
| SPT2349-56 | SPT-S J234942-5638.2 | 23:49:42.70 | -56:38:18.90 | 56 10 | 22 4 | … | 4.3002 |
| SPT2351-57b | SPT-S J235150-5722.3 | 23:51:51.03 | -57:22:16.40 | 35 5 | 32 5 | 0.589 | 5.8113 |
| SPT2353-50b | SPT-S J235338-5010.2 | 23:53:39.50 | -50:10:04.60 | 41 6 | 35 5 | 0.697 | 5.5764 |
| SPT2354-58 | SPT-S J235434-5815.1 | 23:54:34.58 | -58:15:06.50 | 66 8 | 58 7 | 0.428 | 1.8671 |
| SPT2357-51 | SPT-S J235718-5153.7 | 23:57:16.85 | -51:53:51.50 | 53 8 | 36 5 | … | 3.0700 |
Note. — Positions listed correspond to the ALMA phase center. Source redshifts are given in Weiß et al. (2013) and Strandet et al. (submitted). Lens redshifts are given in Rotermund et al., in prep. Note that both LABOCA and ALMA flux densities are measured at 870 .
| Source Group | Date | Total Timea (h) | Flux Calibrator | Nant | (mJy) | Beam Sizea |
|---|---|---|---|---|---|---|
| SPT0202-61 – SPT0418-47 | 28 Nov. 2011 | 1.4 | J0403-360 | 14 | 0.60 | 0.8”2.2” |
| 04 June 2012 | 1.4 | Neptune | 18 | 0.29 | 0.5”0.6” | |
| SPT0441-46 – SPT0551-50 | 16 Nov. 2011 | 0.8 | Callisto | 16 | 0.72 | 1.3”1.5” |
| 15 June 2012 | 0.9 | Callisto | 20 | 0.64 | 0.5”0.7” | |
| SPT2031-51 – SPT2147-50 | 06 May 2012 | 0.9 | Neptune | 17 | 0.42 | 0.4”0.5” |
| 14 Aug. 2012 | 0.9 | Neptune | 22 | 0.31 | 0.5”0.6” | |
| SPT2300-51 – SPT0128-51 | 22 May 2012 | 1.4 | Neptune | 19 | 0.40 | 0.4”0.5” |
| 13 Aug. 2012 | 1.7 | Neptune | 25 | 0.21 | 0.5”0.6” |
3. Visibility-Based Lens Modeling
When modeling the effects of gravitational lensing, many methods perform the fitting procedure directly on observed images of the lensed emission. However, ALMA does not directly image the sky emission; rather, it measures the Fourier components of the sky emission at a range of two-dimensional spatial frequencies. Inverting these visibilities leads to correlated noise in the resulting images which can introduce bias into later measurements. Instead, a better option is to model the visibilities directly, where the noise and measurement are well understood. Modeling in the plane also allows us to model and account for residual calibration errors, including improper antenna delay calibrations and mismatched absolute flux scales from observations taken on different days. Our lens modeling procedure is based on the work of Hezaveh et al. (2013) (see also Bussmann et al. 2012, 2013 for a similar technique).
The lens mass profile is represented by one or more Singular Isothermal Ellipsoids (SIEs), with lensing deflections derived by Kormann et al. (1994). The SIE is parameterized by its two-dimensional location relative to the phase center (, ), the lens strength in the form of the angular Einstein radius , ellipticity , and position angle of the major axis in degrees east of north. In some cases, the data also favor the existence of an external tidal shear (), with deflections calculated as in Keeton et al. (2000) (we have redefined the shear position angle, , to match the convention used here for ). Background source emission and any unlensed sources are represented as one or more unresolved point sources (with position and , and flux density as free parameters) or Sérsic profiles (Sersic 1968; with position and , flux density , Sérsic index , half-light radius , axis ratio /, and position angle as free parameters). Note that a Sérsic index corresponds to a de Vaucouleurs (1953) profile, an exponential disk, and a Gaussian light profile (in Hezaveh et al. 2013, all sources were modeled as circularly symmetric Gaussian profiles). For lensed sources, we define the location of the source to be relative to the primary lens in the model, while for unlensed sources it is defined relative to the ALMA phase center. Within the framework we have developed, any of these lens and source parameters may be held fixed during fitting, and loose flat priors may be used. We use available optical/NIR imaging to guide the models (e.g., a single lens vs. multiple lenses), but the positions of galaxies identified in these images are not otherwise used, except for singly-imaged sources for which the ALMA data alone are not sufficiently constraining.
To reproduce the information present in our high signal-to-noise ratio measurements, and to represent realistic calibration uncertainties, our modeling must be more flexible than that used in previous work (e.g., Bussmann et al., 2013; Hezaveh et al., 2013; Bussmann et al., 2015). For example, because we are jointly modeling multiple datasets taken several months apart (see Table 2), small differences in absolute calibration or atmospheric conditions between epochs could be translated into false shifts in parameters. To address this possibility, we allow for a multiplicative amplitude re-scaling factor and an astrometric offset between the two tracks. We also calibrate uncorrected antenna-based phase errors using the procedure described in Hezaveh et al. (2013). These phase errors may be attributed to uncompensated atmospheric delays or imprecisely known antenna positions. These phase errors are generally small except in the two Nov. 2011 tracks, which were observed prior to antenna baseline solutions being incorporated into the reduction pipeline. The phase errors and astrometric shifts derived from this procedure are consistent with those found for the ICRF sources that we added to our observations to test the calibration and astrometry of the data.
We employ a Markov Chain Monte Carlo (MCMC) fitting procedure, using the emcee (Foreman-Mackey et al., 2013) code to sample the posterior probability function. At each point in parameter space, we generate a model image from a given set of lens and source parameters, including the flux scaling and astrometric offsets mentioned above. We then invert this image to the Fourier plane and measure the modeled visibilities at the coordinates of each dataset. The quality of fit is calculated using the metric. When comparing models of the same source with different numbers of free parameters, we use the Deviance Information Criterion (DIC; Spiegelhalter et al. 2002) for model selection. The DIC determines, for example, whether including an additional source-plane component is justified.
The code used to generate all the models in this work, along with example usage scripts, is available at https://github.com/jspilker/visilens.
4. Results
Images of each system along with the best-fit image- and source-plane models are shown in Fig. 2. These models are briefly described in Appendix A. Summaries of the properties of the lenses and sources are provided in Tables 3 and 4, respectively.
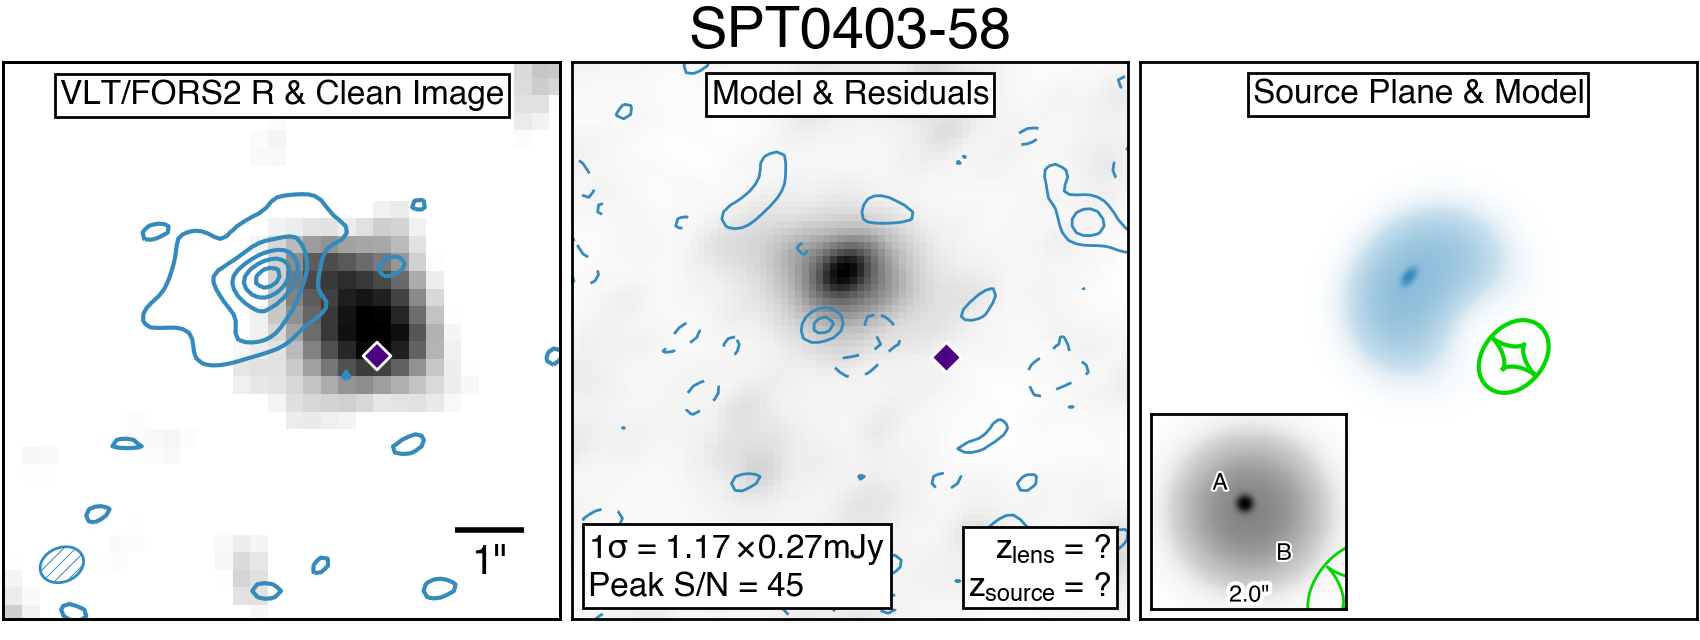
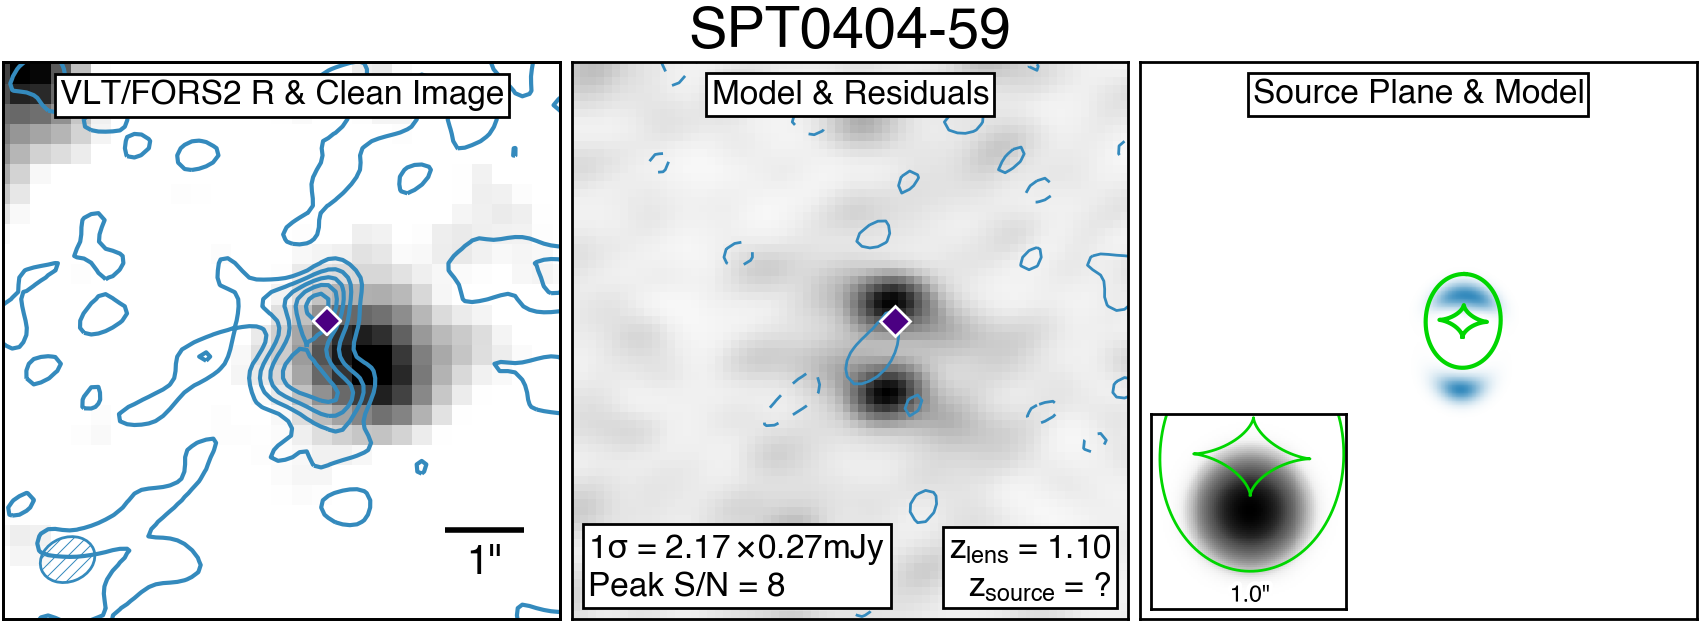
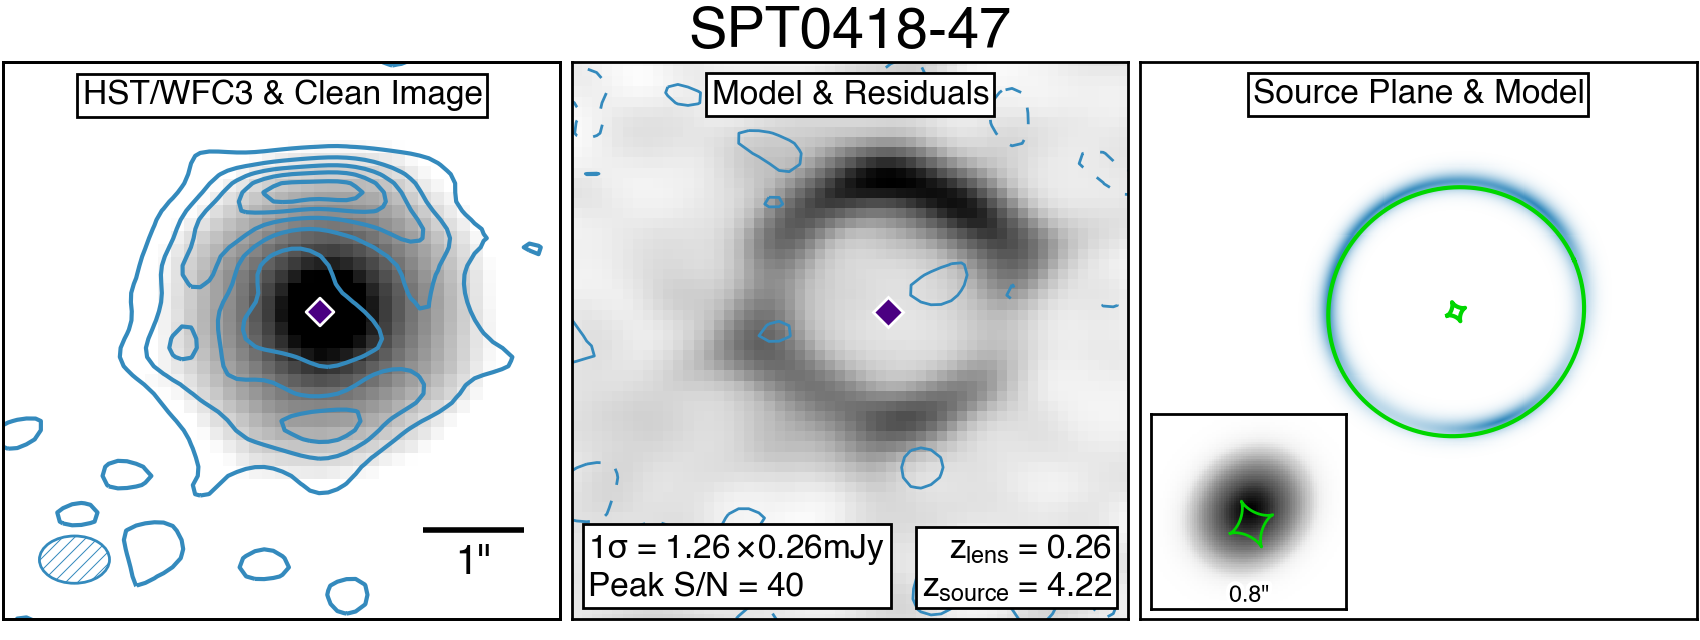
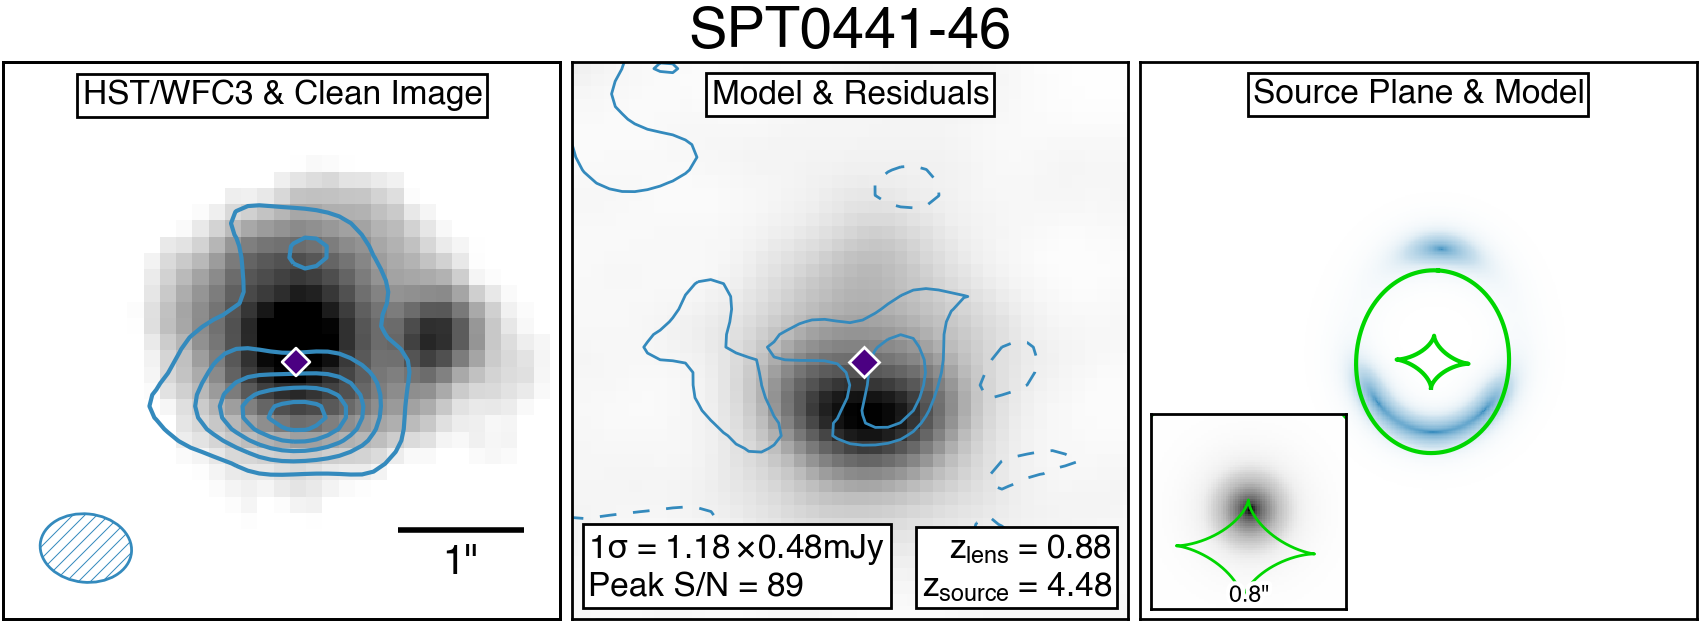
| Source | |||||||
|---|---|---|---|---|---|---|---|
| arcsec | arcsec | arcsec | deg. E of N | deg. E of N | |||
| SPT0020-51 A | -1.26 0.01 | -2.24 0.01 | 0.614 0.007 | 0.41 0.03 | 12 2 | 0.11 0.01 | 47 3 |
| B | -0.27 0.03 | -2.69 0.01 | 0.171 0.010 | 0.58 0.08 | 94 4 | ||
| SPT0027-50 A | -2.49 0.01 | -1.73 0.01 | 0.638 0.007 | 0.23 0.03 | 3 4 | 0.15 0.01 | 62 2 |
| B | -3.98 0.06 | -1.18 0.07 | 0.316 0.013 | 0.55 0.05 | 14 3 | ||
| C | -2.48 0.01 | -0.34 0.01 | 0.119 0.004 | 0.36 0.05 | 77 6 | ||
| SPT0103-45 | -0.34 0.01 | -2.44 0.01 | 0.880 0.003 | 0.11 0.01 | 87 1 | – | – |
| SPT0109-47 A | -3.61 0.13 | -1.70 0.04 | 1.304 0.033 | 0.66 0.06 | 119 6 | 0.17 0.01 | 54 3 |
| B | -1.81 0.07 | -0.73 0.03 | 0.930 0.025 | 0.53 0.03 | 6 7 | ||
| C | -7.65 0.23 | -4.66 0.18 | 0.839 0.021 | 0.59 0.04 | 96 5 | ||
| SPT0113-46 A | -0.14 0.01 | 0.68 0.01 | 1.157 0.010 | 0.28 0.01 | 84 1 | – | – |
| B | -1.11 0.02 | 1.63 0.02 | 0.439 0.012 | 0.08 0.03 | 151 8 | ||
| C | -1.93 0.10 | 3.07 0.10 | 0.258 0.019 | 0.50 0.05 | 18 5 | ||
| SPT0125-47 | -1.76 0.02 | -0.94 0.01 | 1.011 0.002 | 0.40 0.01 | 23 1 | 0.03 0.00 | 97 5 |
| SPT0125-50 | -0.42 0.02 | -4.26 0.02 | 0.984 0.005 | 0.40 0.01 | 40 0 | – | – |
| SPT0128-51 | -0.45 | 7.06 | 0.750 | 0.00 | 0 | – | – |
| SPT0202-61 | -0.04 0.01 | 2.19 0.02 | 0.758 0.005 | 0.44 0.03 | 70 3 | 0.23 0.01 | 178 2 |
| SPT0243-49 | -2.46 0.01 | -2.01 0.01 | 0.327 0.003 | 0.55 0.05 | 136 1 | – | – |
| SPT0300-46 | 2.00 0.01 | 1.20 0.01 | 0.344 0.008 | 0.53 0.02 | 66 1 | – | – |
| SPT0319-47 | -5.36 0.01 | -0.77 0.01 | 0.283 0.009 | 0.48 0.08 | 130 5 | – | – |
| SPT0345-47 | -2.42 0.01 | 1.26 0.01 | 0.306 0.002 | 0.45 0.02 | 126 1 | – | – |
| SPT0346-52 | -0.81 0.01 | 3.04 0.01 | 0.979 0.007 | 0.52 0.03 | 71 1 | 0.12 0.01 | 122 3 |
| SPT0348-62 | 10.90 | 3.10 | 1.002 | 0.00 | 0 | – | – |
| SPT0403-58 | 1.63 0.11 | -3.23 0.11 | 0.533 0.047 | 0.59 0.12 | 49 5 | – | – |
| SPT0404-59 | -1.07 0.05 | 9.75 0.05 | 0.549 0.027 | 0.49 0.11 | 88 7 | – | – |
| SPT0418-47 | 3.87 0.01 | -2.71 0.01 | 1.247 0.003 | 0.11 0.01 | 24 1 | – | – |
| SPT0441-46 | -0.56 0.01 | 4.24 0.01 | 0.678 0.006 | 0.42 0.03 | 87 1 | – | – |
| SPT0452-50 | 4.29 0.19 | -3.73 0.30 | 0.820 0.140 | 0.27 0.14 | 173 13 | – | – |
| SPT0459-58 | -5.37 0.03 | 2.64 0.02 | 0.468 0.015 | 0.34 0.09 | 30 6 | – | – |
| SPT0459-59 | -2.16 0.03 | 0.85 0.04 | 0.627 0.018 | 0.40 0.05 | 68 6 | – | – |
| SPT0529-54 | -2.35 0.01 | 0.02 0.01 | 1.360 0.008 | 0.17 0.01 | 91 3 | – | – |
| SPT0532-50 | -2.12 0.02 | 1.84 0.01 | 0.556 0.003 | 0.41 0.04 | 4 2 | – | – |
| SPT0538-50 | -0.31 0.02 | -0.09 0.02 | 1.728 0.004 | 0.13 0.01 | 163 0 | – | – |
| SPT2031-51 | -4.92 0.01 | 1.58 0.02 | 0.534 0.005 | 0.45 0.02 | 16 1 | – | – |
| SPT2048-55 | -5.42 0.01 | 2.47 0.01 | 0.361 0.006 | 0.07 0.03 | 85 10 | – | – |
| SPT2103-60 A | -4.25 0.01 | 5.53 0.01 | 0.455 0.009 | 0.62 0.02 | 41 2 | – | – |
| B | -4.83 0.04 | 7.38 0.06 | 0.791 0.022 | 0.11 0.02 | 35 9 | ||
| C | -6.40 0.06 | 5.19 0.11 | 0.552 0.020 | 0.81 0.03 | 15 3 | ||
| SPT2132-58 | -2.64 0.02 | 8.12 0.02 | 0.335 0.006 | 0.40 0.03 | 144 4 | – | – |
| SPT2134-50 | -4.76 0.01 | 2.18 0.01 | 0.518 0.002 | 0.14 0.01 | 37 1 | – | – |
| SPT2146-55 | -0.50 0.02 | -2.50 0.02 | 0.858 0.004 | 0.12 0.02 | 48 3 | – | – |
| SPT2147-50 | -6.18 0.02 | 4.21 0.02 | 1.195 0.006 | 0.25 0.02 | 14 2 | – | – |
| SPT2311-54 | -2.89 0.01 | 2.10 0.02 | 0.209 0.007 | 0.53 0.06 | 83 5 | – | – |
| SPT2319-55 | -4.74 0.01 | -0.13 0.02 | 0.430 0.003 | 0.29 0.03 | 117 2 | – | – |
| SPT2340-59 | -2.16 0.07 | -2.47 0.03 | 1.581 0.016 | 0.37 0.06 | 19 3 | – | – |
| SPT2349-50 | -4.38 0.01 | 2.35 0.02 | 0.244 0.005 | 0.56 0.06 | 4 5 | – | – |
| SPT2354-58 | -2.50 0.02 | -1.91 0.01 | 0.321 0.003 | 0.14 0.02 | 124 5 | – | – |
| SPT2357-51 | -0.30 0.03 | -1.58 0.02 | 0.215 0.003 | 0.61 0.03 | 151 2 | – | – |
Note. — Lens positions (, ) are relative to the ALMA phase center, shown for each source in Table 1. Also listed are the lens Einstein radius (, ellipticity (), and position angle (). For sources which require an external shear component, the shear strength () and position angle () are also given. Quantities without uncertainties have been fixed to the values shown during fitting.
| Source | ||||||||
| arcsec | arcsec | mJy | arcsec | deg. E of N | ||||
| SPT0020-51 A | 0.27 0.01 | 0.37 0.01 | 10.94 0.42 | 0.104 0.004 | 0.75 0.06 | 0.51 0.03 | 69 3 | 4.2 0.1 |
| B | 0.08 0.01 | 0.05 0.01 | 2.88 0.13 | 0.043 0.004 | 0.36 0.06 | 0.52 0.10 | 77 6 | 10.3 0.4 |
| SPT0027-50 A | -0.24 0.01 | 0.67 0.01 | 16.58 0.56 | 0.142 0.003 | 0.98 0.06 | 0.64 0.03 | 31 3 | 5.1 0.2 |
| B | -0.37 0.01 | 0.37 0.01 | 3.64 0.21 | 0.057 0.003 | 0.85 0.09 | 0.50 0.04 | 28 5 | 11.2 0.4 |
| C | -1.81 0.03 | -0.16 0.02 | 2.98 0.15 | – | – | – | – | 1.0 |
| SPT0103-45 A | -0.05 0.00 | 0.19 0.01 | 1.06 0.07 | 0.021 0.003 | 1.04 0.15 | 0.69 0.15 | 128 12 | 9.3 0.5 |
| B | -0.41 0.01 | 0.23 0.00 | 19.66 0.48 | 0.261 0.005 | 0.83 0.03 | 0.49 0.01 | 117 1 | 5.1 0.1 |
| SPT0109-47 A | 0.14 0.02 | 0.40 0.02 | 3.37 0.19 | 0.045 0.005 | 0.43 0.05 | 0.55 0.10 | 148 8 | 12.8 3.7 |
| B | -0.06 0.01 | 0.16 0.02 | 3.91 0.31 | 0.170 0.023 | 1.23 0.17 | 0.41 0.15 | 50 5 | 10.2 1.0 |
| C | 0.23 0.02 | 0.05 0.01 | 0.21 0.17 | 0.039 0.006 | 0.74 0.14 | 0.60 0.07 | 34 15 | 41.8 17.1 |
| SPT0113-46 | -0.39 0.02 | 0.40 0.02 | 2.35 0.06 | 0.075 0.003 | 0.5 | 0.38 0.02 | 53 1 | 23.9 0.5 |
| SPT0125-47 A | 0.31 0.01 | 0.24 0.00 | 21.42 0.67 | 0.118 0.003 | 0.21 0.01 | 0.89 0.03 | 74 3 | 5.3 0.1 |
| B | 0.37 0.01 | -0.03 0.01 | 3.91 0.30 | 0.093 0.009 | 0.78 0.13 | 0.41 0.09 | 48 4 | 6.0 0.2 |
| C | -0.18 0.01 | 0.19 0.01 | 0.82 0.10 | 0.078 0.016 | 0.95 0.22 | 0.67 0.13 | 112 8 | 7.6 0.7 |
| SPT0125-50 A | 0.13 0.01 | 0.22 0.01 | 4.39 0.22 | 0.036 0.002 | 0.72 0.13 | 0.22 0.02 | 39 1 | 15.0 0.5 |
| B | 0.03 0.01 | 0.07 0.01 | 1.39 0.26 | 0.124 0.031 | 1.5 | 0.49 0.18 | 83 13 | 11.7 0.9 |
| SPT0128-51a A | 3.30 0.81 | -5.37 1.49 | 9.79 4.65 | 0.139 0.015 | 0.5 | 1.0 | 0 | 1.1 0.1 |
| B | 0.28 0.13 | -5.53 0.24 | 3.41 0.38 | 0.122 0.017 | 0.5 | 1.0 | 0 | 1.1 0.0 |
| SPT0202-61 A | 0.09 0.01 | -0.08 0.01 | 3.29 0.19 | 0.051 0.004 | 0.26 0.07 | 0.23 0.03 | 130 2 | 16.2 0.8 |
| B | -0.03 0.01 | 0.03 0.01 | 4.19 0.41 | 0.222 0.026 | 1.50 0.22 | 0.64 0.09 | 88 7 | 9.1 0.7 |
| C | -1.24 0.03 | -3.88 0.03 | 4.06 0.41 | 0.134 0.029 | 0.5 | 1.0 | 0 | 1.0 |
| SPT0243-49 A | -0.06 0.01 | -0.06 0.01 | 6.23 0.51 | 0.082 0.005 | 0.5 | 1.0 | 0 | 6.7 0.5 |
| B | -0.23 0.01 | 0.21 0.01 | 5.21 0.52 | 0.145 0.010 | 0.5 | 1.0 | 0 | 3.1 0.1 |
| SPT0245-63 A | -1.21 0.01 | 5.62 0.01 | 20.73 1.74 | 0.123 0.017 | 0.5 | 0.29 0.06 | 168 3 | 1.0 |
| B | -0.85 0.04 | 5.58 0.03 | 19.28 2.07 | 0.387 0.022 | 0.5 | 0.67 0.08 | 161 9 | 1.0 |
| SPT0300-46 A | -0.10 0.01 | -0.03 0.01 | 4.07 0.66 | 0.049 0.007 | 0.5 | 1.0 | 0 | 9.0 0.8 |
| B | -0.08 0.03 | 0.16 0.02 | 4.85 1.10 | 0.143 0.018 | 0.5 | 1.0 | 0 | 4.0 0.3 |
| C | -7.68 0.11 | 0.14 0.06 | 9.65 2.17 | 0.488 0.132 | 0.5 | 1.0 | 0 | 1.0 |
| SPT0319-47 | 0.23 0.01 | 0.09 0.01 | 19.12 1.93 | 0.162 0.011 | 0.22 0.02 | 0.74 0.06 | 90 6 | 2.9 0.3 |
| SPT0345-47 | 0.02 0.00 | -0.06 0.01 | 9.71 0.61 | 0.083 0.005 | 0.5 | 1.0 | 0 | 7.9 0.5 |
| SPT0346-52 | -0.22 0.00 | 0.27 0.01 | 19.64 0.46 | 0.101 0.003 | 0.81 0.10 | 0.71 0.03 | 121 4 | 5.6 0.1 |
| SPT0348-62a A | -6.11 0.02 | 1.22 0.02 | 17.33 1.11 | 0.173 0.013 | 0.5 | 0.85 0.09 | 58 21 | 1.2 0.0 |
| B | -3.48 0.04 | 1.75 0.04 | 4.58 0.49 | 0.141 0.029 | 0.5 | 0.55 0.11 | 7 27 | 1.3 0.0 |
| C | -5.16 0.09 | 1.65 0.06 | 1.81 0.29 | 0.080 0.019 | 0.5 | 0.65 0.11 | 72 10 | 1.2 0.0 |
| D | -5.88 0.21 | 1.36 0.10 | 3.38 0.60 | 0.180 0.030 | 0.5 | 0.53 0.09 | 148 45 | 1.2 0.0 |
| SPT0403-58 A | 1.11 0.10 | 0.82 0.09 | 24.14 1.48 | 0.486 0.020 | 0.5 | 1.0 | 0 | 1.6 0.1 |
| B | 1.16 0.10 | 0.90 0.09 | 3.64 0.47 | 0.051 0.022 | 0.5 | 1.0 | 0 | 1.7 0.2 |
| SPT0404-59 | 0.02 0.03 | -0.29 0.03 | 2.87 0.57 | 0.126 0.029 | 0.5 | 1.0 | 0 | 4.1 0.6 |
| SPT0418-47 | 0.01 0.00 | 0.05 0.01 | 2.58 0.23 | 0.092 0.008 | 0.74 0.18 | 0.86 0.03 | 134 10 | 32.7 2.7 |
| SPT0441-46 | -0.01 0.00 | 0.16 0.01 | 6.88 0.57 | 0.076 0.007 | 2.30 0.32 | 1.0 | 0 | 12.7 1.0 |
| SPT0452-50 | -0.63 0.11 | 1.22 0.21 | 30.74 2.32 | 0.265 0.015 | 1.50 0.22 | 1.0 | 0 | 1.7 0.1 |
| SPT0459-58 | -0.15 0.02 | 0.08 0.02 | 11.82 1.51 | 0.217 0.023 | 0.5 | 1.0 | 0 | 5.0 0.6 |
| SPT0459-59 A | -0.08 0.02 | 0.29 0.03 | 11.26 1.11 | 0.323 0.023 | 0.5 | 0.60 0.07 | 171 6 | 4.2 0.4 |
| B | -1.17 0.06 | -0.98 0.07 | 3.22 0.41 | 0.205 0.048 | 0.5 | 1.0 | 0 | 1.5 0.1 |
| SPT0529-54 | -0.02 0.01 | 0.03 0.01 | 7.02 0.58 | 0.248 0.019 | 0.96 0.21 | 0.22 0.02 | 122 1 | 13.2 0.8 |
| SPT0532-50 | -0.05 0.01 | 0.00 0.00 | 13.23 0.85 | 0.134 0.007 | 0.35 0.12 | 0.90 0.05 | 102 16 | 10.0 0.6 |
| SPT0538-50 A | 0.08 0.01 | 0.15 0.02 | 3.77 0.43 | 0.060 0.006 | 0.5 | 1.0 | 0 | 18.8 2.3 |
| B | 0.15 0.02 | -0.00 0.02 | 1.50 0.20 | 0.152 0.016 | 0.5 | 1.0 | 0 | 23.4 1.9 |
| SPT2031-51 | 0.10 0.01 | -0.25 0.01 | 15.33 0.78 | 0.170 0.008 | 1.44 0.17 | 0.88 0.05 | 99 12 | 3.9 0.2 |
| SPT2048-55 | 0.05 0.01 | 0.09 0.01 | 9.27 1.06 | 0.111 0.010 | 1.71 0.32 | 0.96 0.05 | 125 19 | 6.3 0.7 |
| SPT2052-56 | 4.99 0.03 | 0.73 0.02 | 10.92 0.67 | 0.183 0.011 | 0.5 | 1.0 | 0 | 1.0 |
| SPT2103-60 | -0.86 0.02 | 0.80 0.02 | 2.29 0.16 | 0.073 0.004 | 0.5 | 0.78 0.08 | 4 13 | 27.8 1.8 |
| SPT2132-58 | 0.05 0.01 | -0.15 0.01 | 8.72 0.90 | 0.095 0.009 | 0.39 0.08 | 0.40 0.06 | 134 3 | 5.7 0.5 |
| SPT2134-50 | -0.01 0.00 | -0.05 0.01 | 4.31 0.50 | 0.033 0.004 | 0.95 0.14 | 0.82 0.12 | 95 23 | 21.0 2.4 |
| SPT2146-55 | -0.23 0.01 | 0.09 0.00 | 8.34 0.61 | 0.136 0.010 | 2.29 0.28 | 0.75 0.05 | 59 6 | 6.6 0.4 |
| SPT2146-56 | 0.94 0.05 | 1.03 0.03 | 2.80 0.30 | – | – | – | – | 1.0 |
| SPT2147-50 | 0.27 0.01 | 0.27 0.02 | 11.00 0.78 | 0.145 0.008 | 1.17 0.18 | 0.63 0.04 | 93 5 | 6.6 0.4 |
| SPT2311-54 | 0.09 0.01 | 0.24 0.01 | 21.58 1.04 | 0.143 0.005 | 0.61 0.12 | 0.84 0.04 | 160 8 | 1.9 0.1 |
| SPT2319-55 A | 0.05 0.00 | 0.12 0.01 | 4.38 0.49 | 0.043 0.007 | 2.21 0.30 | 0.40 0.13 | 122 7 | 6.9 0.6 |
| B | -0.00 0.01 | -0.05 0.01 | 0.72 0.15 | 0.059 0.016 | 0.90 0.32 | 1.0 | 0 | 13.9 1.8 |
| SPT2340-59 | -0.92 0.07 | 0.21 0.02 | 10.90 0.95 | 0.121 0.006 | 1.26 0.17 | 0.58 0.04 | 76 5 | 3.4 0.3 |
| SPT2349-50 | -0.22 0.01 | 0.00 0.01 | 21.01 0.99 | 0.159 0.006 | 1.02 0.14 | 0.76 0.05 | 16 6 | 2.1 0.1 |
| SPT2349-56 A | -0.33 0.01 | -0.46 0.01 | 8.76 0.27 | 0.176 0.013 | 0.5 | 0.36 0.06 | 67 3 | 1.0 |
| B | 0.61 0.01 | -4.91 0.01 | 7.85 0.26 | 0.103 0.011 | 0.5 | 0.53 0.07 | 88 10 | 1.0 |
| C | 1.06 0.02 | -6.13 0.02 | 4.60 0.27 | 0.114 0.019 | 0.5 | 0.65 0.08 | 60 22 | 1.0 |
| D | 0.21 0.02 | -6.19 0.03 | 1.53 0.16 | – | – | – | – | 1.0 |
| E | -4.73 0.05 | -6.83 0.05 | 1.67 0.22 | – | – | – | – | 1.0 |
| F | -10.83 0.23 | -3.59 0.18 | 1.59 0.27 | – | – | – | – | 1.0 |
| SPT2354-58 | 0.13 0.01 | -0.01 0.00 | 10.23 0.61 | 0.100 0.004 | 0.22 0.02 | 0.61 0.03 | 133 4 | 6.3 0.4 |
| SPT2357-51 | 0.05 0.02 | -0.18 0.01 | 13.80 0.66 | 0.152 0.004 | 0.5 | 1.0 | 0 | 2.9 0.1 |
Note. — For lensed sources (), source positions are relative to the first lens listed for each source in Table 3. For unlensed sources, positions are relative to the ALMA phase center given in Table 1. Quantities without uncertainties have been fixed during fitting to the values listed. Sources without a listed size are unresolved (pointlike) in the ALMA data.
4.1. Basic Lens Model Properties
As expected, a large fraction of the 47 fields observed by ALMA are consistent with strongly lensed systems – for 38 sources (81%), strong gravitational lensing is the most plausible explanation for the ALMA emission. Of these, 4 sources (11% of the strongly lensed sources) appear to be lensed by large groups or clusters of galaxies. An additional 8 sources (17%) appear to be unlensed or weakly lensed. Of these sources, 2 are co-located (′′) with objects also detected in the optical or near-infrared but do not appear to be lensed, two more are within 3′′ of optical/NIR counterparts and are likely either weakly lensed background sources or unlensed sources with undetected optical counterparts, while the remaining 4 sources do not appear to be closely associated with any objects detected in the best-available optical/NIR imaging. The final source, SPT2300-51, was undetected by ALMA at significance within the ALMA primary beam half-power radius and was determined to be a spurious detection in the LABOCA follow-up of SPT sources; this source is shown in Appendix A.
Figure 3 summarizes some key parameters of the lens models. The left panel shows the distribution of Einstein radii for the strongly lensed sources, where we have added the Einstein radii of systems with multiple lenses in quadrature. We find a median Einstein radius of 0.64′′, with the distribution rising until approximately the half-resolution radius of our data. This may indicate that higher resolution observations will reveal that some of the sources which are unresolved in the current data may also be gravitationally lensed, because the multiple images of strongly lensed sources are generally separated by 2 Einstein radii. A similar median Einstein radius of ′′ was found for the Herschel-selected sample of Bussmann et al. (2013). This may indicate that the two surveys probe a similar population of lens galaxies, in spite of the difference in background source properties (e.g., Fig. 1). We defer a more thorough discussion of the lens galaxies to a future work.
The center panel of Fig. 3 shows the distribution of for the SPT sources, with a median magnification of 5.5 for all sources, or 6.3 for the strongly lensed subset alone. This is somewhat higher than the median magnification of 4.6 found by Bussmann et al. (2013) in a study of Herschel-selected objects. The magnification distribution for the SPT sources also appears to contain a tail to higher magnifications compared to the Herschel sample; for approximately 30% of the strongly lensed sources, the best-fit magnifications are .
The fraction of strongly lensed sources is expected to vary with the flux density threshold used to create the source catalogs. Lower flux density limits will include a higher proportion of unlensed sources. Equivalently, the median magnification of an observed sample of objects is a function of the flux density threshold. The right panel of Fig. 3 illustrates this effect: on average, apparently brighter sources are magnified more highly. This effect is also apparent in the brighter Herschel sample studied by Bussmann et al. (2013), in which at least 21 of 30 sources are strongly lensed, compared to a fainter sample described in Bussmann et al. (2015), in which only 6 of 29 sources are strongly lensed. This difference is likely due to the shape of the submillimeter number counts, which drop steeply for sources with intrinsic mJy (Karim et al., 2013; Simpson et al., 2015).

4.2. Flux Recovery
Every source targeted was detected, with the exception of SPT2300-51 (this source was determined to be false after it was included in the ALMA sample). Each source had previously been observed at the same frequency using LABOCA on APEX, a single-dish bolometer camera with the same primary beam size as the ALMA data. By comparing the 870 flux density measured by LABOCA to that recovered in the ALMA data, we can test whether significant flux has been resolved out by ALMA due to limited coverage of the -plane. This could occur if the sources have structure extended on scales greater than the largest scale recoverable by the data, or if additional sources are present in the maps which are too faint to have been detected individually or are outside the primary beam.
Almost all of the sources in our sample are significantly resolved in the ALMA data. To estimate the total flux density present in the ALMA maps, we first image the data using a taper in the -plane at 50 k, corresponding to a resolution of ”. This ensures that we measure a value as close as possible to the true single-dish “zero-spacing” flux density. We then CLEAN the images to a 3 threshold and correct for the response of the primary beam. The total ALMA flux is then defined as the sum of the CLEAN components, in order to avoid the need to define an aperture over which to measure the total flux density. If our sources were unresolved on scales k, this would be equivalent to reporting the maximum pixel value in the images; in practice, many of our sources still show some structure on these scales.
In the left panel of Fig. 4, we compare the total flux densities of the ALMA sources determined in this way to the LABOCA measurements (Weiß et al., 2013). Note that we have made no effort to correct for the different bandwidths of the two instruments (8 vs. 60 GHz). We recover a median of ()% of the LABOCA flux density, consistent within the mutual absolute flux scaling uncertainties (10% for both instruments). Meanwhile, the middle panel of Fig. 4 shows no clear trend in the fraction of flux recovered as a function of LABOCA flux density. These plots suggest that, in general, the ALMA data do not resolve out significant extended emission or hide a large population of sources too faint to detect individually. Hodge et al. (2013) reached a similar conclusion using ALMA to image a large sample of unlensed 870 –selected sources discovered by LABOCA in the Extended Chandra Deep Field-South. The sample of SPT DSFGs observed in this work shows a better degree of consistency between the ALMA and LABOCA flux densities, which may be due to the fact that the SPT-selected sources are apparently brighter. Indeed, the brightest sources studied by Hodge et al. correspond to the faintest sources in the present sample.
We also test the extent to which the total ALMA flux densities agree with the total flux densities inferred from the lens models. In this case, we define the total model flux density as the sum over all components of . This is shown in the right panel of Fig. 4. The models contain a median of 102% of the total ALMA flux densities, indicating that no significant sources of emission remain unaccounted for by the models. As the residual maps generated by the best-fit models shown in Fig. 2 show no significant remaining peaks, this is unsurprising.

4.3. Multiplicity in the SPT Sample
Several high-resolution ALMA follow-up studies of submillimeter sources originally detected in low-resolution single-dish surveys have concluded that a significant fraction of the sources break up into multiple components when observed at higher resolution. In the ALESS program, Hodge et al. (2013) find that at least 35% of their sources contain multiple components, but that these components are consistent with being distributed randomly on the sky. In contrast, Bussmann et al. (2015) report a multiplicity fraction of 69%, with the multiple sources strongly concentrated at separations ′′. Similarly, Simpson et al. (2015) report that 61% of SCUBA-2 sources contain multiple components.
Our ability to determine multiplicity fractions from the follow-up of SPT-selected sources is hampered by two potential issues. First, the large majority of the sources considered here are strongly lensed. This makes finding close-in multiple components difficult, as any faint nearby companions will be overwhelmed by the much brighter lensed emission. Second, the SPT sources have a much higher apparent brightness compared to the unlensed single-dish sources observed in other follow-up campaigns. This reduces our ability to detect faint sources, as low-level phase errors can create spurious “companions.” For this reason, we use a higher (5, with mJy) threshold for source detection than other source catalogs. We also refrain from counting sources which require multiple source-plane components to reproduce the lensed emission as multiples, because these components are generally separated by ′′, and the source-plane components are likely an approximation of complex underlying structure within a single galaxy.
In the ALMA data presented here, only 13% (6/47) of sources contain multiple components at significance. This fraction is significantly lower than the high multiplicity rates reported by other ALMA follow-up programs. While obviously dependent on the depth of the follow-up observations, the high reported multiplicity fractions in other programs come from data with roughly comparable depth and resolution to the ALMA data presented here (ALESS detection threshold mJy, compared to mJy here). After considering our lack of sensitivity to close-in sources and a higher source detection threshold, the ALESS sample is the most natural comparison sample – the higher detection threshold in our data is balanced by the increased depth of our observations, and both samples are insensitive to multiples at separations of ′′. While the overall multiplicity fraction does appear to be lower in the SPT sample, the few multiples in our data are consistent with being uniformly distributed within the fields, as in the ALESS data.
5. Discussion
We are now in a position to take advantage of the comprehensive followup programs we have been conducting to revisit a number of topics of interest which may be investigated further using our new knowledge of source sizes.
5.1. Reliability of Lens Models
For the four sources studied by Hezaveh et al. (2013) using low-resolution (1.5′′) data, we find generally good agreement with the updated models. The differences between the previous and updated models can be entirely explained by the difference in background source parameterization – that is, fitting only the data used by Hezaveh et al. with elliptical source-plane components recovers the models presented here, while fitting all of the data used in this work with the circularly symmetric Gaussian components assumed by Hezaveh et al. recovers the models shown there. This indicates that the model uncertainties on the properties of the background sources are dominated by systematic, rather than statistical, uncertainty. We have attempted to counter this issue by use of the DIC for model selection, which effectively penalizes models with more degrees of freedom unless they reproduce the data significantly better.
ALMA is now capable of resolutions as fine as a few tens of milliarcseconds. To what extent can we expect that the model properties (e.g., ) derived here would agree with the properties derived from observations with the 20 better resolution now possible? Given that the true source structure of DSFGs is expected to be clumpy and irregular (e.g., Swinbank et al., 2011; Dye et al., 2015), in contrast to the smooth source parameterization assumed here, this question is difficult to answer. This irregular structure means that different regions of a given source will be magnified by different amounts, as opposed to the magnifications derived here, which are averaged over the assumed-elliptical source profile.
One instructive comparison comes via the ALMA Long Baseline Campaign observations of the lensed DSFG SDP.81 at 0.023′′ resolution (ALMA Partnership et al., 2015). This source was also included in the sample studied by Bussmann et al. (2013), who used 0.5–1′′ SMA observations to construct the lens models, comparable to the resolution of the ALMA data used in this work. Note, however, that the SMA observations reached only a peak signal-to-noise of 12 for SDP.81, far less than the typical significance of our detections (median peak signal-to-noise of 62). The lens model, which also represented the background source as an elliptical Sérsic profile, as in this work, yielded a magnification of . Several authors have constructed lens models of the continuum emission using the high-resolution ALMA observations of SDP.81, finding magnifications using pixelated source-plane reconstructions (Rybak et al., 2015; Dye et al., 2015; Tamura et al., 2015). It is difficult to know whether these 50% variations are to be generally expected, or whether the differences arise chiefly from data resolution, data signal-to-noise, or modeling approach. In at least this single case, however, shrinking the beam area by 100 leads to less than factor of two changes in source-averaged magnification.
5.2. Size Distribution of Background Sources
Gravitational lensing allows us to study the background sources at effective resolutions higher than the instrumental resolution of our observations. It is worth considering, however, the biases which may be present when comparing lensed and unlensed samples. For example, numerous authors have explored a potential size bias of lensed samples (e.g., Serjeant, 2012; Hezaveh et al., 2012; Wardlow et al., 2013), in which sources with high magnification are preferentially smaller than sources with lower magnification factors. This effect is due to the angular extent of the background source in comparison to the relatively small region near caustics over which high magnification is possible – small sources near caustics can experience a higher net magnification compared to more extended sources. Different regions of a given background source experience different magnifications, depending on the lensing geometry, an effect known as differential magnification.
We explore this effect in the left panel of Fig. 5. Here, we show the source magnification as a function of its size for both the SPT sample and the Herschel-selected samples of Bussmann et al. (2013, 2015). Many of the lens models reproduce the complex background source morphology by invoking multiple Sérsic components. These components are likely to be physically associated, so we show the total flux-weighted magnification and the total source area of all related components (so the two components of, e.g., SPT0103-45 are shown as a single point, while the two components of, e.g., SPT0128-51 are shown separately). We find a median intrinsic FWHM of 0.28”. This figure shows no clear correlation between the two parameters. However, in agreement with the size bias mentioned, it does appear that the sources with the highest magnifications are preferentially smaller than sources with lower magnifications. In other words, small size appears to be a necessary but not sufficient criterion for the highest magnifications.
A separate but related question is whether selecting strongly lensed sources results in a biased measurement of the true size distribution of DSFGs (e.g., Hezaveh et al., 2012). Even though high-magnification sources are preferentially compact, the size distribution of lensed samples is not necessarily biased, depending on the true underlying brightness and size distributions (for example, if the true size distribution were a delta function, no bias would exist). The presence of such a bias can be investigated by comparing size distributions measured from lensed and unlensed samples. In the right panel of Fig. 5, we compare the size distribution measured from the strongly lensed () sources in the SPT and Herschel samples with two unlensed DSFG samples. Simpson et al. (2015) measure sizes of 22 sources based on 870 ALMA imaging of objects selected from the 850 SCUBA-2 Cosmology Legacy Survey (Geach et al., 2013). Only one source was unresolved by these data, with a FWHM”, although the sample is restricted to sources with mJy to ensure sufficient signal-to-noise to measure an accurate source size. Ikarashi et al. (2015) report 1.1 mm sizes from ALMA observations of 13 AzTEC 1.1 mm-selected objects spanning mJy. Assuming a dust emissivity index , this corresponds to mJy. Even after accounting for the gravitational magnification, the SPT sources are typically brighter than many of the unlensed comparison sources, although no significant correlations between source flux density and size are seen in either unlensed sample or our own. Both unlensed samples have sizes measured from the dust continuum emission, eliminating possible confusion in comparing to sizes measured with alternative methods (e.g., from the radio continuum; Biggs et al. 2011).
Given the present sample sizes, both samples of strongly lensed sources have size distributions consistent with the distribution of unlensed sources. The two-sample K–S test confirms that we cannot reject the hypothesis that both distributions are drawn from the same parent distribution (). Few of the unlensed sources have robust spectroscopic redshifts, which hinders our ability to infer whether the consistent angular size distributions correspond to differing physical size distributions. As detailed in Béthermin et al. (2015) and Strandet et al. (2016), we expect more sources at higher redshifts in the SPT sample due to its long selection wavelength and preferential selection of lensed sources. We note, however, that the angular size scale evolves slowly for ; the difference in the size scale between the SPT median redshift and the median redshift of the unlensed DSFGs of Chapman et al. 2005 is 15%.
The lensed samples appear to recover the “true” unlensed size distribution in spite of the bias discussed above. This seems to indicate one of two possibilities. First, it may be that neither the lensed nor unlensed samples are sufficiently complete for differences to be noticeable. The lensed samples effectively select sources based on the product of intrinsic flux density and magnification, while the unlensed samples would not measure the true size distribution if faint sources are preferentially more extended, precluding size measurements from the current ALMA data. Alternatively, the underlying DSFG size distribution may lack sufficient dynamic range for the size bias to become noticeable without a very large number of sources. The true size distribution may have few objects at both very small and very large sizes, making the magnification bias unimportant. Both scenarios are testable from deeper observations of a larger sample of unlensed sources.

5.3. Constraining the Dust Opacity
The size information we have determined affords us additional constraints on other fitted parameters which would be difficult to determine from unresolved observations. One of the most common fitting functions used to describe the dust emission of galaxies is the “modified blackbody” function,
| (1) |
where is the Planck function evaluated at rest-frame frequency and temperature . This blackbody is “modified” by the dust optical depth term, and the overall normalization of the SED is related to the intrinsic source solid angle . At long wavelengths, the dust optical depth can be parameterized as a power-law in frequency (e.g., Draine, 2006), with , and the optical depth reaching unity at wavelength . The value of governs the slope of the Rayleigh-Jeans tail of the dust emission, while the combination of and governs the peak wavelength and width of the peak of the dust emission. The value of is generally in the range 1.5–2, while the value of is commonly assumed to be 100–200 (3–1.5 THz) (e.g., Blain et al., 2003; Casey et al., 2014).
For sources without size measurements, the source solid angle is unknown, in addition to the other parameters which control the shape of the dust SED. Even with sizes derived from the lens models, we are forced to assume a single dust temperature and value of averaged over the source for each object. Improvements on this scenario require spatially resolved continuum measurements at several widely spaced frequencies, especially those which straddle the SED peak. While this may one day be possible, at present we assume that the source emission is uniform, mirroring the assumptions which must be made with unresolved photometry.
The spatially unresolved long-wavelength SED alone is usually insufficient to constrain the value of , as degeneracies with the other parameters (particularly the dust temperature ) allow for good matches to the data for a wide range of . The inferred , in turn, has a large effect on other inferred quantities, such as the total dust mass (e.g., Casey, 2012). Our new knowledge of the intrinsic size of the SPT DSFGs offers an alternative avenue for constraining an effective . For those sources with spectroscopic redshifts, we fit the photometry at rest wavelengths with the modified blackbody function given above, assuming and allowing to be a free parameter, although allowing as a free parameter does not alter our results. The cutoff at short wavelengths is used because neither the modified blackbody function nor our lens models are expected to capture the emission from hot dust which dominates the short-wavelength side of the SED. This assumption ignores any possible contribution of a hot dust component to the long wavelength photometry, but Herschel/PACS photometry indicates that this component is negligible at the relevant wavelengths (Strandet et al., in prep.). We have verified that neither a hot dust component nor a short-wavelength power-law significantly affect our conclusions.
We perform the fitting described using the source photometry in Weiß et al. (2013); Strandet et al. (2016), and an MCMC fitting routine. The free parameters are the SED normalization (which stands in for the source solid angle at wavelengths without size measurements; see below), , and . At each MCMC step, we calculate the log-likelihood of producing the spatially unresolved continuum measurements given the proposed combination of parameters, and add to this the log-likelihood of the proposed and reproducing the intrinsic source flux density determined from the lens models, after marginalizing over the uncertainty in source size. The reason the contributions from the spatially unresolved and resolved measurements must be calculated separately is that, as shown in Fig. 4, there is a median 10% offset and large scatter between the total flux density measured in our (resolved) ALMA images compared to the (unresolved) LABOCA images at the same wavelength; presumably this scatter would also be present if we resolved the sources at all other wavelengths. In order to avoid biases introduced by this scatter, we use the exact form in Eq. 1 at observed-frame 870 only, and allow a normalization at other wavelengths. This normalization effectively allows us to match flux captured by the large single-dish beams (primarily from galaxies associated with the foreground lensing haloes; Welikala et al. 2016) not included in the lens modeling, as well as general measurement and calibration errors. We have verified that this method does not give unphysical results, and that the inclusion of the lens model sizes merely shrinks the allowable parameter space without driving the solutions to otherwise unfavored values.
The results of this fitting are shown in the left panel of Fig. 6. We find a median value of = 140 40 , somewhat larger than the canonically assumed value of 100 (e.g., Greve et al., 2012). Moreover, as previously mentioned, this wavelength is correlated with the inferred dust temperature. Fitting a line to the points shown in Fig. 6 using orthogonal distance regression (marginalizing over the probability of points being outliers; e.g., Hogg et al. 2010) yields
| (2) |
Using this relation provides a better alternative to assuming a single value for when the available photometry cannot constrain both and – this relation can be easily inserted into likelihood functions when fitting the dust SED. This correlation may manifest in part from the relationship between star formation and molecular gas – at a simplistic level, the star formation rate of dusty galaxies is related to , which in turn is related to ; meanwhile, the gas mass is related to the dust mass, which, as we discuss further below, is related to the dust emissivity encapsulated in .
The impact of this correlation has little effect on the integrated . This is as expected, since our photometric coverage fully samples the SED peak. The dust mass , on the other hand, is strongly influenced. In the optically thin limit, is related to the source flux density and via
| (3) |
(Greve et al., 2012) where is the dust mass absorption coefficient. At present, we are concerned only with the relative difference in the dust mass determined under various assumptions, so the form and normalization of are irrelevant (as it is related to the source flux density at one frequency and ). The right-hand panel of Fig. 6 shows the ratio of the dust mass determined through our SED fitting when leaving as a free parameter compared to the dust mass inferred by assuming , effected through the changes in the fitted . A similar range of inferred dust masses are seen for other assumed values, although the range of temperatures with reasonable agreement shifts higher for higher . For dust temperatures K, the difference is relatively small. However, as dust temperature increases, the dust mass is increasingly over-predicted under the assumption that , reaching more than a factor of 2 for the hottest sources. A similar result, ignoring the dust optical depth and instead framed in terms of , was obtained by Magdis et al. (2012), who showed that single-temperature fits underestimated compared to more complex models. This demonstrates that the assumption of a single, constant value of can cause a severe distortion in other derived quantities, especially those which rely on .

5.4. Revisiting the [CII]/FIR Ratio
The 158 [CII] line has long been known as a powerful coolant of the ISM (e.g., Crawford et al., 1986), radiating about 0.1–1% of the total IR luminosity (e.g., Stacey et al., 1991, 2010). Unfortunately, [CII] can be emitted by gas under a wide variety of conditions, which makes its physical interpretation challenging.
One challenge in interpreting [CII] manifests as the “[CII] deficit,” in which the [CII]/ ratio can fall rapidly for (e.g., Malhotra et al., 1997; Luhman et al., 1998; Graciá-Carpio et al., 2011). A variety of physical mechanisms for this deficit have been proposed, including AGN contributions to (e.g., Sargsyan et al., 2012), increased ionization parameter (e.g., Malhotra et al., 2001; Graciá-Carpio et al., 2011), collisional de-excitation of [CII] (Appleton et al., 2013), and differences in emitting column (Goicoechea et al., 2015). The [CII] emission of a sample of 20 SPT DSFGs was studied in detail by Gullberg et al. (2015), who noted that nearly saturated [CII] emission (via, e.g., excitation or optical depth effects) could cause much of the [CII]/ variation to be controlled by variations in alone. This is tentatively supported by photodissociation models which attempt to simultaneously explain both the [CII] and CO(1–0) emission.
In their studies of a large sample of local IR-luminous galaxies from the Great Observatories All-Sky LIRG Survey (GOALS), Díaz-Santos et al. (2013) find that the [CII]/ ratio is also correlated with the FIR luminosity surface density . This correlation held for both purely star-forming galaxies as well as objects with significant AGN activity (although many of the AGN-dominated sources were spatially unresolved, resulting in lower limits on ). A similar result was obtained for galaxies at by Ibar et al. (2015), who additionally noted that the spiral galaxies in their sample had higher [CII]/ ratios than irregular and elliptical galaxies. Using our new measurements of the size of the dust continuum emitting regions of the SPT DSFGs, and drawing on a compilation of high-redshift objects from the literature, we can extend this work two orders of magnitude higher in . The result is shown in Fig. 7. We have re-fit the photometry of all sources to ensure a uniform determination of .
The dashed line in Fig. 7 represents the best-fit relation determined by Díaz-Santos et al. (2013). We have shifted their relation vertically to match our re-determination of , but the slope is exactly as determined by Díaz-Santos et al. (2013), i.e., . The decline continues unabated another two orders of magnitude beyond the limits of the GOALS survey, to at least /kpc2. This lends further support to the claim that the compactness of the IR-emitting region drives the relationship between [CII] and . A similar correlation can be seen by comparing the [CII]/ ratio with the dust temperature , since, to first order, . This correlation was first shown by Malhotra et al. (1997) and further explored by Gullberg et al. (2015), who determined that most of the variation could indeed by explained by the Stefan-Boltzmann law, with a small residual dependence on . Formulating the correlation in terms of itself, however, leads to a dispersion approximately a factor of 2 smaller than formulating it in terms of (Díaz-Santos et al., 2013). While the nature of the [CII] emission is still uncertain, it is clear that the compactness of the IR-emitting region plays a vital role in determining the coupling of the [CII]-emitting gas with the warm dust.

6. Conclusions
We have used ALMA 870 observations of 47 gravitationally lensed dusty, star-forming galaxies to model the effects of gravitational lensing. Using a visibility-based modeling routine which accounts for several calibration uncertainties, we can recover the intrinsic properties of the background sources. At least 33 of the sources are confirmed to undergo galaxy-scale strong lensing (), while the remaining sources are lensed by galaxy clusters, or are weakly- or un-lensed (). The background sources are magnified by a median factor of 5.5 for all sources, or 6.3 for the strongly lensed subset alone, with a tail that extends to .
The sources have a median intrinsic angular FWHM of 0.28”. In spite of a potential size bias of lensed systems, in which compact background sources can be magnified more highly than extended sources, we find no significant differences between the size distributions of existing strongly lensed and unlensed samples of DSFGs. Increasing the number of unlensed sources with spectroscopic redshifts will indicate whether this corresponds to a difference in physical size scale, though this effect is small over the plausible range of redshifts. If the similarity in size distributions is not a chance effect owing to the limited number of sources with size measurements, we argue that this may indicate that the intrinsic size distribution of DSFGs is sufficiently narrow that the effect of the size bias is not detectable.
We use the sizes derived from the lens models together with the extensive FIR/submillimeter photometric coverage to constrain , the wavelength where the dust opacity is unity. The size information from the lens models allows us to overcome parameter degeneracies which limit our ability to constrain this wavelength from the SED alone. We find a median transition wavelength of , somewhat longer than the generally assumed 100 . We provide a fitting formula between and the dust temperature which can be used for sources without size measurements. We show that assuming a single, fixed value for leads to variations of a factor of 2 in the inferred dust mass which can be propagated forward to, e.g., the gas mass under overly simplified assumptions.
Finally, we make use of our extensive follow-up program targeting the 158 FIR fine structure line of [CII]. We show that high-redshift galaxies (over half of them from the SPT DSFG sample) follow the same relationship between [CII]/ and as the IR-luminous galaxies in the Herschel GOALS sample, extending this correlation another two orders of magnitude higher in . This agrees with the claim that the controlling parameter in the “[CII] deficit” is the compactness of the IR-emitting region, regardless of the dust heating source. Future spatially resolved observations of the [CII] line at high redshifts will indicate whether this global correlation is also present on sub-galactic scales.
The high-resolution images and lens models in this work, along with the high spectroscopic completeness of our sample, provide a wealth of information useful for future follow-up programs. The sensitivity and resolution afforded by ALMA in full operation indicate that the future of DSFG studies is bright, and the models we have presented should help prioritize the best sources to help answer questions of interest.
References
- ALMA Partnership et al. (2015) ALMA Partnership, Vlahakis, C., Hunter, T. R., et al. 2015, ApJ, 808, L4
- Appleton et al. (2013) Appleton, P. N., Guillard, P., Boulanger, F., et al. 2013, ApJ, 777, 66
- Barger et al. (1998) Barger, A. J., Cowie, L. L., Sanders, D. B., et al. 1998, Nature, 394, 248
- Baugh et al. (2005) Baugh, C. M., Lacey, C. G., Frenk, C. S., et al. 2005, MNRAS, 356, 1191
- Béthermin et al. (2015) Béthermin, M., De Breuck, C., Sargent, M., & Daddi, E. 2015, A&A, 576, L9
- Béthermin et al. (2016) Béthermin, M., De Breuck, C., Gullberg, B., et al. 2016, A&A, 586, L7
- Biggs et al. (2011) Biggs, A. D., Ivison, R. J., Ibar, E., et al. 2011, MNRAS, 413, 2314
- Blain et al. (2003) Blain, A. W., Barnard, V. E., & Chapman, S. C. 2003, MNRAS, 338, 733
- Blain & Longair (1993) Blain, A. W., & Longair, M. S. 1993, MNRAS, 264, 509
- Bothwell et al. (2013) Bothwell, M. S., Aguirre, J. E., Chapman, S. C., et al. 2013, ApJ, 779, 67
- Bussmann et al. (2012) Bussmann, R. S., Gurwell, M. A., Fu, H., et al. 2012, ApJ, 756, 134
- Bussmann et al. (2013) Bussmann, R. S., Pérez-Fournon, I., Amber, S., et al. 2013, ApJ, 779, 25
- Bussmann et al. (2015) Bussmann, R. S., Riechers, D., Fialkov, A., et al. 2015, ArXiv e-prints, arXiv:1504.05256
- Carlstrom et al. (2011) Carlstrom, J. E., Ade, P. A. R., Aird, K. A., et al. 2011, PASP, 123, 568
- Carniani et al. (2013) Carniani, S., Marconi, A., Biggs, A., et al. 2013, A&A, 559, A29
- Casey (2012) Casey, C. M. 2012, MNRAS, 425, 3094
- Casey et al. (2014) Casey, C. M., Narayanan, D., & Cooray, A. 2014, Phys. Rep., 541, 45
- Casey et al. (2013) Casey, C. M., Chen, C.-C., Cowie, L. L., et al. 2013, MNRAS, 436, 1919
- Chapman et al. (2005) Chapman, S. C., Blain, A. W., Smail, I., & Ivison, R. J. 2005, ApJ, 622, 772
- Crawford et al. (1986) Crawford, M. K., Lugten, J. B., Fitelson, W., Genzel, R., & Melnick, G. 1986, ApJ, 303, L57
- Davé et al. (2010) Davé, R., Finlator, K., Oppenheimer, B. D., et al. 2010, MNRAS, 404, 1355
- De Breuck et al. (2014) De Breuck, C., Williams, R. J., Swinbank, M., et al. 2014, A&A, 565, A59
- de Vaucouleurs (1953) de Vaucouleurs, G. 1953, MNRAS, 113, 134
- Díaz-Santos et al. (2013) Díaz-Santos, T., Armus, L., Charmandaris, V., et al. 2013, ApJ, 774, 68
- Díaz-Santos et al. (2016) Díaz-Santos, T., Assef, R. J., Blain, A. W., et al. 2016, ApJ, 816, L6
- Draine (2006) Draine, B. T. 2006, ApJ, 636, 1114
- Dye et al. (2015) Dye, S., Furlanetto, C., Swinbank, A. M., et al. 2015, MNRAS, 452, 2258
- Foreman-Mackey et al. (2013) Foreman-Mackey, D., Hogg, D. W., Lang, D., & Goodman, J. 2013, PASP, 125, 306
- Fu et al. (2012) Fu, H., Jullo, E., Cooray, A., et al. 2012, ApJ, 753, 134
- Geach et al. (2013) Geach, J. E., Chapin, E. L., Coppin, K. E. K., et al. 2013, MNRAS, 432, 53
- Goicoechea et al. (2015) Goicoechea, J. R., Chavarría, L., Cernicharo, J., et al. 2015, ApJ, 799, 102
- Graciá-Carpio et al. (2011) Graciá-Carpio, J., Sturm, E., Hailey-Dunsheath, S., et al. 2011, ApJ, 728, L7
- Greve et al. (2012) Greve, T. R., Vieira, J. D., Weiß, A., et al. 2012, ApJ, 756, 101
- Gullberg et al. (2015) Gullberg, B., De Breuck, C., Vieira, J. D., et al. 2015, MNRAS, 449, 2883
- Hayward et al. (2013) Hayward, C. C., Narayanan, D., Kereš, D., et al. 2013, MNRAS, 428, 2529
- Helou et al. (1988) Helou, G., Khan, I. R., Malek, L., & Boehmer, L. 1988, ApJS, 68, 151
- Hezaveh et al. (2012) Hezaveh, Y. D., Marrone, D. P., & Holder, G. P. 2012, ApJ, 761, 20
- Hezaveh et al. (2013) Hezaveh, Y. D., Marrone, D. P., Fassnacht, C. D., et al. 2013, ApJ, 767, 132
- Hinshaw et al. (2013) Hinshaw, G., Larson, D., Komatsu, E., et al. 2013, ApJS, 208, 19
- Hodge et al. (2013) Hodge, J. A., Carilli, C. L., Walter, F., Daddi, E., & Riechers, D. 2013, ApJ, 776, 22
- Hogg et al. (2010) Hogg, D. W., Bovy, J., & Lang, D. 2010, ArXiv e-prints, arXiv:1008.4686
- Hughes et al. (1998) Hughes, D. H., Serjeant, S., Dunlop, J., et al. 1998, Nature, 394, 241
- Ibar et al. (2015) Ibar, E., Lara-López, M. A., Herrera-Camus, R., et al. 2015, MNRAS, 449, 2498
- Ikarashi et al. (2015) Ikarashi, S., Ivison, R. J., Caputi, K. I., et al. 2015, ApJ, 810, 133
- Karim et al. (2013) Karim, A., Swinbank, A. M., Hodge, J. A., et al. 2013, MNRAS, 432, 2
- Keeton et al. (2000) Keeton, C. R., Mao, S., & Witt, H. J. 2000, ApJ, 537, 697
- Kormann et al. (1994) Kormann, R., Schneider, P., & Bartelmann, M. 1994, A&A, 284, 285
- Luhman et al. (1998) Luhman, M. L., Satyapal, S., Fischer, J., et al. 1998, ApJ, 504, L11
- Ma et al. (1998) Ma, C., Arias, E. F., Eubanks, T. M., et al. 1998, AJ, 116, 516
- Magdis et al. (2012) Magdis, G. E., Daddi, E., Béthermin, M., et al. 2012, ApJ, 760, 6
- Malhotra et al. (1997) Malhotra, S., Helou, G., Stacey, G., et al. 1997, ApJ, 491, L27
- Malhotra et al. (2001) Malhotra, S., Kaufman, M. J., Hollenbach, D., et al. 2001, ApJ, 561, 766
- Mocanu et al. (2013) Mocanu, L. M., Crawford, T. M., Vieira, J. D., et al. 2013, ApJ, 779, 61
- Narayanan et al. (2015) Narayanan, D., Turk, M., Feldmann, R., et al. 2015, Nature, 525, 496
- Negrello et al. (2010) Negrello, M., Hopwood, R., De Zotti, G., et al. 2010, Science, 330, 800
- Neri et al. (2014) Neri, R., Downes, D., Cox, P., & Walter, F. 2014, A&A, 562, A35
- Riechers et al. (2013) Riechers, D. A., Bradford, C. M., Clements, D. L., et al. 2013, Nature, 496, 329
- Riechers et al. (2014) Riechers, D. A., Carilli, C. L., Capak, P. L., et al. 2014, ArXiv e-prints, arXiv:1404.7159
- Rybak et al. (2015) Rybak, M., McKean, J. P., Vegetti, S., Andreani, P., & White, S. D. M. 2015, MNRAS, 451, L40
- Sargsyan et al. (2012) Sargsyan, L., Lebouteiller, V., Weedman, D., et al. 2012, ApJ, 755, 171
- Serjeant (2012) Serjeant, S. 2012, MNRAS, 424, 2429
- Sersic (1968) Sersic, J. L. 1968, Atlas de galaxias australes
- Simpson et al. (2015) Simpson, J. M., Smail, I., Swinbank, A. M., et al. 2015, ApJ, 807, 128
- Smail et al. (1997) Smail, I., Ivison, R. J., & Blain, A. W. 1997, ApJ, 490, L5+
- Spiegelhalter et al. (2002) Spiegelhalter, D. J., Best, N. G., Carlin, B. P., & Van Der Linde, A. 2002, Journal of the Royal Statistical Society: Series B (Statistical Methodology), 64, 583
- Spilker et al. (2014) Spilker, J. S., Marrone, D. P., Aguirre, J. E., et al. 2014, ApJ, 785, 149
- Spilker et al. (2015) Spilker, J. S., Aravena, M., Marrone, D. P., et al. 2015, ApJ, 811, 124
- Stacey et al. (1991) Stacey, G. J., Geis, N., Genzel, R., et al. 1991, ApJ, 373, 423
- Stacey et al. (2010) Stacey, G. J., Hailey-Dunsheath, S., Ferkinhoff, C. an d Nikola, T., et al. 2010, ApJ, 724, 957
- Strandet et al. (2016) Strandet, M. L., Weiß, A., Vieira, J. D., et al. 2016, ArXiv e-prints, arXiv:1603.05094
- Swinbank et al. (2010) Swinbank, A. M., Smail, I., Longmore, S., et al. 2010, Nature, 464, 733
- Swinbank et al. (2011) Swinbank, A. M., Papadopoulos, P. P., Cox, P., et al. 2011, ApJ, 742, 11
- Tamura et al. (2015) Tamura, Y., Oguri, M., Iono, D., et al. 2015, PASJ, 67, 72
- Vieira et al. (2010) Vieira, J. D., Crawford, T. M., Switzer, E. R., et al. 2010, ApJ, 719, 763
- Vieira et al. (2013) Vieira, J. D., Marrone, D. P., Chapman, S. C., et al. 2013, Nature, 495, 344
- Walter et al. (2009) Walter, F., Riechers, D., Cox, P., et al. 2009, Nature, 457, 699
- Wang et al. (2013) Wang, R., Wagg, J., Carilli, C. L., et al. 2013, ApJ, 773, 44
- Wardlow et al. (2013) Wardlow, J. L., Cooray, A., De Bernardis, F., et al. 2013, ApJ, 762, 59
- Weiß et al. (2013) Weiß, A., De Breuck, C., Marrone, D. P., et al. 2013, ApJ, 767, 88
- Welikala et al. (2016) Welikala, N., Béthermin, M., Guery, D., et al. 2016, MNRAS, 455, 1629
- Yun et al. (2015) Yun, M. S., Aretxaga, I., Gurwell, M. A., et al. 2015, ArXiv e-prints, arXiv:1508.05425
Appendix A Notes on the Lens Models of Individual Sources
SPT0020-51 – This source is lensed by a small group of galaxies, and the source emission can be adequately described by two Sérsic profiles. Oddly, the brightest, northernmost galaxy seems to have virtually no effect on the lensing geometry. We have verified the astrometry of the images shown in Fig. 2. It may be that the northern lensing galaxy is at a different redshift from the other two, such that its influence on the overall deflection is small. The complex lensing environment is likely responsible for the peak residual structure seen, given the limitations of our relatively simple model.
SPT0027-50 – This source presents a complex lensing environment. We find that modeling three of the lensing galaxies and an external shear produces a model which describes the data reasonably well.
SPT0103-45 – The lens galaxy in this system appears to have a tidal feature or spiral arm outside of the lensed emission seen by ALMA. Two Sérsic components are required to model the emission. Interestingly, the CO(3–2) line observed by Weiß et al. 2013 also shows an asymmetric double-peaked profile.
SPT0109-47 – This source is reasonably well-fit by a model accounting for three lensing galaxies. Even still, the flux ratios of the four images are not entirely reproduced by the model. This likely indicates that the complexities of the lensing environment are not fully accounted for by the model.
SPT0113-46 – This source is also lensed by a group of galaxies. We model the three closest galaxies, which is sufficient to reproduce the observed emission. The best-fit model with the positions of all three galaxies as free parameters shows some tension with the locations of the galaxies in our HST imaging. This may be due to the gravitational potential in which the galaxies reside or the effects of other group members we have not modeled. Fixing the relative positions of the galaxies to their separations in the HST imaging results in significantly higher residuals but changes the inferred source size and magnification by %. Since the effect on these quantities of greatest interest is small, we show the best-fit model with the positions of all three galaxies as free parameters.
SPT0125-47 – This source is detected with a peak significance of nearly 150, and required three source-plane components to model the data. Even this model leaves residuals, which may indicate that an SIE is an imperfect representation of the lens mass profile. The structure of the residuals indicates that additional angular structure in the lens in the form of multipoles may be necessary to accurately capture the complexity of the lens mass profile.
SPT0125-50 – We model this source using two Sérsic components. The faint counterimage to the southwest of the lens is only moderately well-reproduced by this model, which may indicate further structure in the source and/or lens planes.
SPT0128-51 – This source appears to consist of two components, at best mildly lensed by a galaxy ” to the north. We estimate the magnification experienced by these two components by assuming the lens galaxy has an Einstein radius of 0.75”, approximately the median of all the lens galaxies in our sample. Under this assumption, the eastern and western components have magnifications of 1.16 and 1.20, respectively.
SPT0202-61 – This source is well-represented by two source-plane components. We also detect a second source ” south of the main lens. This second component has mJy. As we do not know the redshift(s) of the background sources, it is unclear whether they are physically related or simply a chance projection.
SPT0243-49 – This is the highest-redshift source we consider here, at . The lens appears highly elongated, with a possible tidal tail extending east.
SPT0245-63 – This source appears to be a rare case in which the emission we detect is associated with a large foreground galaxy. We consider a lensing origin of the 870 emission unlikely, as the implied lens mass is implausibly small ( for ) given the brightness of the putative lens (K-band magnitude 16.3). Additional optical/NIR and millimeter spectroscopy is needed to determine the nature of this source conclusively.
SPT0300-46 – This source is well-fit by two source-plane components, and the CO(4–3) line clearly shows two velocity components (Gullberg et al., 2015). While the source is not clearly resolved into multiple images, imaging the visibilities with baselines 100 k clearly shows the arc-like structure reproduced in the best-fit model. The field also includes a 9 mJy source 8′′ west of the lensed source.
SPT0319-47 – This source is also moderately resolved at 0.5” resolution, and is adequately fit by a single Sérsic component. Imaging the visibilities with baselines 100 k confirms that the source splits into two lensed images as predicted by the best-fit model.
SPT0345-47 – This source is unambiguously lensed, as we have measured distinct lens and source redshifts. Imaging only baselines 100 k confirms that the arc and counterimage structure seen in the best-fit model is correct.
SPT0346-52 – This source was one of four resolved at 1.5” resolution and studied by Hezaveh et al. (2013). Combining those data with the higher-resolution observations presented here largely confirms the previous model. The data also favor the existence of an external shear component at an angle roughly in line with the galaxy 3” east of the main lens.
SPT0348-62 – This object appears to be a collection of several weakly lensed sources. We assume an Einstein radius of 1” for the galaxy approximately 6” east of the bulk of the emission. Much of the 870 emission is not well-represented by simple Gaussian components, although four elliptical Gaussian components provide an adequate fit. The four components are magnified by factors of 1.16–1.26, assuming the Einstein radius above.
SPT0403-58 – This source appears to be marginally lensed by the nearby galaxy, with a flux-weighted total magnification of .
SPT0404-59 – This object is the most weakly detected source in this sample, and the images we do detect straddle the ALMA primary beam half-power radius. A single source-plane component represents the data well, although deeper observations will be necessary to place better constraints on the lens and source geometry.
SPT0418-47 – This source was also considered by Hezaveh et al. (2013). Our model, which incorporates higher-resolution data available after publication of Hezaveh et al., finds a higher magnification, , as the higher-resolution data show a nearly-perfect Einstein ring. This source is the most highly magnified galaxy-scale lens in the current sample.
SPT0441-46 – This source is well-modeled by a single Sérsic background component.
SPT0452-50 – With distinct lens and source redshifts, this source appears to be only mildly lensed by the faint galaxy 3” to the south of the ALMA emission. It is the highest-redshift lens with a confirmed redshift in the current sample.
SPT0459-58 – This source is marginally resolved into multiple images by ALMA. Imaging those visibilities with baselines 75 k confirms that the multiple images seen in the best-fit model are real.
SPT0459-59 – In addition to a strongly lensed component, this source also contains a fainter source weakly lensed, by a factor of .
SPT0529-54 – This source was also studied by Hezaveh et al. (2013), and is the only source for which the model which incorporates the higher-resolution data now available to us significantly differs from the previous model. The model presented here allows ellipticity in the background source, which entirely accounts for the model differences. That is, fitting an elliptical component to the data available at the time of publication of Hezaveh et al. (2013) recovers the model shown here, while fitting a circularly symmetric Gaussian source to the data from both array configurations recovers the model shown in Hezaveh et al. (2013). The higher-resolution data now available clearly resolve the source into four images, which was not apparent in the lower-resolution data. The full data strongly prefer the elliptical source-plane model over a circularly symmetric model.
SPT0532-50 – This source shows a clear hole in the center of a ring of emission, and is magnified by a factor of 10.
SPT0538-50 – This source has been the subject of detailed studies by Bothwell et al. (2013) and Spilker et al. (2015), and was included in the sample of Hezaveh et al. (2013). Our model confirms the need for two source-plane components, which Spilker et al. associate with the two velocity components seen in observations of CO(1–0) and CO(3–2).
SPT2031-51 – A single Sérsic component is sufficient to accurately reproduce the ALMA data. The source is magnified by a factor of .
SPT2048-55 – The lens in this system appears to have a tidal feature extending to the west of the galaxy; nevertheless, a single SIE lens and background Sérsic component fit the data quite well.
SPT2052-56 – This source is not pointlike at 0.5” resolution, but appears completely unlensed. A symmetric Gaussian with 10.9 mJy reproduces the data well.
SPT2103-60 – This source presents an unusual lensing geometry, caused by the combined effects of the three foreground galaxies. We place loose priors on the locations of the three lensing galaxies but do not require that they have the same relative locations as seen in the VLT/ISAAC image. Remarkably, a single source-plane component adequately reproduces the data.
SPT2132-58 – The background source in this system is moderately resolved by ALMA. Imaging only the visibilities with baselines 75 k confirms the arc-like structure with faint counterimage predicted by the best-fit model. This source was studied in detail by Béthermin et al. (2016).
SPT2134-50 – A single source-plane component with half-light radius of just 270 pc is magnified by a factor of 21 in this source.
SPT2146-55 – This source, at , is well-described by a single SIE lens and background Sérsic component.
SPT2146-56 – This source appears pointlike in the ALMA data, and lies on top of a galaxy identified at . The unresolved SED of this source (Strandet et al., in prep.) is also atypical, showing what appears to be two dust peaks. Whatever the true nature of this source, it does not appear to be a galaxy-scale lensed DSFG.
SPT2147-50 – A simple SIE lens and single Sérsic background component are sufficient to reproduce the ALMA data.
SPT2300-51 – No sources were detected at significance within the ALMA primary beam half-power radius, and this object was determined to be a spurious detection in the LABOCA follow-up of SPT sources. This source is shown in Fig. 8. Two potential sources exist at approximately the 38% and 25% primary beam response levels, with nominal significance of 4 and , respectively; we consider both likely to be false.
SPT2311-54 – This source is only marginally resolved by ALMA, but we have measured distinct lens and source redshifts which confirm the lensed nature of this source. Imaging only those visibilities with baselines 150 k reveals structure consistent with the best-fit model.
SPT2319-55 – This source at , is well-fit by two source-plane components.
SPT2340-59 – The nature of this source is unclear. While the 870 data appear to show a standard doubly imaged background source, the two images were also spatially resolved in an ALMA 3 mm project to determine its redshift. These data show a weak line, identified as CO(4–3), in the eastern component only (Strandet et al., 2016). This suggests the two images seen at 870 may in fact be two unlensed or weakly lensed sources at different redshifts. In Fig. 2, we show the model assuming the two sources seen by ALMA are lensed images of the same source, in which case the source is magnified by a factor of and has 9.1 mJy. If, on the other hand, the two images are distinct sources, we derive their intrinsic properties by fixing the position of the foreground lens galaxy to the location in the VLT/FORS2 image. This yields , 15.2 mJy and , 8.7 mJy for the western and eastern components, respectively.
SPT2349-50 – This source is doubly imaged by the foreground lens. Imaging the visibilities on baselines 125 k clearly resolves the two lensed images separated by 0.5”.
SPT2349-56 – We detect six sources at significance in this source, none of which appear to be significantly lensed. ALMA 3 mm data (Strandet et al., 2016) resolve the bright northern component from the three more southern components. A line identified as CO(4–3) in these data, along with [CII] confirmation using APEX, places this source at . It is unclear whether all six components detected at 870 are at the same redshift or whether they represent a chance alignment of sources at different redshifts. Only three of the six components are spatially resolved at the 0.5” resolution of these data.
SPT2354-58 – This source likely has the lowest confirmed redshift of any object in the SPT sample, at (Strandet et al., 2016). Imaging the visibilities with baselines 125 k confirms the arc and counterimage predicted by the best-fit model, separated by 0.5”.
SPT2357-51 – This source, at , does not obviously separate into multiple images in the ALMA data. If the source were unlensed, however, its implied flux density would be mJy, the brightest of any DSFG. Given this and the proximity of foreground galaxies along the line of sight, we consider the lensing hypothesis more probable. The current data are well-fit by a single Gaussian component magnified by a factor of 2.9.
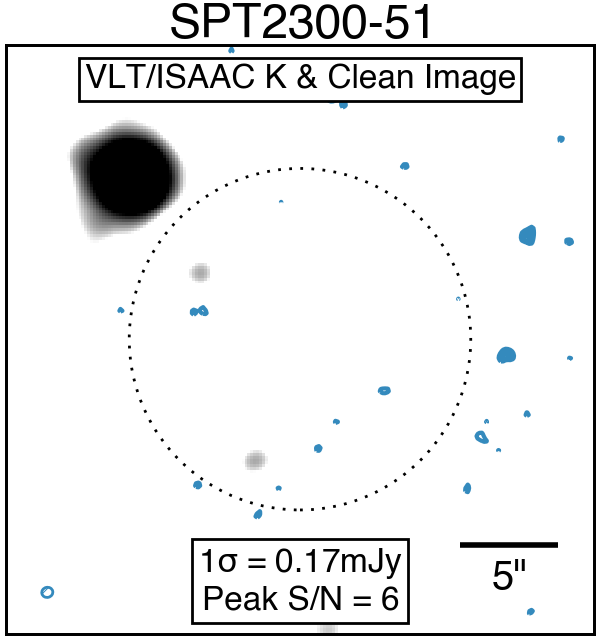
Appendix B Cluster-Lensed Sources
In this appendix we show the ALMA images of the four sources which appear to be lensed by large groups or clusters of galaxies. The ALMA data show only single images of the background sources, making lens models impossible to constrain from the limited data available.
