Are IRIS bombs connected to Ellerman bombs?
Abstract
Recent observations by the Interface Region Imaging Spectrograph (IRIS) have revealed pockets of hot gas (2–8104 K) potentially resulting from magnetic reconnection in the partially ionized lower solar atmosphere (IRIS bombs; IBs). Using joint observations between IRIS and the Chinese New Vacuum Solar Telescope, we have identified ten IBs. We find that three are unambiguously and three others are possibly connected to Ellerman bombs (EBs), which show intense brightening of the extended Hα wings without leaving an obvious signature in the Hα core. These bombs generally reveal the following distinct properties: (1) The O iv 1401.156Å and 1399.774Å lines are absent or very weak; (2) The Mn i 2795.640Å line manifests as an absorption feature superimposed on the greatly enhanced Mg ii k line wing; (3) The Mg ii k and h lines show intense brightening in the wings and no dramatic enhancement in the cores; (4) Chromospheric absorption lines such as Ni ii 1393.330Å and 1335.203Å are very strong; (5) The 1700Å images obtained with the Atmospheric Imaging Assembly on board the Solar Dynamics Observatory reveal intense and compact brightenings. These properties support the formation of these bombs in the photosphere, demonstrating that EBs can be heated much more efficiently than previously thought. We also demonstrate that the Mg ii k and h lines can be used to investigate EBs similarly to Hα, which opens a promising new window for EB studies. The remaining four IBs obviously have no connection to EBs and they do not have the properties mentioned above, suggesting a higher formation layer possibly in the chromosphere.
1 Introduction
Recent high-resolution observations by the Interface Region Imaging Spectrograph (e.g., De Pontieu et al., 2014a) have provided fascinating new insights into the energetics of the lower solar atmosphere (e.g., Peter et al., 2014; Tian et al., 2014a; De Pontieu et al., 2014b; Hansteen et al., 2014; Testa et al., 2014). One new finding is the discovery of absorption lines (singly ionized or neutral) superimposed on the greatly broadened transition region lines (Peter et al., 2014). Such line profiles are typically found in small-scale compact bright regions from slit-jaw images (SJI) taken with the 1400Å and 1330Å filters, and they were suggested to indicate local heating of the photosphere or lower chromosphere to 8104 K under the assumption of collisional ionization equilibrium. However, Judge (2015) performed an independent analysis of the same dataset and suggested that these events arise from plasma originally at pressure between 80 and 800 dyne cm-2, which places the origin of these events in the low-middle chromosphere or above. In this paper we call these evens IRIS bombs (IBs).
Peter et al. (2014) mentioned that these IBs may be connected to Ellerman bombs (EBs), which were discovered by Ellerman (1917) and characterized as intense short-lived brightening of the extended wings of the Hα line at 6563Å. These events were first called ”solar hydrogen bombs” and renamed as EBs by McMath et al. (1960). Pariat et al. (2007) and Socas-Navarro et al. (2006) found that EBs can also be observed in the Ca ii 8542Å line. Although some studies put the formation layer of EBs in the low chromosphere (e.g., Schmieder et al., 2004; Yang et al., 2013), recent high-resolution observations suggested that EBs are a purely photospheric phenomenon and that they often reveal upright flame morphology in limbward viewing (e.g., Watanabe et al., 2011; Nelson et al., 2015). Recently, Rutten et al. (2013) and Vissers et al. (2015) pointed out that many previously identified EBs are likely ”pseudo-EBs”, which are the much more ubiquitous facular or network bright points and their brightenings in Hα wings are usually not as significant as those of EBs (Watanabe et al., 2011). These ”pseudo-EBs” are indicators of deeper-than-normal radiation escape rather than magnetic reconnection. It is suggested that at least some EBs mark anti-parallel reconnection in the photosphere during the emergence of active regions (e.g., Vissers et al., 2013; Reid et al., 2016). Modeling of the Hα wing enhancement generally indicates a temperature increase by a few hundred to 3000 Kelvin in the upper photosphere or lower chromosphere (e.g., Fang et al., 2006; Isobe et al., 2007; Bello González et al., 2013; Berlicki & Heinzel, 2014; Hong et al., 2014). For details about the morphology and properties of EBs, we refer to the reviews of Georgoulis et al. (2002) and Rutten et al. (2013).
Since EBs are defined from Hα observations, simultaneous observations of IRIS and an Hα instrument are required to investigate the relationship between IBs and EBs. Using data taken by the Swedish 1-m Solar Telescope (SST, Scharmer et al., 2003), Vissers et al. (2015) studied five EBs and concluded that strong EB activity can indeed produce IB-type spectra. Based on the joint observations between IRIS and the New Solar Telescope(NST, Cao et al., 2010) on 2014 July 30, Kim et al. (2015) identified the connection between an obvious IB and a weak EB. Apparently, more coordinated observations between IRIS and Hα instruments need to be performed to investigate the relationship between IBs and EBs. This type of observations can also provide important constraint to numerical simulations of magnetic reconnection in the partially ionized lower solar atmosphere (e.g., Murphy & Lukin, 2015; Ni et al., 2015).
Here we use joint observations between IRIS and the Chinese 1-m New Vacuum Solar Telescope (NVST, Liu et al., 2014) to examine the possible connection between IBs and EBs. The NVST belongs to a new generation of large and high-technology solar facilities of China and one of the post-focus instruments is the Multi-channel High Resolution Imaging System, including Hα, G-band, TiO band, Ca ii 8542Å and He i 10830Å wavelengths (Xu et al., 2013). In the present paper, among the data taken with the NVST, we only report results obtained in the Hα channel, of which the central wavelength can be tunable in the range of 6562.8 +/– 4Å and the full bandpass width is 0.25Å. Our investigation clearly reveals that some IBs are connected to EBs and others are not.
2 Observations
The joint IRIS and NVST observations were performed on 2015 May 2. IRIS performed a very large dense raster (175′′ along the slit, 400 raster steps with a step size of 0.33′′) of the emerging NOAA active region (AR) 12335 from 02:34 UT to 03:36 UT. The pointing coordinate was (–814′′, –222′′), close to the east limb. The data was summed onboard by 2 both spectrally and spatially, leading to a spatial pixel size of 0.33′′ and a spectral dispersion of 0.026 Å/0.051 Å per pixel in the far/near ultraviolet wavelength bands. The cadence of the spectral observation was 9.2 seconds, with an exposure time of 8 seconds. Slit-jaw images (SJI) in the 1400Å (mainly ultraviolet continuum and Si iv), 1330Å (mainly ultraviolet continuum and C ii) and 2796Å (mainly Mg ii k) filters were taken with a cadence of 36.7 seconds for each filter. Dark current subtraction, flat field, geometrical and orbital variation corrections have been applied in the level 2 data used here. The fiducial lines are used to achieve a coalignment between different SJI filters and different spectral windows. The SJI images are internally coaligned by removing the solar rotation effect.
The NVST observation lasted from 01:11 UT to 03:59 UT. We took images of the Hα line core, blue wing at –1Å and red wing at +1Å alternately, with a cadence of 52 seconds for each filter. These images have a spatial pixel size of 0.167′′ and a field of view of 153′′153′′. The data reduction of the dark current and flat field modification was followed by the image reconstruction precess based on the speckle masking method (Weigelt, 1977; Liu et al., 1998). We rotate the NVST images by 54.28∘ so that the vertical dimension of the images is oriented in the north-south direction, same as the IRIS images. The coalignment between IRIS images and NVST images in different filters is achieved by doing the following: We first build a Mg ii k core image and a wing (sum of –1.33Å and +1.33Å) image from the IRIS spectral data taken at different times. Bright features visible in the Mg ii k core/wing image are then compared with the associated bright dynamic features in Hα core/wing image sequences.
To investigate the response of IRIS bombs at different temperatures and study the magnetic field structures associated with these bombs, we have also analyzed the data taken by the Atmospheric Imaging Assembly (AIA, Lemen et al., 2012) and the Helioseismic and Magnetic Imager (HMI, Scherrer et al., 2012) onboard the Solar Dynamics Observatory (SDO, Pesnell et al., 2012). The AIA images were taken with a cadence of 12 seconds in the 171Å and 193Å passbands and 24 seconds in the 1700Å passband. The cadence of the line-of-sight magnetograms taken by HMI is 45 seconds. The pixel sizes of the AIA and HMI images are 0.613′′ and 0.504′′, respectively. We coalign the AIA 1700Å (mainly ultraviolet continuum formed around the temperature minimum) and IRIS 1400Å images by checking locations of the commonly observed sunspots and some bright features. The AIA 171Å and 193Å images should then be automatically aligned with the IRIS images since AIA images in different passbands are automatically coaligned after applying the standard SolarSoft (SSW) routine aia_prep.pro. The coalignment between HMI magnetograms and IRIS images is achieved by matching the bright network lanes in 1400Å images and the flux concentrations in magnetograms immediately outside the AR.
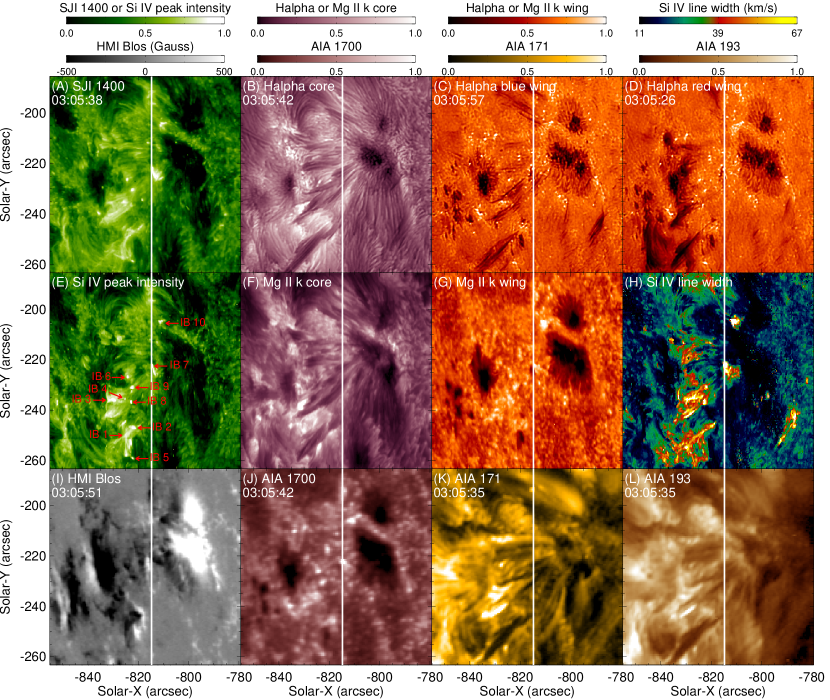
Figure 1 presents the IRIS/SJI 1400Å image, NVST Hα core and wing images, HMI magnetogram, AIA 1700Å, 171Å and 193Å images taken around 03:05:38 UT. Also shown are the Mg ii k core and wing images, as well as the intensity and line width images obtained by applying a single Gaussian fit to the Si iv 1393.755Å line profiles. The region shown here represents only part of the full field of view of IRIS. Time sequences of these images are presented in two online movies. To demonstrate the good coalignment of images taken by different instruments, contours of the AIA 1700Å images are also overplotted in one movie.
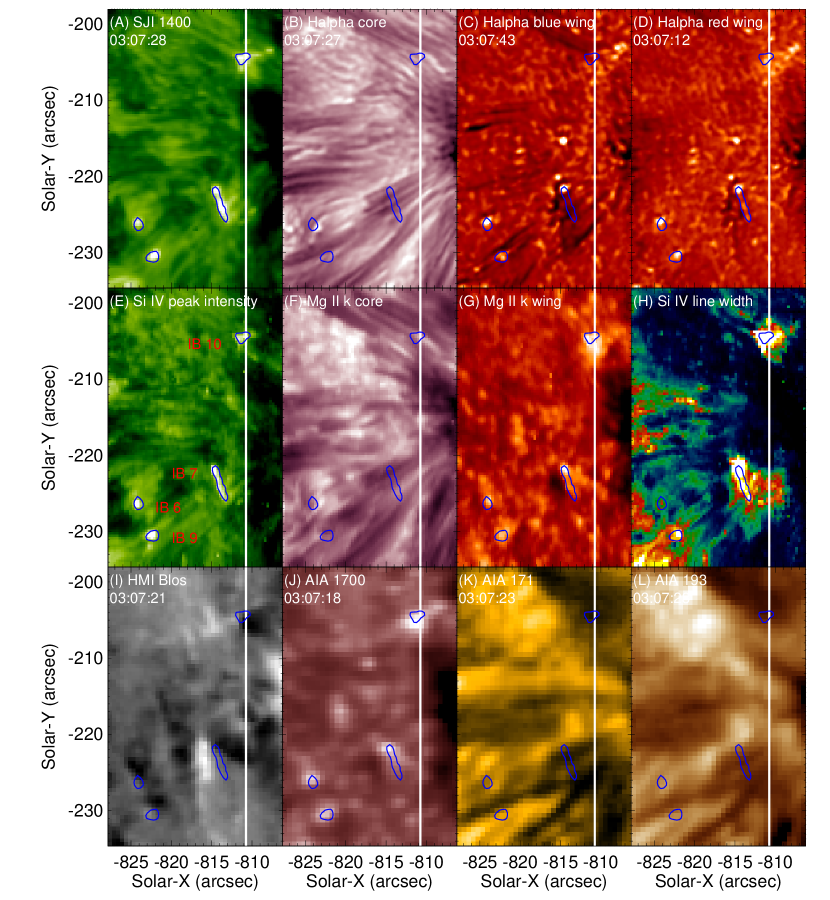
To take a closer look at a few IBs we also show only a small region around the coordinate of (–817′′, –216′′) in Figure 2 and the associated online movie. Four IBs have been identified in this region (see below). The online movie reveals some dark filamentary structures in the Hα wings, especially in the blue wing. As we will show below, these long structures are presumably chromospheric spicules and they could affect the detection of EBs.
3 Results and Discussion
3.1 Identification of IRIS bombs
We identify IBs based mainly on the far ultraviolet spectra. We first select all substantial and compact brightenings in the Si iv 1393.755Å intensity image. Line profiles in these brightenings are then inspected. IBs are defined as those brightenings with chromospheric absorption lines superimposed on greatly broadened and enhanced non-Gaussian profiles of transition region lines (e.g., Si iv and C ii). The absorption feature needs to be obvious for at least the Ni ii 1393.330Å and 1335.203Å lines. Based on this criterion, we have identified ten IBs sampled by the slit and their locations are indicated in Figure 1(E).
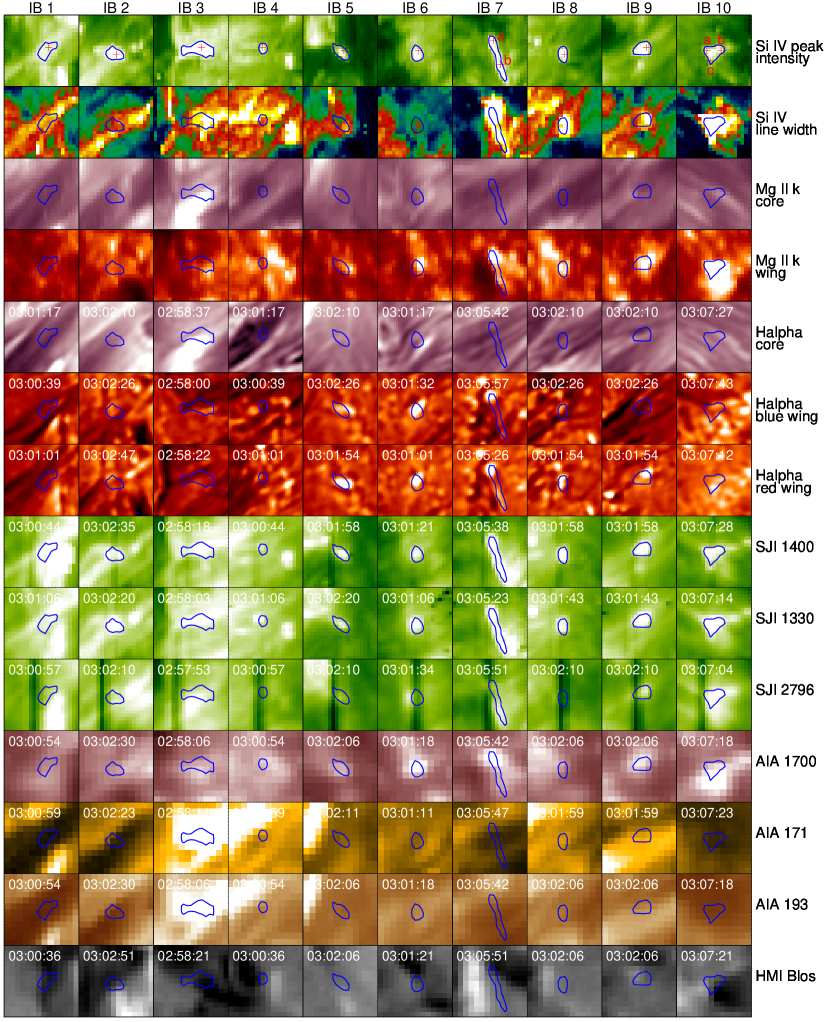
Figure 3 presents images of the Si iv 1393.755Å intensity and line width, Mg ii k core and wing, SJI 1400Å, 1330Å and 2796Å, Hα core and wings, line of sight component of the photospheric magnetic field, AIA 1700Å, 171Å and 193Å in a small region enclosing each identified IB. We can see that all IBs are associated with enhanced line width of the Si iv line. IBs are also clearly observed in both the SJI 1400Å and 1330Å images, which can be understood since the Si iv and C ii lines are usually greatly enhanced in IBs. Signatures of IBs are less obvious in the SJI 2796Å images, suggesting that the Mg ii k line does not always have a relevant response.
The four IBs identified by Peter et al. (2014) are all associated with mixed magnetic field polarities and at least one of them show clear signature of flux cancelation during the observation. Vissers et al. (2015) also found association of a few IBs with strong opposite-polarity fluxes. The HMI data presented in Figure 3 reveals a similar pattern: most IBs appear to be sitting at the magnetic field polarity inversion lines. This likely suggests energization of these IBs through interaction between strong fluxes with opposite polarities, likely anti-parallel magnetic reconnection. The association with strong opposite-polarity fluxes is not obvious for IBs 5, 8 and 9, which might be consistent with the third of the three scenarios proposed by Georgoulis et al. (2002). This scenario involves interaction between the emerging vertical fields and preexisting horizontal fields. In this case the line of sight components of the interacting magnetic fluxes are not necessarily opposite in polarity. However, it might also be related to the line of sight effect as the observed region is close to the limb.
We also try to identify possible coronal signatures of IBs from both the IRIS spectra and AIA images. We find no obvious emission of the IBs in both the Fe xii 1349.38Å and Fe xxi 1354.08Å lines (not shown here). We realize that both lines are forbidden lines, so that the absence of these lines might be caused by the large density in the source regions of IBs. However, AIA observations in the 171Å (dominated by emission from Fe ix/Fe x) and 193Å (dominated by emission from Fe xii) passbands also reveal no obvious brightening at locations of most IBs. A possible exception is IB 3, where a very intense loop-like brightening can be identified from both the 171Å and 193Å images. We thus conclude that IBs are generally not heated to coronal temperatures.
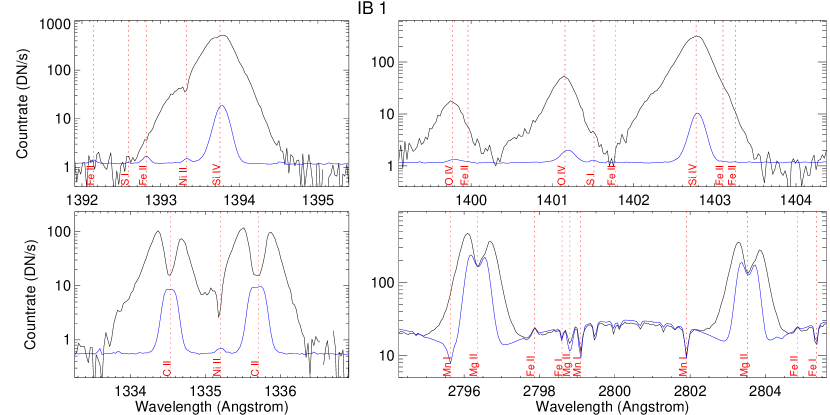
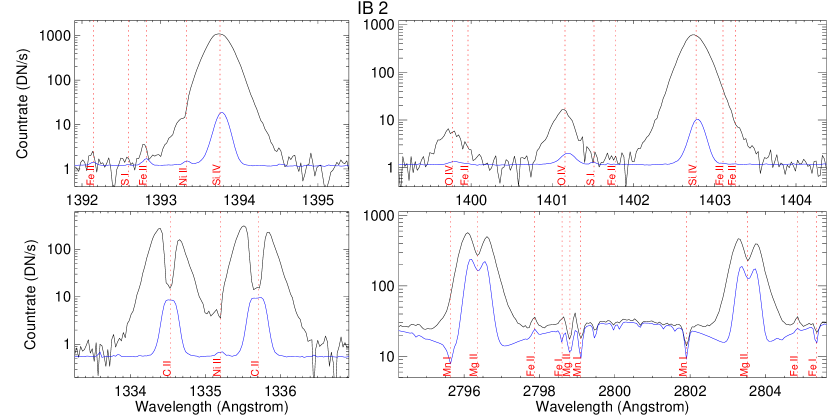
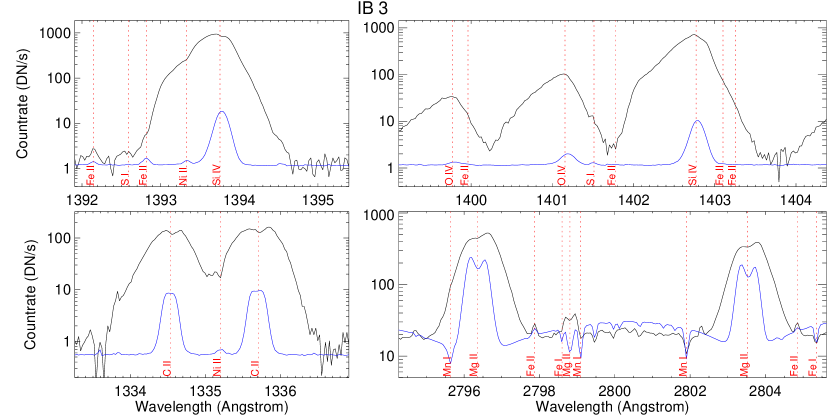
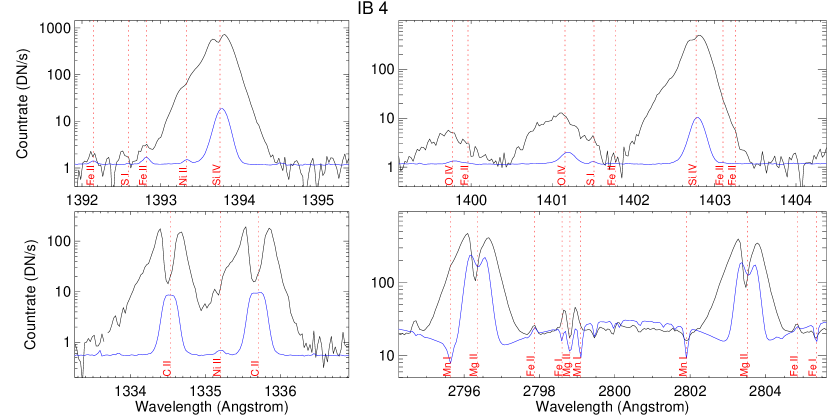
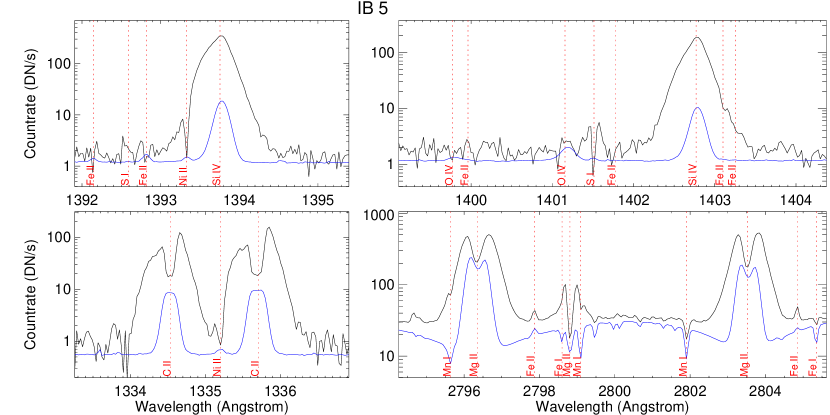
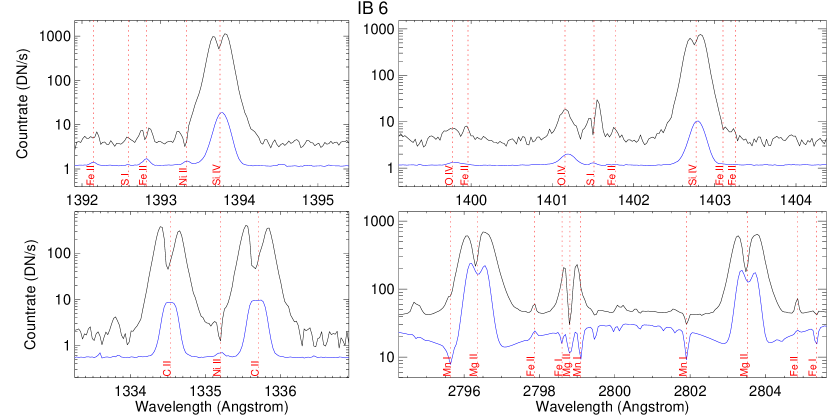
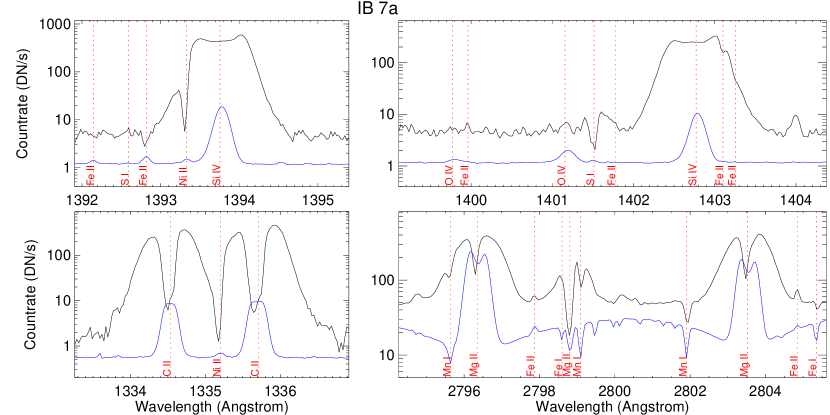
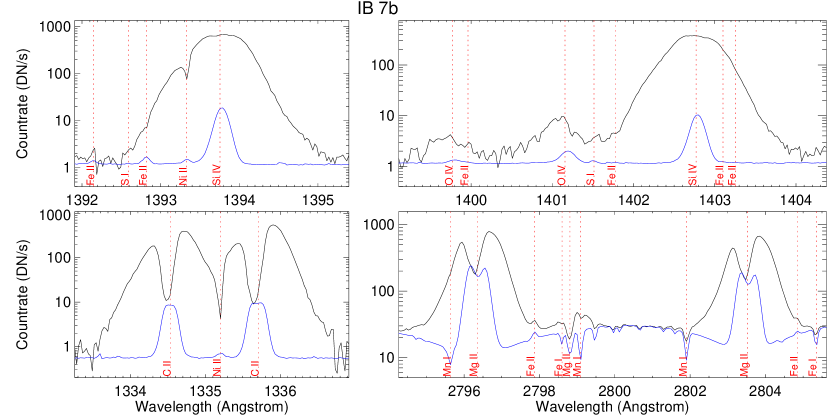

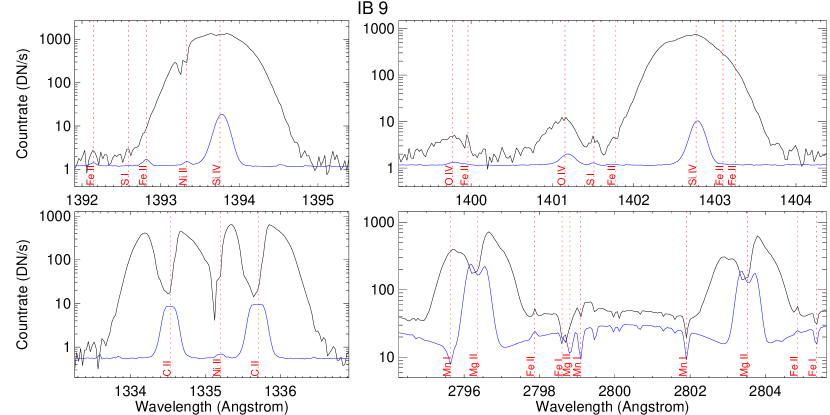

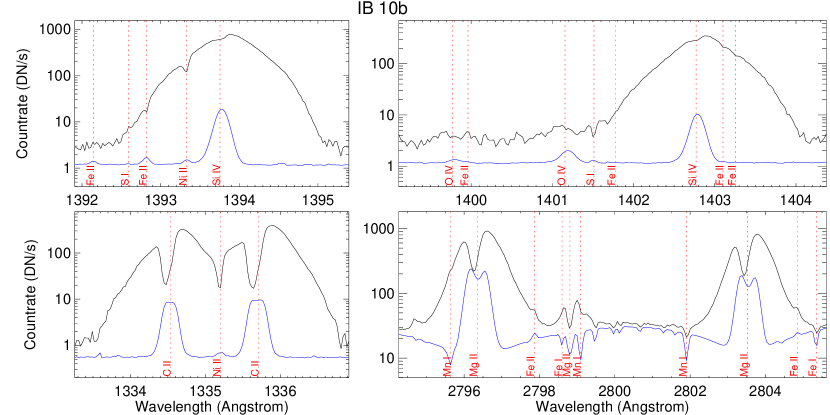
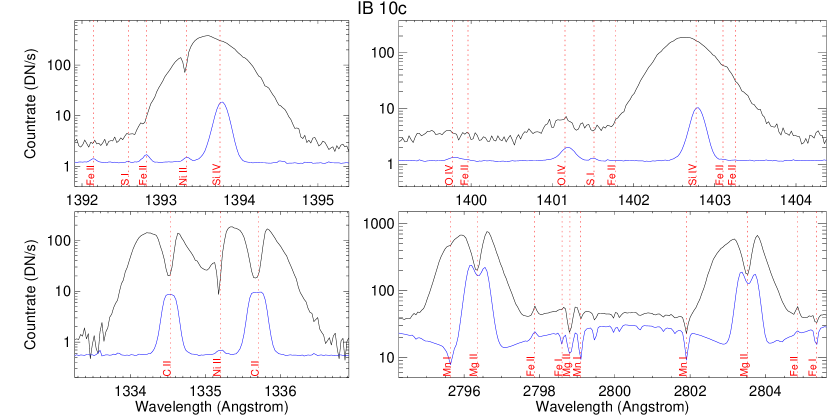
Typical line profiles of the ten IBs are shown in Figures 4–9, where the line profiles averaged over a quiet plage region (Solar-X=[–788.5′′ : –775.6′′], Solar-Y=[–222.8′′ : –185.2′′]) are also overplotted for reference. The reference line profiles are also used to perform absolute wavelength calibration. For the Si iv 1393.755Å spectral window, the chromospheric Fe ii 1392.817Å and Ni ii 1393.330Å lines in the reference spectrum are assumed to have zero Doppler shifts. These cold lines are known to show negligible average velocities in quiet regions. For the Si iv 1402.770Å window, in principle we can assume a zero shift of the S i 1401.514Å line. However, this line appears to be weak and also too close to the O iv 1401.156Å line. Instead, we calibrate the wavelength for this window by forcing the Si iv 1402.770Å and 1393.755Å lines in the reference spectra to have the same Doppler shift. For the C ii window, the Ni ii 1335.203Å line is assumed to have zero shift. The wavelength calibration has been confirmed by the similar Doppler shifts of the Ni ii 1335.203Å and 1393.330Å absorption lines in the IBs. Absolute wavelength calibration in the Mg ii window is much easier since many strong neutral absorption lines are present in the reference spectrum. These neutral lines can be safely assumed to have zero shifts.
As expected, all the IBs show greatly enhanced and broadened profiles of the Si iv, C ii and Mg ii lines, although the Mg ii signature appears to be less obvious for some IBs. Obvious enhancement in one or both wings of the Si iv lines, which are usually believed to be associated with reconnection outflows (bidirectional jets or unidirectional jets, Innes et al., 1997), can be clearly identified for most bombs. These line profiles are generally similar to those of transition region explosive events (EEs), which are also believed to result from reconnection (e.g., Dere et al., 1989; Innes et al., 1997; Chae et al., 1998; Madjarska et al., 2004; Ning et al., 2004; Teriaca et al., 2004; Zhang et al., 2010; Huang et al., 2014; Gupta & Tripathi, 2015). The most distinct difference between EEs and IBs may be the formation height: EEs are formed in the transition region, and IBs are formed lower down as suggested by the chromospheric absorption lines. It is also likely that some previously identified EEs are actually IBs. As demonstrated by Yan et al. (2015), the narrow absorption features in the far ultraviolet spectra of IRIS may not be unambiguously resolved by previous moderate-resolution instruments such as the Solar Ultraviolet Measurements of Emitted Radiation instrument (SUMER, Wilhelm et al., 1995) on board the Solar and Heliospheric Observatory (SOHO). So from spectra taken with these instruments, one can not distinguish between EEs and IBs. We also see obvious absorption features at the cores of the two Si iv lines for IBs 4 and 6. The intensity ratio of the two Si iv lines is 1.55 for these two line profiles. This ratio is much smaller than the ratio derived from the reference line profiles, which is 1.93 and close the expected value 2 in optically thin cases. The dip appears to be stronger in the 1393.755Å line. These results suggest that the central absorption feature likely results from self-absorption of the Si iv lines rather than bidirectional jets (Yan et al., 2015). It is unclear why the opacity effects become prominent in these IBs.
Some singly ionized absorption lines are clearly superimposed on the enhanced line profiles of Si iv and C ii. These lines include Ni ii 1335.203Å, Fe ii 1392.817Å, Ni ii 1393.330Å, Fe ii 1403.101Å and Fe ii 1403.255Å, with the Ni ii lines being the strongest. They are clearly emission lines in the quiet plage region. Under ionization equilibrium these lines are typically formed at a temperature of log (T/K)4.15, in the upper chromosphere. In IBs they generally reveal a blue shift less than 10 km s-1, although a large blue shift of 20 km s-1 is found for IB 9. It is believed that these absorption lines result from the largely undisturbed upper chromosphere and they suggest the presence of hotter gas (up to the Si iv formation temperature 8104 K) below the upper chromosphere (Peter et al., 2014; Vissers et al., 2015).
The Mg ii 2798.809Å line is a self blend of two lines at 2798.754Å and 2798.822Å. In most observations they appear as absorption lines, but they come into emission above the limb and in energetic phenomena such as flares (e.g., Tian et al., 2015). Pereira et al. (2015) undertook a forward modeling study of this line using three-dimensional radiative magnetohydrodynamic (RMHD) models, and found that it changes from absorption to emission when strong heating occurs in the lower chromosphere. Interestingly, this line shows enhanced wings in all IBs except IBs 1 and 9. The shape of this line is similar to the Mg ii k line at 2796.347Å and Mg ii h line at 2803.523Å for most IBs. This feature was also noticed by Vissers et al. (2015).
3.2 Connection between IRIS bombs and Ellerman bombs
We now examine the relationship between IBs and EBs. Since EBs are usually defined from Hα images, we first examine possible signatures of IBs in the Hα core and wing images taken with NVST. It has already been demonstrated that the NVST Hα data can be very useful when studying filaments and dynamic events in the lower solar atmosphere (e.g., Yang et al., 2015a, b; Bi et al., 2015; Yan et al., 2015a, b; Xue et al., 2016). The Hα data acquired during our joint observation is good enough for the identification of EBs. The contrast on the NVST images appear not constant over time due to the varying seeing condition, which has little effect on our identification of EBs since the Hα wing brightenings discussed below are mostly very strong.
From Figure 3 we find that some IBs appear to be associated with EBs and others are not. IBs 1–4 are clearly not connected to EBs. No obvious brightening can be identified from either the Hα wing or core images for IBs 1, 2 and 4. While for IB 3 significant brightening can only be identified from the Hα core image. These signatures are not EB signatures. IBs 5, 6 and 7 reveal typical signatures of EBs, which include substantial brightening in both wings of Hα and no obvious enhancement in Hα line core. The latter suggests that these IBs lie below the chromospheric fibril canopy visible in the Hα core images. The wing brightenings clearly exceed those from the much more ubiquitous facular bright points (pseudo-EBs or network bright points, Rutten et al., 2013). We notice that IB 7 reveals as a long bright structure in the Si iv intensity image. Its northern part coincides with significant enhancement in both wings of Hα. However, only the red wing of Hα shows a less prominent enhancement in the southern part. The SJI 1400Å images in the online movies suggest that these two parts might be related to two different brightenings. Despite this possibility, we still regard these two neighboring parts as one IB since they could not be separated in the Si iv intensity image. In the following we select one position at each of the two parts in IB 7 for line profile analysis (positions a and b marked in Figure 3). IBs 8, 9 and 10 are possibly EBs. These three IBs all show no obvious core enhancement and clear red wing enhancement. However, the blue wing enhancement is less obvious for IB 8 and not present for IB 9, which may result from the obscuration by spicules. From the online movie associated with Figure 2, we see that this is indeed the case for IB 9. The blue wing shows no obvious signature when a spicule is launched nearby. However, the blue wing reveals a significant enhancement after the spicule fades away. No significant blue wing enhancement can be identified for IB 10. We notice that IB 10 is an anemone jet (Shibata et al., 2007) revealing an obvious inverted–”Y” morphology (Figure 2). The jet reveals as a bright collimated structure in the SJI 1400Å images and a dark one in the Hα blue wing images, similar to the quiet-Sun network jets or rapid blueshifted excursions (Tian et al., 2014a; Rouppe van der Voort et al., 2015). We select three positions in IB 10 for detailed analysis of the line profiles: a at the upward jet, b and c at the two legs of the inverted–”Y” structure. The line profiles at positions b and c discussed below suggest that IB 10 is possibly an EB.
| IB | Hα enhancement | Si iv /O iv | Mg ii k & h enhancement | NUV continuum enhancement? | Mn i absorption on Mg ii k wing? | Ni ii absorption | AIA 1700Å brightening | S i broadened with reversal? |
| 1 | no | 7 | no | no | no | moderate | diffuse, weak | no |
| 2 | no | 49 | no | no | no | weak | diffuse, weak | no |
| 3 | core | 7 | wings, core | no | no | weak | diffuse, weak | no |
| 4 | no | 32 | no | no | no | weak | diffuse, weak | no |
| 5 | wings | 154 | wings | slightly | yes | strong | compact | yes |
| 6 | wings | 69 | wings | yes | yes | moderate | compact, strong | yes |
| 7 | wings | 498 | wings | yes | yes | strong | compact, strong | yes |
| 8 | red wing | 129 | wings | yes | yes | strong | diffuse, weak | no |
| 9 | red wing | 143 | wings | yes | no | strong | compact, strong | no |
| 10 | red wing | 239 | wings | slightly | yes | moderate | compact, strong | yes |
Peter et al. (2014) found that the O iv 1401.156Å and 1399.774Å lines are absent in their four identified IBs. In our data we find that the O iv lines are absent in some IBs but clearly present in other IBs. We have calculated the intensity ratio of the Si iv 1402.770Å and O iv 1401.156Å lines for each line profile presented in Figures 4–8, and found that the ratio is larger than 60 for IBs 5, 6, 7, 8, 9 and 10 (positions b and c). The absence of the O iv line emission has been previously found in sub-arcsecond bright dots above the sunspots’ transition region (Tian et al., 2014b) and small-scale brightenings at the footpoints of hot loops (Testa et al., 2014). Olluri et al. (2013) found that non-equilibrium ionization can lead to the absence of the O iv lines. The O iv lines can also be greatly suppressed in the presence of non-Maxwellian electron distributions (Dudik et al., 2014). A third explanation for the absence of these forbidden lines is the dominance of collisional de-excitation from the meta-stable level over radiative decay in a high density environment (Feldman & Doschek, 1978; Young, 2015). Our result appears to support the third scenario because the absent or weak O iv lines are all found in EB-related IBs or possible EB-related IBs. Since EBs are a pure photospheric phenomenon (e.g., Watanabe et al., 2011), the density should be very high and likely high enough to suppress the radiative decay. On the other hand, IBs 1–4 are not EBs and the strong O iv lines probably suggest a relatively lower density at the formation height. Since the Ni ii 1335.203Å and 1393.330Å absorption lines are also present, these IBs should be located below the upper chromosphere and thus are likely in the lower or middle chromosphere. Using the intensity ratio of the O iv 1401.156Å and 1399.774Å lines, we have derived the electron densities of these IBs under the assumption of ionization equilibrium (CHIANTI v7.1, Landi et al., 2013). The derived densities for IBs 1–4 are in the range of log (/cm-3) = 11.2–11.9, which also suggests the formation of these IBs in the chromosphere. Thus, our results are not necessarily inconsistent with Judge (2015), who placed the origin of IBs in the low-middle chromosphere or above.
The Mg ii k and h lines also show distinctly different behavior for the EB-related IBs and other IBs. From Figures 2 and 3 we can conclude that these Mg ii lines may also be used to identify EBs. For IBs 5–10, we see significant brightening in the Mg ii k wing (–1.33Å and +1.33Å images are similar and thus summed) but no obvious brightening in the Mg ii k line core. These IBs are exactly the ones connected or possibly connected to EBs. While for IBs 1, 2 and 4, we could not identify any significant brightening from either the wing or core images of Mg ii k. At the edge of IB 3 brightening are seen from both the Mg ii k wing and core images. If we replace Mg ii k by Hα, these properties would indicate that these events are not EBs, which is exactly what we concluded above. The different Mg ii k and h line profiles for these two types of IBs can also be seen from Figures 4–9, where we generally see significant enhancement of the Mg ii wings and no dramatic change of the line cores for IBs 5–10. The near ultraviolet (NUV) continuum between the Mg ii k and h lines is also enhanced for IBs 5–10, with the only exception at position b of IB 7. While for IBs 1–4, there is no substantial enhancement of the Mg ii wings beyond –1.33Å/+1.33Å from the line cores. In addition, the NUV continuum is even suppressed or only slightly enhanced for these IBs. Since the Mg ii k and h cores sample the chromospheric fibrils and wings are formed lower down, the different behavior mentioned above confirms that IBs 5–10 are likely also EBs formed in the photosphere and that IBs 1–4 are not. The enhanced NUV continuum in IBs 5–10 also support our argument that these IBs are likely generated in the photosphere. Our finding suggests that the Mg ii k and h lines may be used similarly to the Hα line for the identification and investigation of EBs. This would open a very promising new window for EB studies since the Mg ii k and h data are routinely acquired in the seeing-free IRIS observations. To elaborate this we plan to perform a more detailed analysis using more coordinated observations between IRIS and NVST in the near future.
We also notice that the chromospheric absorption lines such as Ni ii 1393.330Å and 1335.203Å, which are superimposed on the broadened and enhanced wings of the Si iv and C ii lines, are usually very strong in EB-related IBs. These absorption features are generally much weaker (shallower) for other IBs. This difference may also indicate that the EB-related IBs are formed deeper in the atmosphere, thus experiencing stronger absorption at the wavelengths of these chromospheric line.
Another interesting feature unique to the EB-related IBs is the superposition of the Mn i 2795.640Å absorption line on the greatly enhanced blue wing of the Mg ii k line. This feature appears to be very obvious for IBs 5, 6, 7 (position a), 8 and 10 (positions b and c). Similarly, we also see the Mn i 2799.093Å absorption feature superimposed on the enhanced red wing of the Mg ii 2798.809Å line for IBs 5, 7 and 10 (position b). All these IBs are connected or possibly connected to EBs, as we mentioned above. Since the Mn i lines are formed in the upper photosphere, their absorption lines superimposed on the greatly enhanced Mg ii lines suggest the formation of these hot IBs below the cooler upper photosphere. This again supports our argument that these IBs are also EBs. Vissers et al. (2015) also found this feature for a few EBs. Similar to us, they also attributed these absorption lines to the foreground upper-photosphere gas above the EBs. These NUV absorption lines generally have no obvious Doppler shift, although a small blue shift of Mn i 2795.640Å appears to be present for IBs 7 (position a) and 8. This confirms that the upper-photosphere gas is generally not impacted by these EB-related IBs, which are a pure photospheric phenomenon.
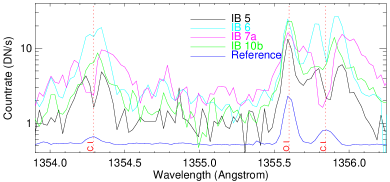
From Figures 6, 7 and 9 we see that the shape of the S i 1401.514Å line profile is similar to those of Mg ii k, Mg ii h and Mg ii 2798.809Å for IBs 5, 6, 7 (position a) and 10 (position b), revealing enhanced wings bridged by a dip at the core. In the quiet plage region, this line is simply a weak emission line and its shape is close to Gaussian. We find that the C i 1354.288Å and 1355.844Å lines reveal a similar behavior for these IBs. While the optically thin O i 1355.598Å line is still very narrow. Figure 10 shows the profiles of these lines for IBs 5, 6, 7 (position a) and 10 (position b). For wavelength calibration the O i 1355.598Å line in the quiet reference spectrum is assumed to have a zero shift. The dramatic change of the S i and C i line profiles in these EB-related IBs is likely caused by the opacity effect. A recent two-cloud model of Hong et al. (2014) reveals an increase of the optical depths when EBs occur, which may result from direct heating in the lower cloud or illumination by enhanced radiation on the upper cloud. The S i and C i line profiles we report here might be related to these processes.
Finally, from Figure 3 we notice that the EB-related IBs mostly show strong and compact brightening in AIA 1700Å images. While this is less obvious for other IBs. It seems that IB 8 is not associated with any compact brightening in the AIA 1700Å image shown in Figure 3. However, an inspection of the associated online movie suggests that this is because IB 8 was scanned during its decaying phase (at 03:02 UT). In its early phase, at around 02:57 UT, this bomb shows a strong and compact brightening in AIA 1700Å. Since the AIA 1700Å passband samples emission mainly from the upper photosphere, it is not surprising that the chromospheric IBs have little response in the AIA 1700Å passband. We notice that strong EBs have been found to show obvious brightenings in both the 1700Å (Vissers et al., 2013) and 1600Å passbands (Qiu et al., 2000), which is consistent with our finding. Rutten (2016) mentioned that the AIA 1700Å and 1600Å channels are also good EB diagnostics because at high temperature they are dominated by the Balmer continuum which shares the Hα properties.
We summarize the characteristics of the ten IBs discussed above in Table 1. These observational signatures indicate that IBs 1–4 are independent of EBs and that IBs 5–10 are likely connected to EBs. For IB 7 the characteristics at positions a is shown in the table. As we mentioned above, the northern (around position a) and southern (around position b) parts of IB 7 might be related to two different brightenings in AIA 1700Å images. We find that position a shows all characteristics typical of EB-related IBs. While position b reveals some difference: the NUV continuum is not enhanced and the S i 1401.514Å line does not reveal a central reversal. However, the O iv lines are weak and the Mn i 2799.093Å absorption feature is superimposed on the enhanced wing of Mg ii 2798.809Å. In addition, the Mg ii k & h wings are enhanced, although not as significant as the enhancement at position a. These characteristics suggest that the southern part is also possibly connected to an EB. IB 10 appears to be an anemone jet (Shibata et al., 2007). The characteristics at the footpoints (positions b & c) of the jet, including the absence of the O iv lines, the superposition of the Mn i absorption lines on the enhanced Mg ii wings, the centrally reversed S i line and the intense AIA 1700Å brightening, suggest that it is likely produced in the photosphere and thus is connected to an EB. These features are absent at the tip of the jet (around position a), consistent with the upward flow location higher up in the atmosphere. In Table 1 we only show the characteristics at positions b for IB 10.
Our finding that some IBs are also EBs greatly challenges previous modelings of EBs, which almost unexceptionally predict a temperature increase by only a few hundred to 3000 Kelvin in the photosphere or lower chromosphere (e.g., Fang et al., 2006; Isobe et al., 2007; Bello González et al., 2013; Berlicki & Heinzel, 2014; Hong et al., 2014). Our observations suggest the need of models which can produce a much stronger temperature increase in the photosphere. A recent numerical simulation by Ni et al. (2015) has predicted heating of the chromospheric plasma to 8104 K, which might explain our IBs 1–4. It would be interesting to move the reconnection sites down to the photosphere and investigate the associated heating process. By assuming local thermodynamic equilibrium (LTE) for line extinctions during the hot and dense EB onsets, recently Rutten (2016) put the formation of the Si iv lines in a temperature environment of 1–2104 K. This temperature, although lower than 8104 K under the assumption of ionization equilibrium, is still much hotter than that predicted by all non-LTE modeling of EBs.
So far we have concluded that some IBs are connected to EBs and other are not. One may then ask another question: Does every EB correspond to an IB? From our observation it is clear that not all EBs are connected to IBs. It is impossible to examine the IRIS spectra for all EBs since many EBs were not sampled by the IRIS slit. In addition, sometimes the distinction between EBs and magnetic concentrations (network bright points) is not easy due to the varying seeing condition. Nevertheless, a rough examination of the Hα wing images suggests that the IRIS slit crossed 30 possible EBs, among which only six show typical IB-type line profiles. So it seems that only a small fraction of the EBs are heated to IB temperatures. The other EBs appear not efficiently heated, and thus do not show IB signatures in the Si iv lines. We notice that these events usually also display wing enhancement in the Mg ii k & h lines, although for many of them the enhancement appears to be weaker compared to that for IB-related EBs. In the near future we plan to do more coordinated observations between IRIS and NVST, and perform a detailed comparison between the unbinned Mg ii and Hα data for EB detection.
4 Summary
Using IRIS, NVST, AIA and HMI observations of an emerging AR, we have identified ten IRIS bombs (IBs) and investigated their possible connection to Ellerman bombs (EBs). Seven of these IBs are sitting above the magnetic polarity inversion lines, suggesting that they might result from the interaction between strong magnetic fluxes of opposite polarities. We find that IBs are generally not heated to coronal temperatures.
From the Hα images, we find that three IBs are also EBs. Another three IBs are possibly EBs. And the remaining four IBs are obviously not EBs. Considering ionization equilibrium this suggests that EBs can be heated to a temperature of 8104 K, one to two orders of magnitude higher than the temperature enhancement predicted from modelings of EBs. According to Rutten (2016), our result would indicate heating of some EBs to only 1–2104 K, which is still much hotter than that predicted by all non-LTE modeling of EBs. The EB-related IBs generally reveal the following distinct properties: (1) The O iv 1401.156Å and 1399.774Å lines are absent or very weak compared to the Si iv 1402.770Å line, likely caused by the high density at the formation height of these IBs. (2) The Mn i 2795.640Å and 2799.093Å lines reveal as absorption features superimposed on the greatly enhanced wings of Mg ii k and Mg ii 2798.809Å lines, suggesting the shielding of these IBs by the upper photosphere. (3) The Mg ii k and h lines show intense brightening in the wings extending to the nearby NUV continuum and no dramatic enhancement in the cores, suggesting that these IBs are shielded by the overlying chromospheric fibrilar canopy; (4) Absorption features corresponding to the chromospheric Ni ii 1393.330Å and 1335.203Å lines are very deep; (5) Intense and compact brightenings can be identified from images of the AIA 1700Å passband which samples the upper photosphere. All together, these features point to the formation of the EB-related IBs in the photosphere. Other IBs may be formed in the chromosphere.
We also find that the shape of the S i 1401.514Å, C i 1354.288Å and 1355.844Å line profiles reveal enhanced wings bridged by a central reversal, similar to those of Mg ii k, Mg ii h and Mg ii 2798.809Å for some EB-related IBs. This behavior likely indicates an increase of the optical depths, as expected when EBs occur (Hong et al., 2014).
Among the ten identified IBs, we find an anemone jet (IB 10) revealing an obvious inverted–”Y” morphology. The characteristics at the footpoints (positions b & c) of the jet suggest that it is possibly generated in the photosphere, thus demonstrating that some anemone jets reported by Shibata et al. (2007) may result from magnetic reconnection in the partially ionized photosphere.
Finally, a comparison between the IRIS and NVST data suggests that the Mg ii k and h lines could be used to investigate EBs similarly to the Hα line, which opens a very promising new window for EB studies since the Mg ii k and h data are routinely acquired in the seeing-free IRIS observations.
References
- Bello González et al. (2013) Bello González, N., Danilovic, S., Kneer, F. 2013, A&A, 557, A102
- Berlicki & Heinzel (2014) Berlicki, A., Heinzel, P. 2014, A&A, 567, A110
- Bi et al. (2015) Bi, Y., Jiang, Y., Yang, J., et al. 2015, ApJ, 805, 48
- Cao et al. (2010) Cao, W., Gorceix, N., Coulter, R.; Ahn, K., Rimmele, T. R., Goode, P. R. 2010, Astronomische Nachrichten, 331, 636
- Chae et al. (1998) Chae, J., Wang, H., Lee, C.-Y., Goode, P. R., Schühle, U., 1998, ApJ, 497, L109
- Dere et al. (1989) Dere, K. P., Bartoe, J.-D. F., & Brueckner, G. E. 1989, Sol. Phys., 123, 41
- De Pontieu et al. (2014a) De Pontieu, B., Title, A. M., Lemen, J. R., et al. 2014a, Sol. Phys., 289, 2733
- De Pontieu et al. (2014b) De Pontieu, B., Rouppe van der Voort, L., McIntosh, S. W., et al. 2014b, Science, 346, 1255732
- Dudik et al. (2014) Dudik, J., Del Zanna, G., Dzifcáková, E., et al. 2014, ApJL, 780, L12
- Ellerman (1917) Ellerman, F. 1917, ApJ, 46, 298
- Fang et al. (2006) Fang, C., Tang, Y. H., Xu, Z., Ding, M. D., Chen, P. F. 2006, ApJ, 643, 1325
- Feldman & Doschek (1978) Feldman, U., & Doschek, G. A. 1978, A&A, 65, 215
- Georgoulis et al. (2002) Georgoulis, M. K., Rust, D. M., Bernasconi, P. N., & Schmieder, B. 2002, ApJ, 575, 506
- Gupta & Tripathi (2015) Gupta, G. R., Tripathi, D. 2015, ApJ, 809, 82
- Hansteen et al. (2014) Hansteen, V., De Pontieu, B., Carlsson, M., et al. 2014, Science, 346, 1255757
- Huang et al. (2014) Huang, Z.-H., Madjarska, M. S., Xia, L., et al. 2014, ApJ, 797, 88
- Hong et al. (2014) Hong, J., Ding, M. D., Li, Y., Fang, C., & Cao, W. 2014, ApJ, 792, 13
- Innes et al. (1997) Innes, D. E., Inhester, B., Axford, W. I., & Wilhelm, K. 1997, Nature, 386, 811
- Isobe et al. (2007) Isobe, H., Tripathi, D., Archontis, V. 2007, ApJ, 657, L53
- Judge (2015) Judge, P. G. 2015, ApJ, 808, 116
- Kim et al. (2015) Kim, Y.-H., Yurchyshyn, V., Bong, S.-C. 2015, ApJ, 810, 38
- Landi et al. (2013) Landi, E., Young, P. R., Dere, K. P., Del Zanna, G., & Mason, H. E. 2013, ApJ, 763, 86
- Lemen et al. (2012) Lemen, J. R., et al. 2012, Solar Phys., 275, 17
- Liu et al. (1998) Liu, Z., Qiu, Y., Lu, R. 1998, SPIE, 3561, 326
- Liu et al. (2014) Liu, Z., Xu, J., Gu, B.-Z., et al. 2014, RAA, 14, 705
- Madjarska et al. (2004) Madjarska, M., Doyle, J. G., van Driel-Gesztelyi, L. 2004, ApJ, 603, L57
- McMath et al. (1960) McMath, R. R., Mohler, O. C., & Dodson, H. W. 1960, Proceedings of the National Academy of Sciences of USA, 46, 165
- Murphy & Lukin (2015) Murphy, N. A., Lukin, V. S. 2015, ApJ, 805, 134
- Nelson et al. (2015) Nelson, C. J., Scullion, E. M., Doyle, J. G., Freij, N., Erdélyi, R. 2015, ApJ, 798, 19
- Ni et al. (2015) Ni, L., Kliem, B., Lin, J., Wu, N. 2015, ApJ, 799, 79
- Ning et al. (2004) Ning, Z., Innes, D. E., Solanki, S. K. 2004, A&A, 419, 1141
- Olluri et al. (2013) Olluri, K., Gudiksen, B. V., & Hansteen, V. H. 2013, ApJ, 767, 43
- Pariat et al. (2007) Pariat, E., Schmieder, B., Berlicki, A., et al. 2007, A&A, 473, 279
- Pereira et al. (2015) Pereira, T. M. D., Carlsson, M., De Pontieu, B., Hansteen, V. 2015, ApJ, 806, 14
- Pesnell et al. (2012) Pesnell, W. D., Thompson, B. J., Chamberlin, P. C. 2012, Sol. Phys., 275, 3
- Peter et al. (2014) Peter, H., Tian, H., Curdt, W., et al. 2014, Science, 346, 1255726
- Qiu et al. (2000) Qiu, J., Ding, M.-D., Wang, H.-M., Denker, C., Goode, P. R. 2000, ApJ, 544, L157
- Reid et al. (2016) Reid, A., Mathioudakis, M., Doyle, J. G., et al. 2016, ApJ, in press
- Rouppe van der Voort et al. (2015) Rouppe van der Voort, L., De Pontieu, B., Pereira, T. M. D., Carlsson, M., Hansteen, V. 2015, ApJL, 799, L3
- Rutten et al. (2013) Rutten, R. J., Vissers, G. J. M., Rouppe van der Voort, L. H. M., Sütterlin, P., & Vitas, N. 2013, Journal of Physics Conference Series, 440, 012007
- Rutten (2016) Rutten, R. J. 2016, arXiv:1601.03280
- Scharmer et al. (2003) Scharmer, G. B., Bjelksjo, K., Korhonen, T. K., Lindberg, B., & Petterson, B. 2003, in Society of Photo-Optical Instrumentation Engineers (SPIE) Conference Series, Vol. 4853, Innovative Telescopes and Instrumentation for Solar Astrophysics, ed. S. L. Keil & S. V. Avakyan, 341-350
- Scherrer et al. (2012) Scherrer, P. H., Schou, J., & Bush, R. I., et al. 2012, Sol. Phys., 275, 207
- Schmieder et al. (2004) Schmieder, B., Rust, D. M., Georgoulis, M. K., et al. 2004, ApJ, 601, 530
- Shibata et al. (2007) Shibata, K., Nakamura, T., Matsumoto, T., et al. 2007, Science, 318, 1591
- Socas-Navarro et al. (2006) Socas-Navarro, H., et al. 2006, Sol. Phys., 235, 75
- Teriaca et al. (2004) Teriaca, L., Banerjee, D., Falchi, A., Doyle, J. G., Madjarska, M. S. 2004, A&A, 427, 1065
- Testa et al. (2014) Testa, P., De Pontieu, B., Allred, J., et al. 2014, Science, 346, 1255724
- Tian et al. (2014a) Tian, H., DeLuca, E. E., Cranmer, S. R., et al. 2014a, Science, 346, 1255711
- Tian et al. (2014b) Tian, H., Kleint, L., Peter, H. et al. 2014b, ApJL, 790, L29
- Tian et al. (2015) Tian, H., Young, P. R., Reeves, K. K. et al. 2015, ApJ, 811, 139
- Vissers et al. (2013) Vissers, G. J. M., Rouppe van der Voort, L. H. M., & Rutten, R. J. 2013, ApJ, 774, 32
- Vissers et al. (2015) Vissers, G. J. M., Rouppe van der Voort, L. H. M., Rutten, R. J., Carlsson, M., De Pontieu, B. 2015, ApJ, 812, 11
- Watanabe et al. (2011) Watanabe, H., Vissers, G., Kitai, R., Rouppe van der Voort, L., & Rutten, R. J. 2011, ApJ, 736, 71
- Weigelt (1977) Weigelt, G. P., 1977, Optics Communications, 21, 55
- Wilhelm et al. (1995) Wilhelm, K., Curdt, W., Marsch, E., et al. 1995, Sol. Phys., 162, 189
- Xu et al. (2013) Xu, Z., Jin, Z.-Y., Xu, F.-Y., Liu, Z. 2013, Proceedings IAU Symposium NO. 300, 117
- Xue et al. (2016) Xue, Z.-K., Yan, X.-L., Zhao, L., et al. 2016, PASJ, 68, 712
- Yan et al. (2015) Yan, L.-M., Peter, H., He, J.-S., et al. 2015, ApJ, 811, 48
- Yan et al. (2015a) Yan, X.-L., Xue, Z.-K., Xiang, Y.-Y., Yang, L.-H. 2015a, RAA, 15, 1725
- Yan et al. (2015b) Yan, X.-L., Xue, Z.-K., Pan, G. M., et al. 2015b, ApJS, 219, 17
- Yang et al. (2013) Yang, H., Chae, J., Lim, E.-K., et al. 2013, Sol. Phys., 288, 39
- Yang et al. (2015a) Yang, S.-H., Zhang, J., Xiang, Y.-Y. 2015a, ApJL, 798, L11
- Yang et al. (2015b) Yang, S.-H., Zhang, J., Jiang, F.-Y., Xiang, Y.-Y. 2015b, ApJL, 804, L27
- Young (2015) Young, P. R. 2015, arXiv:1509.05011
- Zhang et al. (2010) Zhang, M., Xia, L.-D., Tian, H., Chen, Y. 2010, A&A, 520, A37