Observation of spatio-temporal pattern in magnetised rf plasmas
Abstract
We address an experimental observation of pattern formation in a magnetised rf plasma. The experiments are carried out in a electrically grounded aluminium chamber which is housed inside a rotatable superconducting magnetic coil. The plasma is formed by applying a rf voltage in parallel plate electrodes in push-pull mode under the background of argon gas. The time evolution of plasma intensity shows that a homogeneous plasma breaks into several concentric radial spatiotemoral bright and dark rings. These rings propagate radially at considerably low pressure and a constant magnetic field. These patterns are observed to trap small dust particles/grains in their potential. Exploiting this property of the patterns, a novel technique to measure the electric field associated with the patterns is described. The resulting estimates of the corresponding field intensity are presented. At other specific discharge parameters the plasma shows a range of special type of characteristic structures observed in certain other chemical, mechanical and biological systems.
Keywords:
pattern, magnetized plasmas, rf plasmas:
1 Introduction
Pattern formations are apparent in natural systems ranging from clouds to animal markings, and from sand dunes to shells of microscopic marine organisms. Despite the astonishing range and variety of such structures, many have comparable features. Spirals and targets (circular rings) are among the most interesting spatiotemporal patterns which exist in nonequilibrium systems. They are observed in systems whose internal structure and underlying processes, which determine their dynamical properties, are quite different: Examples are classical Belousov-Zhabotinsky reactors zaikin1970 ; winfree1980 , chemical reactions on surfaces bar1995 , systems with Rayleigh-Bnard convection morris1993 , semiconductors rufer1980 , and populations of microorganisms tomchik1981 . It is believed that spirals are important in controlling rhythms of the heart activity in highest organisms, including humans davidenko1992 . Self organised patterns in plasmas have been a topic of interest as they may give a deep insight into self-organisation in complex system as well as transport phenomena in plasmas.
Here we discuss pattern formation in various plasma set ups and describe the first observation of pattern formation in an a low temperature rf produced magnetised plasma. A variety of patterns are observed in our system including random structures, regular dots, filaments, circles, single and multiple spirals. The main control parameters in the experiments are rf voltage, gas pressure, magnetic field and electrode structure. The patterns are seen to have stationary and dynamic characters in various parameter regimes. Although the patterns observed in the our system are of same macroscopic nature, they are formed in a type of plasma environment which is unlike the existing observations of similar patterns in other systems.
In this paper we have compared various plasma experiments showing pattern formations and have described the distinction of the plasma medium used in other experiments with respect to that of the present observation. In the next section we have discuss about the other experimental observation to study the pattern formation in various types of plasma sources. In sec-III, we discuss about our experimental set up and the plasma source. The next section (in sec-IV), describes the experimental observations and the discussion. Finally we have concluded in the last section (section-V).
2 Patterns in laboratory plasmas
Persistent Spiral-Arm Structure of a Rotating Plasma has been observed earlier in a stationary Gas ikehata1998 . The lagging-spiral-arm structure, is observed when an argon plasma, rotating at a supersonic speed, is injected into an argon stationary gas along the magnetic field lines. The rotating plasma is generated by a coaxial plasma gun placed at the end of a uniform magnetic field directed along the diameter of a cylindrical tube of magnetic field of 3.6 kG. The plasma is produced by applying a high current ( kA) in between anode and cathode for a short duration (30 sec) at a pressure range of 10-20 mTorr. The physical origin of the structuring is attributed to the centrifugal instability driven by the velocity shear at the plasma-gas interface and by the radial centrifugal force of rotating liquids and gases. The velocity-shear generation mechanism proposed there is found to be successful in interpreting observations qualitatively.
In another article the experimental observations of zigzag destabilized spirals and targets have been discussed astrov1998 . Experiments have been done on an electronic system which is a dc driven planar semiconductor gas discharge (SGD) device in absence of magnetic fields. Patterns in the system are formed due to the coupling of processes of charge transport in two layers, one being a linear high resistance semiconductor, while the other one, a gas discharge domain, is a medium the transport properties of which are strongly nonlinear. Patterns are studied by capturing the distribution of the discharge glow in the gap. Increasing the feeding voltage for high resistivity of the semiconductor electrode, they observe the patterns in the following sequence: hexagonal to stripes to stripes with defects to rotating spirals.
Although couple of experiments have been reported that study the pattern formation in a plasma medium but their experimental systems are somewhat complicated. The pattern formation in our simple system is stable, long lasting, self-consistent, and have both stationary and dynamic forms. These patterns in our system mainly arise due to the magnetization of ions in a wide range of plasma and discharge parameters. Although, very recently, Mierk et al. mierk2011 reported the formation of patterns in a low-pressure, low-temperature radio-frequency discharge under the influence of a high magnetic field in the same system, here we discuss the variety of pattern formation in larger details. They pointed out that the plasma glow filamented into bright columns parallel to the magnetic field lines, and that the patterns transformed their forms when experimental parameters such as pressure, discharge power or magnetic field-strength are changed.
3 Experimental Setup and Plasma Source
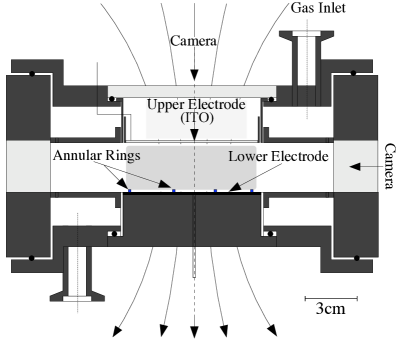
The experiments are carried out in a cylindrical aluminium discharge chamber with an inner diameter of 16 cm and a height of 7 cm (a schematic diagram of the experimental setup is shown in Fig. (1)). It consists of two capacitively coupled parallel plate electrodes which are 3 cm apart from each other. The upper electrode is made of an Indium Tin Oxide (ITO) coated transparent glass plate which has a diameter of 7.3 cm, whereas the lower electrode is made of aluminium of 5.2 cm diameter. Two annular coaxial rings of outer diameters 3 cm and 6 cm (thickness of 2 mm and 3 mm height) are placed on the lower electrode to localize the axial position of the plasma. A high resolution camera is used from the top to capture the plasma dynamics. A second, low resolution camera is used for a side view investigation. The whole experimental chamber is placed inside a superconducting cylindrical magnetic (not shown in the figure) that allows for a magnetic flux density of upto 4 Tesla. The magnetic field is uniform within in the central volume of 10 cm diameter and 5 cm height. Combination of rotary pump with a turbo-molecular pump are used to pump the chamber into the base pressure of mbar pressure. A push-pull rf power supply is used to produce the plasma.
4 Experimental observation and Discussion
A weakly ionized low temperature steady-state homogeneous plasma is formed at working pressure of about Pa between the two electrodes at 60 volt peak to peak voltage. The electron temperature is eV and the ions acquire about room temperature ( eV) due to the high collisionality with the neutrals at that pressure. The magnetic flux density is then ramped up from 0T to 2T in small steps (19 Gauss/sec), keeping all the other discharge parameters (pressure and peak to peak electrode voltages) constant. Plasma remains homogeneous upto when the magnetic flux increased to 0.4T-0.6T ( depending upon the other discharge parameters). Beyond the magnetic flux intensity of 0.8 T, the plasma emission starts showing concentric bright and dark circular patterns in radial direction as shown in Fig. 2(a). The plasma parameters are tabulated in the following table (Table-1). It is clear from table-I, that for our discharge conditions both the electrons and the ions are sufficiently magnetized with the collision mean free path exceeding the ion gyro-radius .
| Parameters | Electrons | ions |
|---|---|---|
| Thermal velocity (m/sec) | ||
| Gyro-frequency (Hz) | ||
| Larmor Radius (mm) | ||
| Collision frequency (Hz) | ||
| Collision time (sec) | ||
| Plasma Frequency (MHz) |
The formation of patterns corresponds to a threshold magnetisation of ions which was verified to be independent of the type of gas used for the discharge mierk2011 . The patterns show a detailed topological variation in its form over a large range of neutral gas pressure, from 3Pa to 0.5Pa. On further reduction of pressure, the plasma gets switched off. Similar kind of patterns formation and variation in their form is observed when the magnetic flux intensity is increased at a constant pressure and other discharge parameters.
The patterns have a strong 2D nature since they show a uniformity in the vertical () direction in the cylindrical discharge chamber which is the direction of observation in the system through an ITO coated glass plate electrode allowing us to capture this symmetry of the patterns. Although the symmetry exist along , most of the pattern structures are found to be irregular in and directions and do not form suitable cases for a simple modeling or analysis. The concentric circular patterns are found to be simplest for the present analysis as they posses an extra symmetry along the direction, leaving an almost regular variation along which can be analysed or modelled using minimum number of paramters. For example,
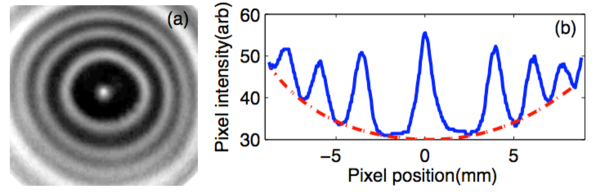
the plasma intensity profile is shown in figure 2(b) corresponding to the circular ring (shown in figure 2(a)). The solid line represents the intensity profiles along the radial direction due to the radially formed azimuthally symmetric patterns. The variation along radial direction is characterizable by two parameters namely, a spatial frequency, and a spatially changing amplitude of the intensity of the light radiated by the ions resulting in the observed patterns. The measured intensity of light received from the patterns does not clearly correspond to the electrostatic potential, because of the issues that in the wider regions of the set up no light intensity is received. An exact calibration and interpretation of the potential/field using this radiation is therefore not possible. The dash line in Fig. 2(b) represents the background intensity profile because of using the central confining aluminium ring. In absence of the ring the curvature of the dashed line reduces to a negligible magnitude. Assuming that the intensity profile nearly corresponds to the plasma density (electric fields), the central brightest ring represents the maximum electric field at the centre. Hence, it can be concluded that the first few azimuthal bright plasma rings provide the higher local electric fields () compared to the background ambipolar electric field () present due to the average potential variation.
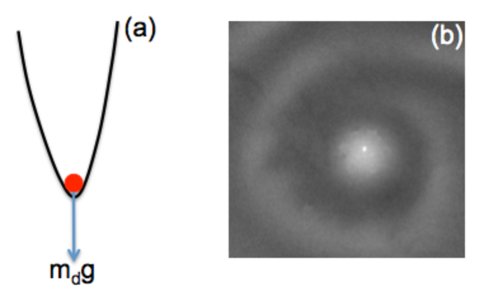
This local electric field due to the ring like structures thus causes the electrons and the ions to rotate in azimuthal direction along the ring with higher angular velocity. To estimate the angular velocity of ions inside the ring we have followed a novel technique by introducing micron-size Melamine Formaldehyde particles of diameter, =9.19 m and mass, kg in to the plasma which is found to be confined in a electrostatic potential well (shown in figure 3(a)). In this technique, we manage to keep only one particle at the centre of the central bright spot, shown in figure 3(b) and then tilt the complete system, including magnetic coil, with respect to gravity and note down the angle of rotation where the particle overcomes the electrostatic potential shown in figure 3(a). We performed this experiment several times with good repeatability to improve the statistics. The average angle thus obtained is degree with about 5% of error. Equating the horizontal component of Earth gravity () to the electrostatic force () acting on the particle, the electric field value is found to be V/m for the particles of charge , where is electronic charge. The ion velocity is then calculated from , which become m/sec for T.
As discussed in the earlier section, the circular plasma rings break into a single spiral when the pressure is reduced further at constant magnetic field and electrode voltage, which is observed to spiral counter clockwise because of crossed background electric () and magnetic fields. We also note that direction of the spiral changes with the change of the direction of magnetic fields confirming this to be related to the motion of the ions. It is also possible to estimate the background electric field () tracing the tail of the spiral. If the time taken by a spiral is known for a complete rotation then angular velocity of that spiral can be roughly estimated. Assuming this to be nearly the velocity of the ions, the electric field comes out to be V/m. On comparison the local electric field () is a few orders higher than the background electric field ().
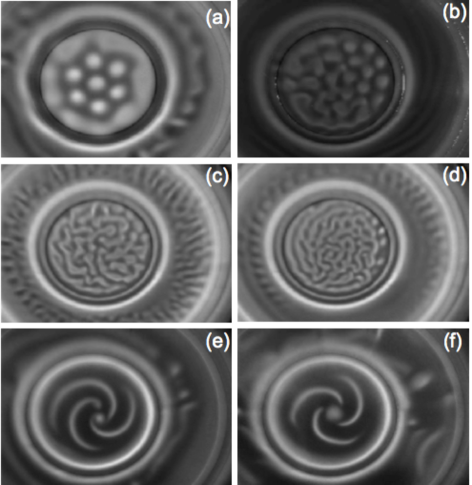
The details of the formation of the circular ring and the spiral and their dynamics, as observed in our experiment, are described elsewhere mierk2011 . A set of similar type of experiments are performed at a wide range of neutral gas pressure and magnetic flux density. In other parametric regime we have also found some zig-zag pattern forms which is shown in figure 4(a)-(d). In the new set of experiments we also note that the evolution of figure 4(a)-(d) happens only when the pressure is reduced from 6pa to 1pa at a constant magnetic flux intensity of 1T. Among other important observation made during the new set of experiments we have also observed on many occasions one spiral breaks into multiple spirals generating patterns with interesting symmetry as shown in Fig. 4(e)-(f).
5 Conclusion
In this article we report an observation of pattern formation in a strongly magnetised capacitatively coupled rf plasma in the back ground of argon gas. The aluminium chamber is placed inside a superconducting magnetic coil which can provide a magnetic flux intensity of homogeneity of . We found that the homogeneous plasma breaks into a number of concentric rings at some threshold pressure, magnetic flux intensity and rf voltages. At a constant voltage and magnetic fields when we reduce the pressure we found that the circular rings converted to single/multiple inward spirals which expands with time in radial direction by rotating along cross electric and magnetic fields. The direction of rotation changes with the change of magnetic fields. Further reduction of pressure the spirals converts to hollow/solid filament rods. The estimation of electric fields suggests that the density inhomogenity because of pattern formations creates local electric fields. The background electric fields generated because of using an aluminium ring is very weak compared to the local electric fields. It is also found that in a wide range of discharge parameters, the patterns assume different kinds of zig-zag and complex spiral structures.
References
- (1) A. N. Zaikin and A. M. Zhabotinsky, Nature (London) 225, 535 (1970).
- (2) A. T. Winfree, The Geometry of Biological Time (Springer, New York, 1980).
- (3) M. B r, N. Gottschalk, H. Hildebrand, and M. Eiswirth, Physica (Amsterdam) 213A, 173 (1995).
- (4) S. W. Morris, E. Bodenschatz, D. S. Cannel, and G. Ahlers, Phys. Rev. Lett. 71, 2026 (1993).
- (5) H. R fer, V. Marello, and A. Onton, J. Appl. Phys. 51, 1163 (1980).
- (6) K. N. Tomchik and P. N. Devreotes, Science 212, 433 (1981).
- (7) J. M. Davidenko, A. M. Pertsov, R. Salomontz, W. Baxter, and J. Jalife, Nature (London) 355, 349 (1992); K. Agladze, J. P. Keener, S. C. M ller, and A. Panfilov, Science 264, 1746 (1994).
- (8) T. Ikehata, H. Tanaka, N. Y. Sato, and H. Mase, Phys. Rev. Lett. 81, 1853 (1998).
- (9) Yu. A. Astrov, I. M ller, E. Ammelt, and H.-G. Purwins, Phys. Rev. Lett. 80, 5341 (1998).
- (10) S. Mierk, U. Konopka, P. Bandyopadhyay, and G. Morfill, Phys. Rev. Lett., 106, 215004 (2011).