Comparing Published Scientific Journal Articles
to Their Pre-print Versions
Abstract
Academic publishers claim that they add value to scholarly communications by coordinating reviews and contributing and enhancing text during publication. These contributions come at a considerable cost: U.S. academic libraries paid billion for serial subscriptions in alone. Library budgets, in contrast, are flat and not able to keep pace with serial price inflation. We have investigated the publishers’ value proposition by conducting a comparative study of pre-print papers and their final published counterparts. This comparison had two working assumptions: 1) if the publishers’ argument is valid, the text of a pre-print paper should vary measurably from its corresponding final published version, and 2) by applying standard similarity measures, we should be able to detect and quantify such differences. Our analysis revealed that the text contents of the scientific papers generally changed very little from their pre-print to final published versions. These findings contribute empirical indicators to discussions of the added value of commercial publishers and therefore should influence libraries’ economic decisions regarding access to scholarly publications.
keywords:
Open Access, Pre-print, Publishing, Similarity1 Introduction
Academic publishers of all types claim that they add value to scholarly communications by coordinating reviews and contributing and enhancing text during publication. These contributions come at a considerable cost: U.S. academic libraries paid billion for serial subscriptions in alone and this number continues to rise. Library budgets, in contrast, are flat and not able to keep pace with serial price inflation. Several institutions have therefore discontinued or significantly scaled back their subscription agreements with commercial publishers such as Elsevier and Wiley-Blackwell. At the University of California, Los Angeles (UCLA), we have investigated the publishers’ value proposition by conducting a comparative study of pre-print papers and their final published counterparts. We have two working assumptions:
-
1.
If the publishers’ argument is valid, the text of a pre-print paper should vary measurably from its corresponding final published version.
-
2.
By applying standard similarity measures, we should be able to detect and quantify such differences.
In this paper we present our preliminary results based on pre-print publications from arXiv.org and their final published counterparts obtained through subscriptions held by the UCLA Library. After matching papers via their digital object identifiers (DOIs), we applied comparative analytics and evaluated the textual similarities of components of the papers such as the title, abstract, and body. Our analysis revealed that the text contents of the papers in our test data set generally changed very little from their pre-print to final published versions; these results suggest that the vast majority of final published papers are largely indistinguishable from their pre-print versions. This work contributes empirical indicators to discussions of the value that academic publishers add to scholarly communication and therefore can influence libraries’ economic decisions regarding access to scholarly publications.
2 Global Trends in Scientific and Scholarly Publishing
There are several global trends that are relevant and situate the focus of this research. The first is the steady rise in both cost and scope of the global science, technology and medicine (STM) publishing market. According to Michael Mabe and Mark Ware in their STM Report [13], the global STM market in was billion annually, with of this from journals ( billion) and coming directly out of library budgets. Other relevant trends are the growing global research corpus [3], the steady rise in research funding [12], and the corresponding recent increase in open access publishing [1]. One longstanding yet infrequently mentioned factor is the critical contribution of faculty and researchers to the creation and establishment of journal content that is then licensed back to libraries to serve students, faculty and researchers. For example, a Elsevier study (reported in [12]) conducted for the University of California (UC) system showed that UC research publications accounted for of all research publications in the United States between and and the UC libraries purchased all of that research back from Elsevier.
2.1 The Price of Knowledge
While there are many facets to the costs of knowledge, the pricing of published scholarly literature is one primary component. Prices set by publishers are meant to maximize profit and therefore are determined not by actual costs, but by what the market will bear. According to the National Association of State Budget Officers, states in the U.S. had budgets in with lower general fund expenditures in than just prior to the global recession in [8]. Nearly half of the states therefore had not returned to pre-recession levels of revenue and spending.
2.2 Rise in Open Access Publications
Over the last several years there has been a significant increase in open access publishing and publications in STM. Some of this increase can be traced to recent U.S. federal guidelines and other funder policies that require open access publication. Examples include such policies at the National Institutes of Health, the Wellcome Trust, and the Howard Hughes Medical Center. Bo-Christer Björk et al. [2] found that in , approximately of science papers were open access. By , another study by Hammid R. Jamali and Maijid Nabavi [5] found that of journal articles were freely available online via open access.
2.3 Pre-print versus Final Published Versions and the Role of Publishers
In this study, we compared paper pre-prints from arXiv.org to the corresponding final published versions of the papers. For comparison, the annual budget for arXiv.org is set at for . While it is not possible to determine the precise corresponding costs for commercial publishing, the National Center for Education Statistics found that the market for English language STM journals was approximately billion dollars annually. It therefore seems safe to say that the costs for commercial publishing are orders of magnitude larger than the costs for an organization such as arXiv.org.
Michael Mabe [7] describes the publishers’ various roles as including, but not limited to entrepreneurship, copyediting, tagging, marketing, distribution, and e-hosting. The focus of the study presented here is on the publishers’ contributions to the content of the materials they publish (specifically copyediting and other enhancements to the text) and how and to what extent, if at all, the content changes from the pre-print to the final published version of a publication.
3 Data Gathering
Comparing pre-prints to final published versions of a significant corpus of scholarly articles required obtaining the contents of both versions of each article in a format that could be analyzed as full text and parsed into component sections (title, abstract, body) for more detailed comparisons. The most accessible source of such materials proved to be arXiv.org, an open-access digital repository owned and operated by Cornell University and supported by a consortium of institutions. At the time of writing, arXiv.org hosts over million academic pre-prints, most written in fields of physics and mathematics and uploaded by their authors to the site within the past years. The scope of arXiv.org also enabled us to identify and obtain a sufficiently large comparison corpus of corresponding final published versions in scholarly journals to which our institution has access via subscription.
3.1 arXiv.org Corpus
Gathering pre-print texts from arXiv.org proceeded via established public interfaces for machine access to the site data, respecting their discouragement of indiscriminate automated downloads.111https://arxiv.org/help/robots
We first downloaded metadata records for all articles available from arXiv.org through February of via the site’s Open Archives Initiatives Protocol for Metadata Harvesting (OAI-PMH) interface.222http://export.arxiv.org/oai2?verb=Identify We received records in all, which provided standard Dublin Core metadata for each article, including its title and authors, as well as other useful data for subsequent analysis, such as the paper’s disciplinary category within arXiv.org and the upload dates of its versions (if the authors submitted more than one version). The metadata also contained the text of the abstract for most articles. Because the abstracts as well as the article titles often contained text formatting markup, however, we preferred to use instances of these texts that we derived from other sources, such as the PDF version of the paper, for comparison purposes (see below).
arXiv.org’s OAI-PMH metadata record for each article contains a field for a DOI, which we used as the key to match pre-print versions of articles to their final published versions. arXiv.org does not require DOIs for submitted papers, but authors may provide them voluntarily. article records in our initial metadata set () contained a DOI. Working under the assumption that the DOIs are correct and sufficient to identify the final published version of each article, we then queried the publisher-supported CrossRef citation linking service service333https://github.com/CrossRef/rest-api-doc/blob/master/rest_api.md to determine whether the full text of the corresponding published article would be available for download via UCLA’s institutional journal subscriptions.
To begin accumulating full articles for text comparison, we downloaded PDFs of every pre-print article from arXiv.org with a DOI that could be matched to a full-text published version accessible through subscriptions held by the UCLA Library. Our initial query indicated that up to final published versions would be accessible in this manner. The main reason why this number is fairly low is that, at the time of writing, the above mentioned CrossRef API is still in its early stages and only few publishers have agreed to making their articles available for text and data mining via the API. However, while this represented a very small proportion of all papers with DOI-associated pre-prints stored in arXiv.org, the resulting collection nevertheless proved sufficient for a detailed comparative analysis.
The downloads of pre-prints took place via arXiv.org’s bulk data access service, which facilitates the transfer of large numbers of articles as PDFs or as text markup source files and images, packaged into .tar archives, from an Amazon S3 account. Bandwidth fees are paid by the requesting party.444https://arxiv.org/help/bulk_data_s3 This approach only yields the most recent uploaded version of each pre-print article, however, so for analyses involving earlier uploaded versions of pre-print articles, we relied upon targeted downloads of earlier article versions via arXiv.org’s public web interface.
3.2 Corpus of Matched Articles
Obtaining the final published versions of articles involved querying the CrossRef API to find a full-text download URL for a given DOI. Most of the downloaded files (%) arrived in one of a few standard XML markup formats; the rest were in PDF format. Due to missing or incomplete target files, of the downloads failed entirely, leaving us with published versions for comparison. The markup of the XML files contained, in addition to the full text, metadata entries from the publisher. Examination of this data revealed that the vast majority () of articles were published between and . This time range intuitively makes sense as DOIs did not find widespread adoption with commercial publishers until the early . The data also shows that most of the obtained published versions (%) were published by Elsevier.
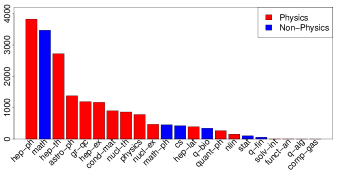
The disciplines of articles in arXiv.org are dominated by physics, mathematics, statistics, and computer science. It is therefore not surprising to find a very similar distribution of categories in our corpus of matched articles as shown in Figure 1.
3.3 Data Preparation
For this study, we compared the texts of the titles, abstracts, and body sections of the pre-print and final published version of each paper in our data set. Being able to generate these sections for most downloaded papers therefore was a precondition of this analysis.
All of the pre-print versions and a small minority of final published papers were downloaded in PDF format. To identify and extract the sections of these papers, we used the GROBID555https://github.com/kermitt2/grobid library, which employs trained conditional random field machine learning algorithms to segment structured scholarly texts, including article PDFs, into XML-encoded text.
The markup tags of the final published papers downloaded in XML format usually identified quite plainly their primary sections. A small proportion of such papers, however, did not contain a demarcated body section in the XML and instead only provided the full text of the papers. Although it is possible to segment these texts further via automatic scholarly information extraction tools such as ParsCit,666http://aye.comp.nus.edu.sg/parsCit/ which use trained conditional random field models to detect sections probabilistically, for the present study we elected simply to omit the body sections of this small number of papers from the comparison analysis.
As noted above, the GROBID software used to segment the PDF papers was probabilistic in its approach, and although it was generally quite effective, it was not able to isolate all sections (title, abstract, body) for approximately % of the papers in our data set. This situation, combined with the aforementioned irregularities in the XML of a similar proportion of final published papers, meant that the number of corresponding texts for comparison varied considerably by section. Thus, for our primary comparison of the latest pre-print version uploaded to arXiv.org to its final published version, we were able to compare directly titles and abstract sections, and body sections.
The large variations in formatting of the references sections (also called the “tail”) as extracted from the raw downloaded XML and the parsed PDFs, however, precluded a systematic comparison of that section. We leave such an analysis for future work. A further consequence of our text-only analysis was that the contents of images were ignored entirely, although figure captions and the text contents of tables usually could be compared effectively.
4 Analytical Methods
We applied several text comparison algorithms to the corresponding sections of the pre-print and final published versions of papers in our test data set. These algorithms, described in detail below, were selected to quantify different notions of “similarity” between texts. When possible, we normalized the output values of each algorithm to lie between and , with indicating that the texts were effectively identical, and indicating complete dissimilarity. Different algorithms necessarily measured any apparent degree of dissimilarity in different ways, so the outputs of the algorithms cannot be compared directly, but it is nonetheless valid to interpret the aggregation of these results as a general indication of the overall degree of similarity between two texts along several different axes of comparison.
4.1 Editorial Changes
The well-known Levenshtein edit distance metric [6] calculates the number of character insertions, deletions, and substitutions necessary to convert one text into another. It thus provides a useful quantification of the amount of editorial intervention — performed either by the authors or the journal editors — that occurs between the pre-print and final published version of a paper. Our work used the edit ratio calculation as provided in the Levenshtein Python C Implementation Module,777https://pypi.python.org/pypi/python-Levenshtein/0.11.2 which subtracts the edit distance between the two documents from their combined length in characters and divides this amount by their aggregate length, thereby producing a value between (completely similar) and (completely dissimilar).
4.2 Length Similarity
The degree to which the final published version of a paper is shorter or longer than the pre-print constitutes a much less involved but nonetheless revealing comparison metric. To calculate this value, we divided the absolute difference in length between both papers by the length of the longer paper and subtracted this value from . Therefore, two papers of the same length will receive a similarity score of ; this similarity score is if one paper is twice as long as the other, and so on. It is also possible to incorporate the polarity of this change by adding the length ratio to if the final version is longer, and subtracting it from if the pre-print is longer.
4.3 String Similarity
Two other fairly straightforward, low-level metrics of string similarity that we applied to the paper comparisons were the Jaccard and Sørensen indices, which consider only the sets of unique characters that appear in each text. The Sørensen similarity [11] was calculated by doubling the number of unique characters shared between both texts (the intersection) and dividing this by the combined sizes of both texts’ unique character sets.
The Jaccard similarity calculation [4] is the size of the intersection (see above) divided by the total number of unique characters appearing in either the pre-print or final published version (the union).
Implementations of both algorithms were provided by the standard Python string distance package.888https://pypi.python.org/pypi/Distance/
4.4 Semantic Similarity
Comparing overall lengths, shared character sets, and even edit distances between texts does not necessarily indicate the degree to which the meaning of the texts — that is, their semantic content — actually has changed from one version to another. To estimate this admittedly more subjective notion of similarity, we calculated the pairwise cosine similarity between the pre-print and final published texts. Cosine similarity can be described intuitively as a measurement of how often significant words occur in similar quantities in both texts, normalized by the lengths of both documents [9]. The actual procedure used for this study involved removing common English “stopwords” from each document, then applying the Porter stemming algorithm [10] to remove suffixes and thereby merge closely related words, before finally applying the pairwise cosine similarity algorithm implemented in the Python scikit-learn machine learning package999http://scikit-learn.org/stable/ to the resulting term frequency lists. Because this implementation calculates only the similarity between two documents considered in isolation, instead of within the context of a larger corpus, it uses raw term counts, rather than term-frequency/inverse document frequency (TF-IDF) weights.
5 Experiment Results
We calculated the similarity metrics described above for each pair of corresponding pre-print and final published papers in our data set, comparing titles, abstracts, and body sections when available. From the results of these calculations, we generated visualizations of the similarity distributions for each metric. Subsequent examinations and analyses of these distributions provided novel insights into the question of how and to what degree the text contents of scientific papers may change from their pre-print instantiations to the final published version. Because each section of a publication differs in its purpose and characteristics (e.g., length, standard formatting) and each metric addresses the notion of similarity from a different perspective, we present the results of our comparisons per section (title, abstract, and body), subdivided by comparison metric.
5.1 Title Analysis
First, we analyzed the papers’ titles. A title is usually much shorter (fewer characters) than a paper’s abstract and its body. That means that even small changes to the title would have a large impact on the similarity scores based on length ratio and Levenshtein distance. Titles also often contain salient keywords describing the overall topic of the paper. If those keywords were changed, removed or new ones added, the cosine similarity value would drop.
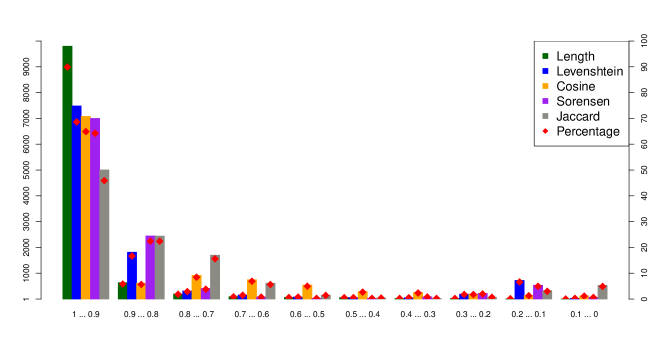
Figure 2 shows the comparison of results of all five text similarity measures applied to titles. Since all measures are normalized, they return values between and . Values closer to represent a high degree of dissimilarity and values close to indicate a very high level of similarity of the analyzed text. The horizontal x-axis in Figure 2 shows results aggregated into ten bins. The bin with the largest values between and is located on the far left of the axis followed by the bin with values between and and so on. The bin with values between and can be found on the right end of the x-axis. Each bin contains five columns, each of which represents one applied similarity measure. A column’s height indicates the number of articles whose title similarity scores fall into the corresponding bin. The height of a column refers to the left y-axis and is shown in absolute numbers. The red diamond-shaped point in each column indicates the relative proportion of articles in the entire corpus that is represented by the corresponding column. The value of a diamond refers to the right y-axis where the percentage is shown.
Figure 2 shows a dominance of the top bin. The vast majority of titles have a very high score in all applied similarity measures. Most noticeably, almost titles (around of all titles) are of very similar length, with a ratio value between and . The remaining fall into the next bin with values between and . A very similar observation can be made for the Levenshtein distance and the Sørensen value. About of those values fall into the top bin and the majority of the remaining values (around ) land between and . The cosine similarity is also dominated by values in the top bin (around ) but the remaining values are more distributed across the second, third, fourth, and fifth bin. Just about half of all Jaccard values can be seen in the top bin and most of the remainder is split between the second () and the third bin (). In many cases, this metric is registering low-level but systematic differences in character use between the pre-print and final published versions as filtered through the download methods described above: for example, a pre-print may consistently use em-dashes (–), whereas the published version uses only hyphens (-). This sensitivity of the Jaccard similarity score to subtle changes in the unique character sets in each text is apparent for other sections as well.
The results of this comparison, in particular the fact that the majority of values fall between and , provide very strong indicators that titles of scholarly articles do not change noticeably between the pre-print and the final published version. Even though Figure 2 shows a small percentage of titles exhibiting a rather low level of similarity, with Levenshtein and Sørensen values between and , the overall similarity of titles is very high.
5.2 Abstract Analysis
The next section we compared was the papers’ abstracts. An abstract can be seen as a very short version of the paper. It often gives a brief summary of the problem statement, the methods applied, and the achievements of the paper. As such, an abstract usually is longer than the paper’s title (in number of characters) and provides more context. Intuitively, it seems probable that we would find more editorial changes in longer sections of the pre-print version of an article compared to its final published version. However, a potentially increased number of editorial changes alone does not necessarily prove dissimilarity between longer texts. We expect similarity measures based on semantic features such as cosine similarity to be more reliable here.
Figure 3 shows the comparative results for all abstracts. The formatting of the graph is the same as previously described for Figure 2. To our surprise, the figure is dominated by the high frequency of values between and across all similarity measures. More than abstracts (about ) have such scores for their length ratio, Levenshtein distance, and Sørensen index. of the remaining length ratio and Levenshtein distance values as well as of the remaining Sørensen index values fall between and . The remaining pairs are distributed across all other bins. The cosine similarity and Jaccard index values are slightly more distributed. About abstracts () fall into the top bin, and into the second, and and into the third bin, respectively.
Not unlike our observations for titles, the algorithms applied to abstracts predominantly return values that indicate a very high degree of similarity. Figure 3 shows that more than of abstracts score or higher, regardless of the text similarity measure applied. It is also worth pointing out that there is no noticeable increased frequency of values between and as previously seen when comparing titles (Figure 2).
5.3 Body Analysis
The next section we extracted from our corpora of scholarly articles and subjected to the text similarity measures is the body of the text. This excludes the title, the author(s), the abstract, and the reference section. This section is, in terms of number of characters, the longest of our three analyzed sections. We therefore consider scores resulting from algorithms based on editorial changes to be less informative for this comparison. In particular, a finding such as “The body of article contains fewer characters than the body of article ” would not provide any reliable indicators of the similarity between the two articles and . Algorithms based on semantic features, such as the cosine similarity, on the other hand, provide stronger indicators of the similarity of the compared long texts. More specifically, cosine values are expected to be rather low for very dissimilar bodies of articles.
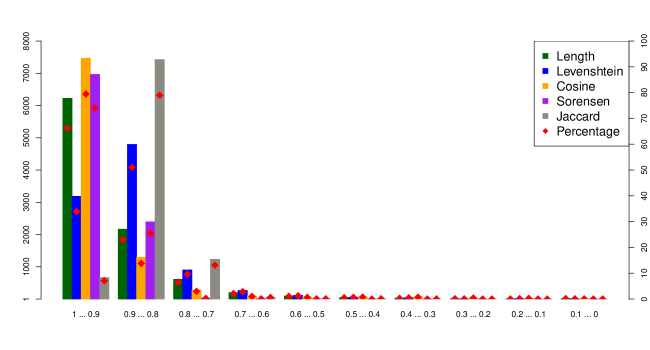
The results of this third comparison can be seen in Figure 4. The height of the bar representing the cosine similarity is remarkable. Almost body sections of our compared scholarly articles, which is equivalent to of the entire corpus, have a cosine score that falls in the top bin with values between and . have a cosine value that falls into the second and fall into the third bin. Values of the Sørensen index show a very similar pattern with in the top bin and in the second. In contrast, only of articles’ bodies have Jaccard index values falling into the top bin. The vast majority of these scores, , are between and and another are between and . It is surprising to see that even the algorithms based on editorial changes provide scores mostly in the top bins. Of the length ratio scores, fall in the top bin and in the second bin. The Levenshtein distance shows the opposite proportions: are in the top and belong to the second bin.
The dominance of bars on the left hand side of Figure 4 provides yet more evidence that pre-print articles of our corpus and their final published version do not exhibit many features that could distinguish them from each other, neither on the editorial nor on the semantic level. of all analyzed body sections have a similarity score of or higher in any of the applied similarity measures.
5.4 Publication Dates
The above results provide strong indicators that there is hardly any noticeable difference between the pre-print version of a paper and its final published version. However, the results do not show which version came first. In other words, consider the two possible scenarios:
-
1.
Papers, after having gone through a rigorous peer review process, are published by a commercial publisher first and then, as a later step, uploaded to arXiv.org. In this case the results of our text comparisons described above would not be surprising, as the pre-print versions would merely be a mirror of the final published ones. There would be no apparent reason to deny publishers all credit for peer review, copyediting, and the resulting publication quality of the articles.
-
2.
Papers are uploaded to arXiv.org first and later published by a commercial publisher. If this scenario is dominant, our comparison results would suggest that any changes in the text due to publisher-initiated copyediting are hardly noticeable.
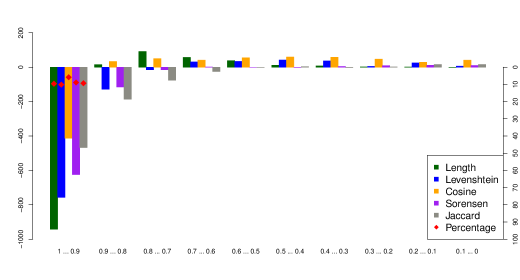
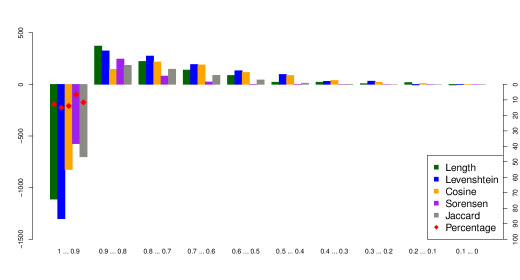
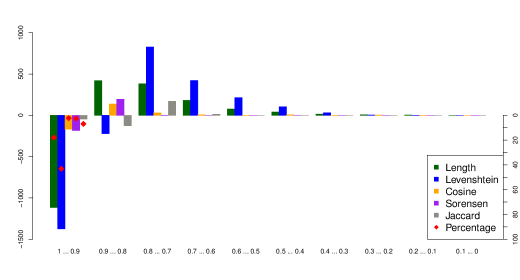
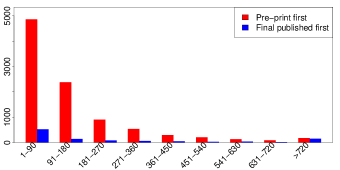
Figure 6 shows the order of appearance in arXiv.org versus commercial venues for all articles in our corpus, comparing the publication date of each article’s final published version to the date of its latest upload to arXiv.org. Red bars indicate the amount of articles (absolute values on the y-axis) that were first upload to arXiv.org, and blue bars stand for articles published by a commercial publisher before they appeared in arXiv.org. Each pair of bars is binned into a time range, shown on the x-axis, that indicates approximately how many days passed between the article’s appearance in the indicated first venue and its appearance in the second venue. Figure 6 show clear evidence that the vast majority of our articles () were published in arXiv.org first. Therefore our argument for the second scenario holds. We can only speculate about the causes of certain time windows’ prominence within the distribution, but it may be related to turn-around times of publishers between submission and eventual publication.
| Measure | Bin | Bin | Bin | Bin | Bin | Bin | Bin | Bin | Bin | Bin |
|---|---|---|---|---|---|---|---|---|---|---|
| len | -9.61 | 2.37 | 45.73 | 61.29 | 61.29 | 20.00 | 32.00 | 9.52 | 10.00 | -50.00 |
| lev | -10.12 | -7.04 | -4.81 | 19.50 | 43.04 | 72.41 | 68.52 | 2.60 | 3.48 | 23.08 |
| cos | -5.84 | 5.36 | 5.43 | 5.47 | 10.15 | 20.27 | 22.75 | 24.87 | 21.01 | 33.33 |
| sor | -8.91 | -4.70 | -3.64 | 1.25 | 0.00 | -3.45 | 4.71 | 4.17 | 2.04 | 14.93 |
| jac | -9.34 | -7.62 | -4.47 | -4.08 | -0.66 | 7.50 | -8.00 | 2.82 | 4.88 | 3.02 |
| Measure | Bin | Bin | Bin | Bin | Bin | Bin | Bin | Bin | Bin | Bin |
|---|---|---|---|---|---|---|---|---|---|---|
| len | -12.87 | 58.95 | 79.36 | 83.23 | 51.46 | 12.09 | 12.36 | 3.08 | 7.25 | -5.13 |
| lev | -15.08 | 49.39 | 100.73 | 81.43 | 74.30 | 38.34 | 10.49 | 14.68 | -6.25 | -3.64 |
| cos | -13.86 | 6.85 | 19.91 | 31.66 | 30.69 | 31.54 | 18.84 | 15.67 | 13.04 | -2.17 |
| sor | -6.63 | 17.89 | 15.55 | 10.53 | -1.56 | -5.26 | 0 | 0 | 0 | 0 |
| jac | -11.60 | 6.55 | 15.45 | 17.84 | 13.62 | 8.22 | -5.13 | 0 | 0 | 0 |
| Measure | Bin | Bin | Bin | Bin | Bin | Bin | Bin | Bin | Bin | Bin |
|---|---|---|---|---|---|---|---|---|---|---|
| len | -17.93 | 19.43 | 62.58 | 90.05 | 79.38 | 85.11 | 60.00 | 88.89 | 133.33 | 0 |
| lev | -43.14 | -4.61 | 91.59 | 158.65 | 183.76 | 177.97 | 74.42 | 83.33 | 14.29 | 0 |
| cos | -2.25 | 10.62 | 10.79 | 7.37 | -1.64 | 10.00 | -3.03 | 11.11 | -4.76 | 0 |
| sor | -2.63 | 8.14 | 3.85 | 0 | 0 | 0 | 0 | 0 | 0 | 0 |
| jac | -6.90 | -1.70 | 13.87 | 25.00 | 0 | 0 | 0 | 0 | 0 | 0 |
6 Versions of Articles from the arXiv.org Corpus
About of all million papers in arXiv.org have more than one version. A new version is created when, for example, an author makes a change to the article and re-submits it to arXiv.org. The evidence of Figure 6 shows that the majority of the latest versions in arXiv.org were still uploaded prior to the publication of its final published version in a commercial venue. However, we were motivated to eliminate all doubt and hence decided to repeat our comparisons of the text contents of paper titles, abstracts, and body sections using the earliest versions of the articles from arXiv.org only. The underlying assumption is that those versions were uploaded to arXiv.org even earlier (if the authors uploaded more than one version) and hence are even less likely to exhibit changes due to copyediting by a commercial publisher. It follows, then, that if the comparisons of these earlier pre-print texts to their published versions show substantially greater divergences, then it is possible that more of these changes are the result of publisher-initiated copyediting.
Our corpus of pre-print and final published papers matched by their DOIs and available via UCLA’s journal subscriptions exhibits a higher ratio of papers with more than one version in arXiv.org than is found in the full set of articles available from arXiv.org. of the papers we compared had more than one version, had exactly two, and had exactly three versions; whereas only of all articles uploaded to arXiv.org have more than one version. We applied our five similarity measures (see Section 4) to quantify the similarity between the first version of all articles and their final published versions. Rather than repeating the histograms of Figures 2, 3, and 4, we show the divergences from these histograms only. Figure 5 displays a positive/negative barplot that represents the differences between our first comparison and this one.
Figure 5(a) depicts the deltas of the title comparisons. The top bin contains only negative bars, meaning that our second comparison, using the earliest uploaded versions only, returned fewer similarity scores in that bin. The number of title comparisons in the top bin for the length ratio, for example, dropped by almost and the number in the top bin for the Levenshtein ratio dropped by . While these numbers may at first seem dramatic, the bigger picture shows that the decrease is not that significant. We merely see a drop in the top bin for length ratio and Levenshtein, a drop for the Sørensen and Jaccard index, and a drop of less than for the cosine similarity. The second bin shows positive bars for the length ratio and cosine similarity, which means that our comparison using the first uploaded version to arXiv.org returned more values for those measures in this bin relative to our comparison using the latest uploaded version. The absolute counts for the following bins decrease relative to our initial comparison, and it is difficult to interpret the corresponding shifts in their proportional values when they are plotted visually (as red diamonds). We instead detail these relative changes between our two sets of comparisons in Table 1.
The numbers for the abstract comparison are fairly similar. Figure 5(b) shows a drop for all measures in the top bin and corresponding gains in the following bins. However, the relative numbers again are not dramatic. Table 2 lists all relative differences.
The results for the body comparison are interesting. As shown in Figure 5(c), we observe a drop in length ratio and even a drop in Levenshtein scores for the top bin. However, cosine scores drop by only in the top bin. Given that in our first body comparison (see Section 5.3) of cosine scores belonged in the top bin, the drop in this second body comparison is almost negligible. The detailed list of relative differences can be found in Table 3.
These results confirm our initial assessment that very little difference can be found between pre-print articles and their final published versions. Even more so, these findings strengthen our argument as they show that the difference between the earliest possible pre-print version and the final published one seems insignificant, given the similarity measures we applied to our corpus.
6.1 Publication Dates of Versions
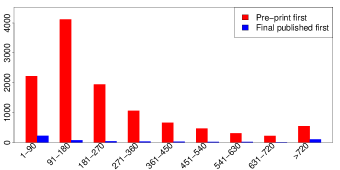
The scenarios discussed in Section 5.4 with respect to the question of whether an article was uploaded to arXiv.org before it appeared in a commercial venue are valid for this comparison as well. Figure 7 mirrors the concept of Figure 6 and shows the number of earliest pre-print versions uploaded to arXiv.org first in red and the final published versions appearing first represented by the blue bars. As expected, the amount of pre-print versions published first increased and now stands at as shown in Figure 7 (compared to shown in Figure 6). Our argument for the second scenario described above is therefore strongly supported when considering the earliest uploaded versions of pre-prints.
7 Discussion and Future Work
The results outlined in this paper are from a preliminary study on the similarity of pre-print articles to their final published counterparts. There are many areas where this study could be improved and enhanced. One limitation to this work is the focus on arXiv.org as the sole corpus of pre-print articles. As a result, all of the articles are from a relatively limited slice of the STM domain — specifically, physics, mathematics, statistics, and computer science, as shown in Figure 1. Expanding this line of experiments to other domains such as the biological sciences, humanities, social sciences, and economics might return different results, as the review and editorial practices in other disciplines can vary considerably. As part of our future work, we are planning to conduct this experiment again with articles from the RePEc.org corpus (economics) and from bioRxiv.org (biology), for example.
The matching of a pre-print version of an article to its final published version was done by means of the article’s DOI. While this is an obvious choice for a paper identifier, by only relying on DOIs we very likely missed out on other matching articles. For future experiments, we will include the paper’s title and author(s) in the matching process. Note also that we could only match articles that we have access to via the UCLA Library’s serial subscriptions. It might be worth expanding the matching process to a collaborating organization with ideally complementary subscriptions to maximize access to full text articles.
One typical article section we have not analyzed as part of this research is the references section. Given publishers’ claims of adding value to this section of a scholarly article, we are motivated to see whether we can detect any significant changes between pre-prints and final published versions there. Similarly, we have not thoroughly investigated changes in the author sections. We anticipate author movement, such as authors being added, being removed, and having their rank in the list of authors changed — although changes in author order due to publishers’ name alphabetization policies must be considered as well. Initial experiments in this domain have proven difficult to interpret, as author names are provided in varying formats and normalization is not trivial.
Another angle of future work is to investigate the correlation between pre-prints and final published versions’ degree of similarity and measured usage statistics such as download numbers and the articles’ impact factor values. When arguing that the differences between pre-print articles and their final published versions are insignificant, factoring in usage statistics and “authority values” can further inform decisions about spending on serial subscriptions.
8 Conclusions
This study is motivated by academic publishers’ claims of the value they add to scholarly articles by copyediting and making further enhancements to the text. We present results from our preliminary study to investigate the textual similarity of scholarly pre-prints and their final published counterparts. We apply five different similarity measures to individual extracted sections from the articles’ full text contents and analyze their results. We have shown that, within the boundaries of our corpus, there are no significant differences in aggregate between pre-prints and their corresponding final published versions. In addition, the vast majority of pre-prints ( - ) are published by the open access pre-print service first and later by a commercial publisher. Given the fact of flat or even shrinking library, college, and university budgets, our findings provide empirical indicators that should inform discussions about commercial publishers’ value proposition in scholarly communication and have the potential to influence higher education and academic and research libraries’ economic decisions regarding access to scholarly publications.
References
- [1] B.-C. Björk. Have the “mega-journals” reached the limits to growth? PeerJ, 3:e981, 2015.
- [2] B.-C. Björk, P. Welling, M. Laakso, P. Majlender, T. Hedlund, and G. Guðnason. Open access to the scientific journal literature: Situation 2009. PLoS ONE, 5(6):e11273, 2009.
- [3] L. Bornmann and R. Mutz. Growth rates of modern science: A bibliometric analysis based on the number of publications and cited references. Journal of the Association for Information Science and Technology, 2015.
- [4] P. Jaccard. Etude comparative de la distribution florale dans une portion des Alpes et du Jura. Impr. Corbaz, 1901.
- [5] H. R. Jamali and M. Nabavi. Open access and sources of full-text articles in Google Scholar in different subject fields. Scientometrics, 105(3):1635–1651, 2015.
- [6] V. I. Levenshtein. Binary Codes Capable of Correcting Deletions, Insertions and Reversals. Soviet Physics Doklady, 10(8):707–710, 1966.
- [7] M. Mabe. (Electronic) Journal Publishing. The E-Resource Management Handbook, 2006.
- [8] Office of Management and Budget (U.S.). Fiscal Year 2014 Analytical Perspectives: Budget of the U.S. Government. Office of Management and Budget, 2013.
- [9] T. Pang-Ning, M. Steinbach, and V. Kumar. Introduction to Data Mining. Pearson Addison Wesley, 2006.
- [10] M. F. Porter. An Algorithm for Suffix Stripping. Electronic Library and Information Systems, 14(3):130–137, 1980.
- [11] T. Sørensen. A Method of Establishing Groups of Equal Amplitude in Plant Sociology Based on Similarity of Species and its Application to Analyses of the Vegetation on Danish Commons. Biol. Skr., 5:1–34, 1948.
- [12] University of California. Accountability Report 2015. http://accountability.universityofcalifornia.edu/2015/chapters/chapter-9.html.
- [13] M. Ware and M. Wabe. The STM Report - An Overview of Scientific and Scholarly Journal Publishing. International Association of Scientific, Technical and Medical Publishers, 2015.