Fragile-to-strong transition in liquid silica
Abstract
We investigate anomalies in liquid silica with molecular dynamics simulations and present evidence for a fragile-to-strong transition at around 3100 K-3300 K. To this purpose, we studied the structure and dynamical properties of silica over a wide temperature range, finding four indicators of a fragile-to-strong transition. First, there is a density minimum at around 3000 K and a density maximum at 4700 K. The turning point is at 3400 K. Second, the local structure characterized by the tetrahedral order parameter changes dramatically around 3000 K from a higher-ordered, lower-density phase to a less ordered, higher-density phase. Third, the correlation time changes from an Arrhenius behavior below 3300 K to a Vogel-Fulcher-Tammann behavior at higher temperatures. Fourth, the Stokes-Einstein relation holds for temperatures below 3000 K, but is replaced by a fractional relation above this temperature. Furthermore, our data indicate that dynamics become again simple above 5000 K, with Arrhenius behavior and a classical Stokes-Einstein relation.
I Introduction
Network-forming liquids, such as H2O, SiO2, Si, Ge, Sb, Bi, and Ga,Tanaka (2002) show complex structural and dynamical features. Their specific properties are due to the fact that they form nearest-neighbor bonds that are strongly directional, with specific values for the bond lengths and bond angles. The number of such bonds is smaller than the usual number of neighbors in a liquid; it has for instance the value of four in tetrahedral networks, as formed by water and silica.Angell et al. (2000) Therefore, the density of the liquid decreases as the bond network is formed, and the structure becomes locally more ordered. Since the formation of the network implies a decrease in entropy and in potential energy, the formation of the low-density networks is favored for lower temperatures and pressures, leading to various anomalies. The most famous of these anomalies, the density maximum of water, has been known for a long time.Fahrenheit (1724)
Water shows additional anomalies, for instance, in the isothermal compressibilitySpeedy and Angell (1976) and the heat capacity.Angell (1983) They are often particularly pronounced for the supercooled liquid.Mishima and Stanley (1998); Angell et al. (2000); Prielmeier et al. (1987) The unusual structural and thermodynamical properties of water are accompanied by anomalous dynamical behavior, such as a diffusion anomaly.Angell et al. (2000); Prielmeier et al. (1987) Moreover, it was proposed that water exhibits a fragile-to-strong (FS) transition in the supercooled regime,Ito, Moynihan, and Angell (1999) which means that the temperature dependence of the structural () relaxation changes from Vogel-Fulcher-Tammann (VFT) to Arrhenius behavior upon cooling, but an experimental observation of this phenomenon is hampered by a high tendency for crystallization. All these features of water can be explained by using simple models that allow for three nearest-neighbor states with different energy and entropy.Heckmann and Drossel (2012, 2013)
Silica resembles water in several respects. SiO2 and H2O have the same stoichiometry with two A atoms and one B atom. Furthermore, the A-B-A bond angle (O-Si-O or H-O-H) is about the tetrahedral angle which, together with 2:1 stoichiometry, allows for a formation of tetrahedral networks. Finally, like water, silica is polar because of substantial partial charges of the silicon and oxygen atoms. Therefore, one may expect that silica shares many properties with water.Debenedetti (1996) Consistently, a density maximum was also seen in computationalPoole, Hemmati, and Angell (1997); Shell, Debenedetti, and Panagiotopoulos (2002) and experimentalBrückner (1970); Angell and Kanno (1976) studies on silica. It occurs around 1800 K at 1 atm.Angell and Kanno (1976) In simulations, also other anomalies were reported, Saika-Voivod et al. (2004) for example in the specific heat.Poole, Hemmati, and Angell (1997); Sharma, Mudi, and Chakravarty (2006) Yet, as compared to water, silica has a lower tendency for crystallization and, hence, it is a better glass-former.
Silica is usually considered as the paradigm of a strong glass former.Richet (1984); Angell (1991) Over a wide range, the temperature dependence of self-diffusion coefficients and structural relaxation times is described by an Arrhenius law with activation energies of ca. 5 eV. However, experimentalRössler, Hess, and Novikov (1998); Hess, Dingwell, and Rössler (1996); Sonneville et al. (2013) and computationalHorbach and Kob (1999, 2001); Saika-Voivod, Poole, and Sciortino (2001); Saika-Voivod, Sciortino, and Poole (2004); Vogel and Glotzer (2004a, b); Saksaengwijit, Reinisch, and Heuer (2004) studies found that the strong behavior changes to a fragile one when silica is heated to temperatures above 3000 K. Similar to the situation for water, it is currently highly debated whether this FS transition is a consequence of a true phase transition or a smooth crossover. Evidence for a transition from a high-density liquid (HDL) to a low-density liquid (LDL) in silica Saika-Voivod, Sciortino, and Poole (2000); Lascaris et al. (2015); Sastry and Austen Angell (2003) supports the idea that the system may exhibit a liquid-liquid phase transition in the viscous regime. In fact, the above-mentioned simple three-state models Heckmann and Drossel (2013) lead generically to a thermodynamic phase transition between the HDL and LDL silica forms. However, with different parameter choices the phase transition is replaced by a crossover, and therefore the question is yet unsettled. For silica, crystallization does not interfere with studies of the liquid state in the relevant temperature range. Thus, experimental studies should, unlike for water, be able to determine whether a liquid-liquid phase transition occurs for silica. The relatively high temperatures of ca. 3000 K are a serious drawback to the application of many experimental techniques, though. Conversely, a FS crossover occurring at high temperatures and fast dynamics, i.e., for structural relaxation times of the order of 1 ns, provides ideal conditions for molecular dynamics (MD) simulations approaches.Horbach and Kob (1999, 2001); Saika-Voivod, Poole, and Sciortino (2001); Saika-Voivod, Sciortino, and Poole (2004); Vogel and Glotzer (2004a, b); Saksaengwijit, Reinisch, and Heuer (2004)
In this paper we extend the existing theoretical studies on silica by performing MD simulations for system sizes and temperature ranges that are considerably larger than before, and by combining the investigation of structural and dynamical properties. Our main finding is a clear change from Arrhenius to VFT behavior for the structural relaxation times as temperature is increased. This change occurs approximately at the same temperature as the density turning point and a change from a low-density silica with high local tetrahedral order to a high-density silica with less local order. For very high temperatures, the structural relaxation reverts again to an Arrhenius law. The change from Arrhenius behavior to VFT and back to Arrhenius is accompanied by a transition from a classical Stokes-Einstein relation to a fractional one and back to a classical one as the temperature increases.
II Simulation Details
We used the NAMD simulation software package. The MD simulations of SiO2 in the bulk state were performed with atoms (5832 silicon and 11664 oxygen atoms) in a cubic volume centered about the origin, with periodic boundary conditions. All simulations were performed in the ensemble. To keep the temperature and the pressure constant, the Langevin thermostat and the Langevin-Piston-Nosé-Hoover barostat were used. The time step of the integration was set to 1 fs. For temperatures above 5000 K the time step had to be adjusted to 0.5 fs, because otherwise atoms come too close to each other within one integration step. Simulations were performed for up to 135 ns, depending on temperature. The pressure was set to 1 bar. The masses of oxygen and silicon atoms were set to 15.9994 u and 28.0850 u respectively. Prior to data acquisition the system was equilibrated. At all temperatures, we ensured that the equilibration times exceed the structural relaxation times.
We used a modified version of the interaction potential proposed by van Best, Kramer, and van Santen (BKS).van Beest, Kramer, and van Santen (1990) The BKS potential proved well suited to reproduce physical properties of silica.Horbach and Kob (1999, 2001); Saika-Voivod, Sciortino, and Poole (2000) It describes the particle interactions by the combination of a Coulomb term and a Buckingham term . The latter is given by
| (1) |
The use of a modified BKS potential was necessary because the Coulomb and the Buckingham interactions between oxygen and silicon are attractive for small distances. Therefore, we had to ensure that the atoms do not get unphysically close to each other, in particular, at high temperatures where their kinetic energies suffice to cross the energy barrier separating this fully attractive region from the usual minimum region of the Buckingham potential. The modified potential therefore consists of the regular Buckingham potential at larger distances with a continuously differentiable transition to the repulsive part of a Lennard-Jones potential at smaller distances,
| (2) |
Specifically, we switch between both potentials at a distance for silicon-oxygen and at for oxygen-oxygen interaction, corresponding to the maximum of the Buckingham potential. The parameters used in our simulations are listed in Table 1 and Table 2.
We checked how many atoms penetrated into the region . At 10000 K, we found that 0.50 % of the atoms reside in the region where the Buckingham potential was modified. This percentage is relatively small, nonetheless it can change the behavior of the system. However, the percentage decreases fast with lower temperatures, e.g, at 7000 K, this percentage amounts to only 0.07%, suggesting that the modification of the potential does not play a role at K.
We simulated the following temperatures: between 2300 K and 3500 K in 100 K steps and additionally 3800 K, 4100 K, 4400 K, 4700 K, 5000 K, 5500 K, 6000 K, 6500 K, 7000 K, 8000 K, 9000 K, and 10000 K.
III Studied measures of structure and dynamics
III.1 Tetrahedral order
The extent to which the atoms order locally can be quantified by the tetrahedral order parameter. The tetrahedral order of the silicon atom is defined as Chau and Hardwick (1998); Errington and Debenedetti (2001)
| (3) |
where denotes the angle between the silicon atom and two of its four nearest silicon atoms and . Possible values of lie between -3 and 1, where the latter value is found for a perfect local tetrahedral structure. The tetrahedral order parameter of the whole system is defined as the average over all silicon atoms. If denotes the distribution of the in the system, is obtained from the integral
| (4) |
A value of means that all atoms are arranged in a perfect tetrahedral structure, while for an ideal gas. Closely related to the tetrahedral order parameter is the tetrahedral entropy. It is defined asKumar, Buldyrev, and Stanley (2009)
| (5) |
Here, is a constant and is the Boltzmann constant.
III.2 Molecular dynamics
In order to analyze the structural relaxation of the studied silica melt, we calculate the incoherent intermediate scattering function (ISF). For isotropic systems it can be obtained according to
| (6) |
from the particle displacement vectors during a time interval . Here, the angular brackets denote the averages over all atoms of a given species and various time origins . probes particle displacements on a length scale determined by the absolute value of the scattering vector . We use Å-1 corresponding to the nearest neighbor distance between silicon atoms, which is roughly Å. We define the structural relaxation time as the time after which the ISF has decayed from 1 to .
For strong glass formers, the structural relaxation time follows an Arrhenius law
| (7) |
Here, is the activation energy and is related to the attempt frequency. In the case of a fragile liquid, the temperature dependence of is often well described by a VFT behavior
| (8) |
implying a divergence of the structural relaxation time at the temperature .
The self part of the van Hove correlation function is well suited to explore the mechanism for the structural relaxation. It is defined as Hansen and McDonald (1986)
| (9) |
Thus, for isotropic systems the quantity measures the probability density that an atom has travelled the distance during the time interval .
IV Results
IV.1 Structure
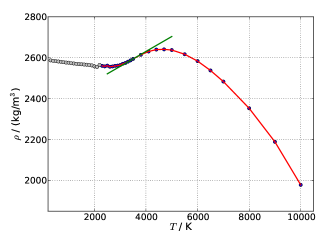
The temperature-dependent density of the studied silica melt is shown in Fig. 1. In contrast to most other liquids, where the density decreases monotonously with increasing temperature due to the increasing kinetic energy, BKS silica shows a local density minimum at about 3000 K, followed by a local maximum at approximately 4700 K. The steepest increase in density occurs at K. The density anomaly of silica melt was studied in both simulationsPoole, Hemmati, and Angell (1997); Shell, Debenedetti, and Panagiotopoulos (2002) and experiments.Angell and Kanno (1976); Brückner (1970) An experimental study reported a density maximum at 1800 K for ambient pressure,Angell and Kanno (1976) which is much lower than our value. This difference illustrates the fact that force fields in MD simulations are always optimized for certain quantities. Obviously, the density maximum of silica was not a reference value for the parametrization of the BKS potential. Nevertheless, this model correctly reproduces the qualitative behavior.
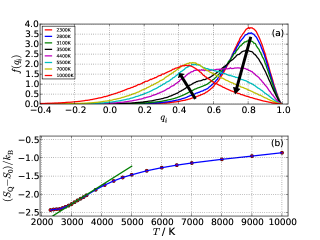
The structural changes that cause the density anomaly can be seen in the tetrahedral order parameter of the silicon atoms. Fig. 2(a) shows the distribution at various temperatures. For low temperatures the distribution has a sharp peak at . With increasing temperature develops a shoulder at lower values, which evolves into a new peak at . At 4500–5000 K this new peak becomes the main maximum of the distribution. These findings indicate that the degree of local order changes considerably with temperature. At low temperatures the structure is basically tetrahedral, similar to supercooled water, which exhibits roughly the same value of the tetrahedral order parameter.Klameth and Vogel (2013) At higher temperatures the local structure is significantly less ordered. These results confirm and improve previous results by Shell et al.Shell, Debenedetti, and Panagiotopoulos (2002) who simulated a smaller system comprised of 450 atoms over a narrower temperature range and worked at constant density rather than at constant pressure.
The structural changes are equally well visible in the tetrahedral entropy . The change in tetrahedral entropy is shown in Fig. 2(b). We see that the tetrahedral entropy strongly increases in the range 3000–5000 K and has a turning point at K, while the temperature dependence is much weaker at both lower and higher temperatures. The observed growth of in the intermediate temperature range indicates the breakup of the tetrahedral network upon heating. Interestingly, the temperature range of this loss of tetrahedral order agrees well with that of the density increase, providing strong evidence that these structural changes are closely related to the density anomaly.
IV.2 Dynamics
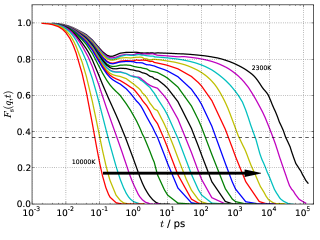
Fig. 3 displays for a wide range of temperatures (2300 K-10000 K). The ISF is shown for the silicon atoms, but it shows qualitatively similar behavior for the oxygen atoms (not shown), consistent with findings in previous studies on BKS silica.Horbach and Kob (2001); Vogel and Glotzer (2004b) We see that develops the characteristic two-step signature of glass-forming liquids upon cooling. A short-time decay due to vibrational dynamics is followed by a long-time decay due to structural relaxation, which strongly slows down upon cooling resulting in an extended intermediate plateau regime at sufficiently low temperatures. At the crossover between the vibrational and plateau regimes, i.e, at ca. ps, the ISF shows an oscillatory behavior, which was related to the boson peak by some scientists.Horbach, Kob, and Binder (2001)
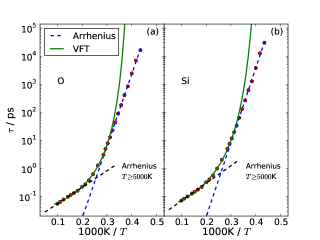
Fig. 4 shows the correlation times of the silicon and oxygen atoms as a function of inverse temperature. For both types of atoms, we observe a crossover in the temperature dependence at K. While the data are well described by a VFT fit above this crossover, they follow an Arrhenius law at lower temperatures. Table 3 shows the fit parameter. The VFT fits suggest a divergence of the correlation times near K for silicon and K for oxygen atoms. Alternatively, a power-law divergence predicted by the mode-coupling theory was used to describe the slowdown of the dynamics in the high-temperature regime.Horbach and Kob (2001); Vogel and Glotzer (2004b) In any case MD simulations consistently show that BKS silica cannot be considered as a strong glass-former at . Our Arrhenius fits at yield activation energies of 5.3 and 5.1 eV for the silicon and oxygen atoms, respectively. These values compare reasonably well with the activation energies from previous experimentalBrebec et al. (1980); Mikkelsen (1984) and computationalVogel and Glotzer (2004b); Horbach and Kob (1999, 2001); Saksaengwijit, Reinisch, and Heuer (2004) approaches. Interestingly, at temperatures K correlation times obey again an Arrhenius law (see dashed line in Fig. 4). The activation energies in this regime are 1.2 eV, which is far lower than in the supercooled regime.
| ( K) | |||||
|---|---|---|---|---|---|
| O | 3300K | 5.1 eV | 0.47 eV | 2340 K | 1.2 eV |
| Si | 3200K | 5.3 eV | 0.57 eV | 2180 K | 1.2 eV |
The observed crossover from VFT to Arrhenius behavior at K was also reported in previous MD work on BKS silica.Horbach and Kob (1999, 2001); Vogel and Glotzer (2004a, b); Saika-Voivod, Poole, and Sciortino (2001); Saika-Voivod, Sciortino, and Poole (2004); Saksaengwijit, Reinisch, and Heuer (2004) It yields evidence for the existence of a FS transition of this model. Previous studies rationalized this effect by a crossover between two liquid phases of silicaSaika-Voivod, Poole, and Sciortino (2001) or an existence of a cutoff of the potential energy landscape.Saksaengwijit, Reinisch, and Heuer (2004) Our simulations cover for the first time extended dynamic and temperature ranges that include clear Arrhenius behavior at lower temperatures and clear VFT behavior at higher temperatures.
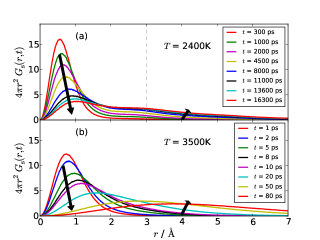
To investigate the mechanism for the structural relaxation, we analyze the self part of the van Hove correlation function. Fig. 5 shows the time evolution of for oxygen atoms at K and 3500 K. For short time intervals , the distribution is dominated by a sharp peak at around 1 Å, which is due to vibrational motion within local cages formed by neighbouring atoms. When extending the time interval this peak broadens. While a single-peak signature is retained at K, a secondary maximum grows at the expense of the primary maximum at K. This secondary maximum is located at Å, corresponding to the oxygen-oxygen distance. These observations indicate that a hopping motion of the oxygen atoms sets in when the temperature is decreased through the crossover region at K. In contrast we do not observe hopping motion for silicon atoms. These results agree with the literature.Horbach and Kob (1999) The fact that only oxygen atoms show hopping motion can be understood by realizing that oxygen atoms have less mass, are twice as numerous, and interact only with half as many neighbors compared to silicon atoms in the tetrahedral structure.
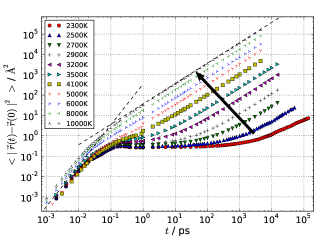
While the van Hove correlation function gives information about the type of motion within the liquid, the average displacement helps to identify the regimes of ballistic and diffusive motion, see Fig. 6, where the mean square displacement (MSD) for silicon atoms is shown. At very short time scales below 0.1 ps, the curves have a slope of 2 due to ballistic motion. At longer times diffusive motion sets in. Between these two regimes a plateau can be seen for temperatures below ca. 3200 K. The plateau value can be interpreted as the maximum squared distance an atom can travel within its cage. Motion over larger distances requires the rearrangement of several surrounding atoms.
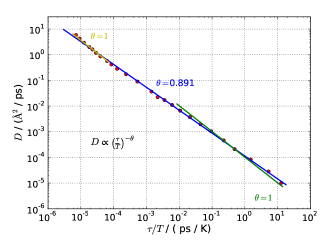
Based on the data displayed in Fig. 6, we calculated the diffusion coefficient by fitting the expression to the MSD at sufficiently long times. The resulting diffusion coefficient is plotted as a function of the correlation time , divided by the temperature, in Fig. 7. Over a wide range of correlation times the data are reasonably well described by with rather than . The corresponding temperature range is 2300 K–10000 K. We note that this breakdown of the classical Stokes-Einstein relation in BKS silica was not observed in previous studies covering a narrower range.Henritzi et al. (2015) We did not observe this breakdown either when we used a instead of a ensemble. Closer inspection of Fig. 7 reveals, however, that the Stokes-Einstein relation is recovered at low as well as high temperatures, where the solid lines with a slope of fit the data well. This means that the breakdown of the Stokes-Einstein relation occurs in the same temperature regime as the non-Arrhenius behavior.
V Conclusion
We performed a comprehensive MD study of the structural and dynamical features of liquid silica and found coherent evidence of a transition between two qualitatively different liquids in the vicinity of 3300 K. The structural features show an anomalous behavior of the density, which increases with temperature between 3000 K and 5000 K, with the maximum slope near 3400 K. Around this temperature, the tetrahedral order parameter changes from a high value () to a considerably lower value (). The temperature at which the tetrahedral entropy changes fastest is around 3100 K. These structural changes are accompanied by dynamical changes. The correlation time shows a qualitative change from an Arrhenius behavior, i.e., from a strong glass at lower temperatures (below 3300 K) to a Vogel-Fulcher-Tammann behavior, i.e., a fragile glass at higher temperatures. At very high temperatures ( K), dynamics shows again Arrhenius behavior, which means that silica becomes a simple liquid at sufficiently high temperatures. In the temperature range where the Arrhenius behavior breaks down, the Stokes-Einstein relation breaks also down, and the liquid shows anomalous diffusion with an exponent for the mean-square displacement.
All our results were obtained with a pressure of 1 bar. We also performed simulations at higher pressures and found that the transition from strong to fragile behavior moves to lower temperatures. For a pressure of 100 kbar the liquid is fragile for K. This change is expected since the phase with higher density is thermodynamically favored at higher pressures.
Taken together, our results extend considerably earlier evidence for a fragile-to-strong (FS) transition in silica. Such a transition was observed in experimentsRössler, Hess, and Novikov (1998); Hess, Dingwell, and Rössler (1996); Sonneville et al. (2013) and simulations.Saika-Voivod, Sciortino, and Poole (2004); Vogel and Glotzer (2004b); Saika-Voivod, Poole, and Sciortino (2001) Saika-Voivod et al. found a FS transition in the potential energy surfaceSaika-Voivod, Sciortino, and Poole (2004) and in the energy landscape.Saika-Voivod, Poole, and Sciortino (2001) Vogel et al. discovered a FS transition in the transport coefficient.Vogel and Glotzer (2004b) Horbach et al. Horbach and Kob (2001) evaluated the correlation time, but could only see the onset of the transition from VFT to Arrhenius behavior, due to the much narrower range of temperature and time scales. The breakdown of the Stokes-Einstein relation in silica has not been reported before. The transition back to simple dynamical behavior at very high temperatures has not been reported either.
The finding of a FS transition in simulations of small systems can be interpreted in several ways. The different possible thermodynamic scenarios compatible with the obeserved anomalies were discussed in Debenedetti (2003) for liquid water. Heckmann et al. showed that these scenarios are expected for any liquid with the same structure as water,Heckmann and Drossel (2012, 2013) and which of the possible scenarios is realized depends on the values of the parameters that characterize the interactions between the molecules, and on the entropy associated with the different possible nearest-neighbor configurations. First, there can be a true thermodynamic phase transition between two liquids with different density and different degree of order. In a small system, this phase transition would be visible as a smooth crossover between the two phases, and the transition temperature can be expected to be in the vicinity of the temperature where the changes are fastest, i.e. around 3300 K. Second, the system may have a true phase transition, but the investigated range of temperature and pressure values is beyond the critical end point of the transition line. The line where changes are fastest is the so-called Widom line, and it is the extension of the phase transition line beyond the critical point. Third, the critical point may be at zero temperature, so that the system shows no true phase transition, but it shows the anomalies caused by this critical point. Our data are compatible with any of these three situations. Future simulation studies or experiments will hopefully be capable of settling this interesting question whether silica or other network-forming liquids show a true thermodynamics phase transition in the liquid phase. If the observed FS transition is a true phase transition in the thermodynamic limit, this transition should become sharper with increasing system size. In contrast to water, silica has the advantage that it can be studied in the supercooled phase in experiments because it does not crystallize that easily. The reason is that the ion bonds in silica have a higher energy than the hydrogen bonds in water, making the barriers higher that have to be overcome when forming the crystal. For the experimental studies this means in particular that no nanoconfinement is required in order to prevent crystallization.
VI Acknowledgments
This work was performed within the DFG research unit FOR 1583 and supported by grant numbers Dr300/11-2 and Vo-905/9-2.
VII Bibliography
References
- Tanaka (2002) H. Tanaka, Phys. Rev. B 66, 064202 (2002).
- Angell et al. (2000) C. A. Angell, R. D. Bressel, M. Hemmati, E. J. Sare, and J. C. Tucker, Phys. Chem. Chem. Phys. 2, 1559 (2000).
- Fahrenheit (1724) D. G. Fahrenheit, Philosophical Transactions (1683-1775) 33, 78 (1724).
- Speedy and Angell (1976) R. J. Speedy and C. A. Angell, The Journal of Chemical Physics 65, 851 (1976).
- Angell (1983) C. A. Angell, Annual Review of Physical Chemistry 34, 593 (1983), http://dx.doi.org/10.1146/annurev.pc.34.100183.003113 .
- Mishima and Stanley (1998) O. Mishima and H. E. Stanley, Nature 396, 329 (1998).
- Prielmeier et al. (1987) F. X. Prielmeier, E. W. Lang, R. J. Speedy, and H.-D. Lüdemann, Phys. Rev. Lett. 59, 1128 (1987).
- Ito, Moynihan, and Angell (1999) K. Ito, C. T. Moynihan, and C. A. Angell, Nature 398, 492 (1999).
- Heckmann and Drossel (2012) L. Heckmann and B. Drossel, The Journal of Chemical Physics 137, 064503 (2012).
- Heckmann and Drossel (2013) L. Heckmann and B. Drossel, The Journal of Chemical Physics 138, 234503 (2013).
- Debenedetti (1996) P. Debenedetti, Metastable Liquids: Concepts and Principles, Physical chemistry : science and engineering (Princeton University Press, 1996).
- Poole, Hemmati, and Angell (1997) P. H. Poole, M. Hemmati, and C. A. Angell, Phys. Rev. Lett. 79, 2281 (1997).
- Shell, Debenedetti, and Panagiotopoulos (2002) M. S. Shell, P. G. Debenedetti, and A. Z. Panagiotopoulos, Phys. Rev. E 66, 011202 (2002).
- Brückner (1970) R. Brückner, Journal of Non-Crystalline Solids 5, 123 (1970).
- Angell and Kanno (1976) A. C. Angell and H. Kanno, Science 193, 1121 (1976).
- Saika-Voivod et al. (2004) I. Saika-Voivod, F. Sciortino, T. Grande, and P. H. Poole, Phys. Rev. E 70, 061507 (2004).
- Sharma, Mudi, and Chakravarty (2006) R. Sharma, A. Mudi, and C. Chakravarty, The Journal of Chemical Physics 125, 044705 (2006).
- Richet (1984) P. Richet, Geochimica et Cosmochimica Acta 48, 471 (1984).
- Angell (1991) C. Angell, Journal of Non-Crystalline Solids 131, 13 (1991).
- Rössler, Hess, and Novikov (1998) E. Rössler, K.-U. Hess, and V. Novikov, Journal of Non-Crystalline Solids 223, 207 (1998).
- Hess, Dingwell, and Rössler (1996) K.-U. Hess, D. Dingwell, and E. Rössler, Chemical Geology 128, 155 (1996), 5TH Silicate Melt Workshop.
- Sonneville et al. (2013) C. Sonneville, T. Deschamps, C. Martinet, D. de Ligny, A. Mermet, and B. Champagnon, Journal of Non-Crystalline Solids 382, 133 (2013).
- Horbach and Kob (1999) J. Horbach and W. Kob, Phys. Rev. B 60, 3169 (1999).
- Horbach and Kob (2001) J. Horbach and W. Kob, Phys. Rev. E 64, 041503 (2001).
- Saika-Voivod, Poole, and Sciortino (2001) I. Saika-Voivod, P. H. Poole, and F. Sciortino, Nature 412, 514 (2001).
- Saika-Voivod, Sciortino, and Poole (2004) I. Saika-Voivod, F. Sciortino, and P. H. Poole, Phys. Rev. E 69, 041503 (2004).
- Vogel and Glotzer (2004a) M. Vogel and S. C. Glotzer, Phys. Rev. Lett. 92, 255901 (2004a).
- Vogel and Glotzer (2004b) M. Vogel and S. C. Glotzer, Phys. Rev. E 70, 061504 (2004b).
- Saksaengwijit, Reinisch, and Heuer (2004) A. Saksaengwijit, J. Reinisch, and A. Heuer, Phys. Rev. Lett. 93, 235701 (2004).
- Saika-Voivod, Sciortino, and Poole (2000) I. Saika-Voivod, F. Sciortino, and P. H. Poole, Phys. Rev. E 63, 011202 (2000).
- Lascaris et al. (2015) E. Lascaris, M. Hemmati, S. V. Buldyrev, H. E. Stanley, and C. A. Angell, The Journal of Chemical Physics 142, 104506 (2015).
- Sastry and Austen Angell (2003) S. Sastry and C. Austen Angell, Nat Mater 2, 739 (2003).
- van Beest, Kramer, and van Santen (1990) B. W. H. van Beest, G. J. Kramer, and R. A. van Santen, Phys. Rev. Lett. 64, 1955 (1990).
- Bormuth (2012) A. Bormuth, Untersuchung der Polymerdynamik in Abhängigkeit von Kettenlänge, Temperatur und Druck mit Hilfe von Molekulardynamik Simulationen, Ph.D. thesis, TU Darmstadt (2012).
- Chau and Hardwick (1998) P.-L. Chau and A. J. Hardwick, Molecular Physics 93, 511 (1998), http://dx.doi.org/10.1080/002689798169195 .
- Errington and Debenedetti (2001) J. R. Errington and P. G. Debenedetti, Nature 409, 318 (2001).
- Kumar, Buldyrev, and Stanley (2009) P. Kumar, S. V. Buldyrev, and E. Stanley, PNAS 106, 22130 (2009).
- Hansen and McDonald (1986) J.-P. Hansen and I. R. McDonald, in Theory of Simple Liquids (FirstEdition), edited by J.-P. Hansen and I. R. McDonald (Academic Press, Burlington, 1986) first edition ed., pp. 178 – 218.
- Chang et al. (1994) I. Chang, F. Fujara, B. Geil, G. Heuberger, T. Mangel, and H. Sillescu, Journal of Non-Crystalline Solids 172–174, Part 1, 248 (1994), relaxations in Complex Systems.
- Rössler (1990) E. Rössler, Phys. Rev. Lett. 65, 1595 (1990).
- Henritzi et al. (2015) P. Henritzi, A. Bormuth, F. Klameth, and M. Vogel, The Journal of Chemical Physics 143, 164502 (2015), http://dx.doi.org/10.1063/1.4933208.
- Klameth and Vogel (2013) F. Klameth and M. Vogel, The Journal of Chemical Physics 138, 134503 (2013).
- Horbach, Kob, and Binder (2001) J. Horbach, W. Kob, and K. Binder, The European Physical Journal B - Condensed Matter and Complex Systems 19, 531 (2001).
- Brebec et al. (1980) G. Brebec, R. Seguin, C. Sella, J. Bevenot, and J. Martin, Acta Metallurgica 28, 327 (1980).
- Mikkelsen (1984) J. C. Mikkelsen, Applied Physics Letters 45, 1187 (1984).
- Debenedetti (2003) P. G. Debenedetti, Journal of Physics: Condensed Matter 15, R1669 (2003).