An extreme paucity of second population AGB stars in the ‘normal’ globular cluster M4
Abstract
Galactic Globular clusters (GCs) are now known to harbour multiple stellar populations, which are chemically distinct in many light element abundances. It is becoming increasingly clear that asymptotic giant branch (AGB) stars in GCs show different abundance distributions in light elements compared to those in the red giant branch (RGB) and other phases, skewing toward more primordial, field-star-like abundances, which we refer to as subpopulation one (SP1). As part of a larger program targeting giants in GCs, we obtained high-resolution spectra for a sample of 106 RGB and 15 AGB stars in Messier 4 (NGC 6121) using the 2dF+HERMES facility on the Anglo-Australian Telescope. In this Letter we report an extreme paucity of AGB stars with [Na/O] in M4, which contrasts with the RGB that has abundances up to [Na/O] . The AGB abundance distribution is consistent with all AGB stars being from SP1. This result appears to imply that all subpopulation two stars (SP2; Na-rich, O-poor) avoid the AGB phase. This is an unexpected result given M4’s horizontal branch morphology – it does not have an extended blue horizontal branch. This is the first abundance study to be performed utilising the HERMES spectrograph.
keywords:
Galaxy: formation – Galaxy: abundances – Galaxy: globular clusters: general – stars: abundances – stars: AGB and post-AGB.1 Introduction
It has been well established that Galactic GCs are typically homogeneous in the iron peak species (Carretta et al., 2009b), but are chemically inhomogeneous in elements affected by proton-capture reactions (e.g., C, N, O, Na). These inhomogeneities are generally thought to arise from nucleosynthesis in the first generation of stars (Gratton et al., 2004). Correlations exist in the star-to-star scatter of some elemental abundances within each cluster, and can be used as tracers of GC formation (see Gratton et al. 2012 for an extensive review). One well-documented chemical pattern is the sodium and oxygen anti-correlation (Na-O), seen in all GCs (Carretta et al., 2010), but not in open clusters (De Silva et al., 2009; MacLean et al., 2015). The Na-O anti-correlation has been documented across both evolved and unevolved stars in many GCs, indicating that this pattern must be imprinted on the stars at their birth. While GC stars can often be separated into more than two distinct subpopulations in chemical space, for the sake of clarity here we use just two. Stars with near primordial abundances (Na-poor, O-rich) we designate as subpopulation one (SP1) and those enriched in sodium and depleted in oxygen as subpopulation two (SP2). We also define the percentage of RGB and AGB stars in a GC that are found to be members of SP2 as and , respectively. In studies targeting the RGB in GCs, typical values are found to be on the order of 60 (see Figure 16 in Carretta et al., 2010).
It is becoming clear that the light element abundance distributions of AGB stars are significantly different to those of stars in other phases of evolution in many GCs. Norris et al. (1981) found no examples of cyanogen (CN) strong AGB stars in NGC 6752 despite the bimodality of CN strengths in the RGB (see also Campbell et al., 2010). Campbell et al. (2013) observed Na abundances of AGB stars in the same cluster, and no Na-rich AGB stars were found (, compared to ). They concluded that the most likely explanation was that all Na-rich stars (SP2) fail to reach the AGB phase. M 62 was similarly observed to have a value of (Lapenna et al., 2015), while for 47 Tucanae Johnson et al. (2015) found that , indicating that a smaller, but significant proportion of SP2 stars are avoiding the AGB phase.
We define the ‘AGB failure rate’ of a GC to be the percentage of SP2 stars that avoid the AGB (as inferred by its value), given by
| (1) |
where a value of 100 indicates that no SP2 stars reach the AGB (as in NGC 6752), and a value of zero indicates that . We provide an up-to-date summary of this ‘AGB avoidance’ phenomenon in Table 4.
While theoretical simulations struggle to quantitatively reproduce the Na distributions of AGB stars in GCs, it likely results from the He-enrichment of SP2 (Charbonnel et al., 2013; Cassisi et al., 2014; Charbonnel & Chantereau, 2016). This results in a smaller envelope mass in the horizontal branch (HB) phase, giving rise to higher surface temperatures. The most extreme of these stars fail to reach the AGB phase and evolve directly to the white dwarf phase and are known as AGB-manqué (‘failed’) stars (Greggio & Renzini, 1990). Gratton et al. (2010) showed that a large He-enrichment can result in an extended blue-HB (e.g. NGC 6752 and M 62), suggesting that an extended blue-HB may be indicative of a high value. The recently reported slight AGB failure rate of 47 Tucanae (Johnson et al., 2015), which contains only a red HB, further supports this link between HB morphology and AGB avoidance.
The GC Messier 4 (NGC 6121), considered archetypal, is moderately metal-poor and shows well-populated and distinct red- and blue-HBs with no significant blue extension (Mochejska et al., 2002). Norris (1981) first documented the bimodality of the CN band strength of giant stars in M4 (although we note that Smith & Norris, 1993 reported a CN-strong monomodality on the RGB), and Carretta et al. (2013) suggested that it only contains two distinct subpopulations (unlike many GCs which contain three or more). While the high resolution abundance study of Ivans et al. (1999) first hinted at a disparity between and , AGB stars have never been systematically studied. M4 has been observed to show a bimodal distribution in Na and O on the RGB (Marino et al., 2008, hereafter M08) and the HB, with all red-HB stars belonging to SP1 (Marino et al., 2011).
In this paper we present results from the first systematic study of the AGB of M4, including Na and O abundances for a sample of 106 RGB stars and 15 AGB stars. This work is part of a larger study of AGB abundances in GCs (Campbell et al., 2010, 2013), and presents the first abundance results from the HERMES spectrograph on the AAT.
2 Observations and membership
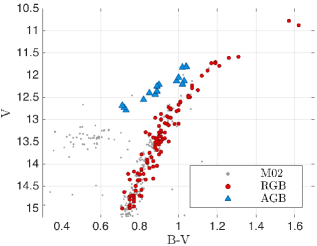
For target selection we used photometry of M4 from two sources; UBV from Mochejska et al. (2002, with an 8.8’x8.8’ field of view) and UBVI from the ESO/MPG Wide Field Imager (WFI, with a 34’x33’ field of view; Momany et al., 2003). The RGB and AGB were separated in both V(BV) (see Figure 1) and U(UI), allowing for an accurately selected sample of AGB stars. We applied a correction of a constant value (Hendricks et al., 2012) because M4 is affected by significant reddening.
Spectra were collected in August 2014 and July 2015 using 2dF+HERMES on the AAT which provides resolution spectra in 4 narrow spectral windows (Sheinis et al., 2015). In total 121 targets were observed with average SNR of 70. The software package 2dfdr (AAO Software Team, 2015, v6.5) was used to reduce the spectral data for analysis.
Radial velocities for the HERMES spectra were measured with the iraf fxcor package (Tody, 1986), using a solar reference template. We considered all stars with radial velocities above 90 km/s or below 50 km/s to be non-members. Our average radial velocity after non-member elimination was <v> = km/s ( km/s), agreeing well with Malavolta et al. (2015), who report <v> = km/s ( km/s). Individual stellar radial velocities are in Table 1. Stellar metallicities (discussed in 3.1) were used as a further test of cluster membership, with one AGB star and two RGB stars possessing metallicities that were farther than 2 from the mean, leaving a sample of 106 RGB and 15 AGB stars. A colour-magnitude diagram of the final sample is presented in Figure 1.
3 Method and Results
3.1 Atmospheric parameters
BV photometry was used to calculate initial estimates of the stellar parameters for each star. Effective temperature () was estimated using the calibrated scale of Ramírez & Meléndez (2005), while surface gravity (log ) and microturbulence () were estimated using empirical relations from Alonso et al. (1999) and Gratton et al. (1996), respectively.
Final , log and values (Table 1) were determined spectroscopically by measuring the equivalent widths (using the ares package, Sousa et al., 2015) of neutral and singly-ionized iron (Fe I & II, respectively) absorption lines and calculating the one-dimensional local thermodynamic equilibrium (LTE) abundance from each line with the moog code (Sneden, 1973, June 2014 release) and model atmospheres interpolated from the Castelli & Kurucz (2004) grid. Final spectroscopic parameters were found by requiring excitation and ionisation balance (with tolerances of 0.015 in slope and 0.1 dex, respectively), as per Sousa (2014) and using our newly developed code phobos, to be detailed in MacLean et al. (2016, in preparation). We found the average metallicity of the cluster to be <[Fe/H]> = ().
3.2 Chemical abundances & Analysis of results
We determined LTE abundances for Na and O by measuring the equivalent widths of a selection of absorption lines. It is well known that many sodium and oxygen lines deviate from LTE, with systematic offsets that have been a subject of much research (e.g., Asplund, 2005; Lapenna et al., 2014). The sodium 568 nm doublet was measured for each star, and the abundances of each line were corrected for non-LTE effects as described in Lind et al. (2011) by using the web-based inspect interface111http://inspect-stars.net, and adopting the provided [Na/Fe] corrections which were around dex.
In the case of oxygen, the 777 nm triplet was measured and corrected for non-LTE effects following Takeda (2003). Recently, Amarsi et al. (2015) calculated a fine grid of oxygen corrections for both non-LTE effects and the effects of using 3D stellar atmosphere models; however the grid range is > 5000K and log > 3.0; outside the range of most of our stars.
Final [Na/Fe] and [O/Fe] abundances for all confirmed cluster members are contained in Table 1. Also included are uncertainties based on line-to-line scatter, which are in the range to dex. The abundance sensitivities due to the uncertainty in stellar parameters are given in Table 2. These are on the order of 0.02 to 0.15 dex.
| Star | Type | RV | log | [Fe/H] | [O/Fe] | [Na/Fe] | ID | ||
|---|---|---|---|---|---|---|---|---|---|
| (km/s) | (K) | (cgs) | (km/s) | M08 | |||||
| 25 | RGB | 66.6 | 5028 | 2.64 | 1.09 | -1.14 0.12 | 0.30 0.12 | 0.43 0.13 | - |
| 907 | RGB | 69.4 | 5047 | 2.69 | 0.94 | -1.18 0.11 | 0.42 0.12 | 0.37 0.11 | - |
| 1029 | RGB | 72.2 | 4936 | 2.45 | 1.41 | -1.10 0.09 | 0.09 0.11 | 0.49 0.11 | 22089 |
| 1129 | RGB | 69.6 | 4886 | 2.20 | 1.20 | -1.11 0.10 | 0.35 0.12 | 0.10 0.10 | - |
| 1474 | RGB | 70.4 | 5159 | 2.78 | 0.92 | -1.06 0.11 | 0.12 0.12 | 0.39 0.12 | - |
| [O/Fe] | [Na/Fe] | ||||||||||
|---|---|---|---|---|---|---|---|---|---|---|---|
| Star | Type | log | log | Total | log | Total | |||||
| (50K) | (0.2) | (0.1) | (50K) | (0.2) | (0.1) | ||||||
| 16547 | AGB | 4847 | 1.90 | 0.07 | 0.07 | 0.01 | 0.10 | 0.04 | 0.01 | 0.02 | 0.03 |
| 16788 | RGB | 3954 | 0.36 | 0.10 | 0.11 | 0.01 | 0.15 | 0.05 | 0.04 | 0.04 | 0.02 |
| 47603 | RGB | 5251 | 3.01 | 0.06 | 0.06 | 0.01 | 0.08 | 0.03 | 0.02 | 0.01 | 0.02 |
There is significant overlap between our RGB sample, that of M08 (51 stars in common), and Carretta et al. (2009a, hereafter C09, 46 stars in common). We made a detailed comparison of this intersecting sample, which revealed that while there are slight offsets between each study in several stellar parameters, the scatter among the parameters is consistent with uncertainties quoted in this work. The results of this comparison are provided in Table 3.
| Parameter | This study M08 | This study C09 |
|---|---|---|
| 53.9 1.1 | 154.8 1.5 | |
| log | 0.004 | 0.080 0.003 |
| 0.004 | 0.049 0.007 | |
| [Fe/H] | 0.001 | 0.054 0.002 |
| [O/Fe] | 0.014 0.003 | 0.197 0.004 |
| [Na/Fe] | 0.002 | 0.003 |
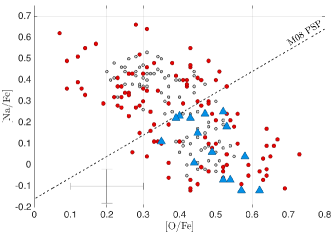
The [Na/Fe] and [O/Fe] values of our RGB and AGB samples are plotted along with the RGB sample of M08 in Figure 2. The larger scatter in our abundances compared to M08 is due the lower signal-to-noise ratio of our data. We attempted to define a population separation point (PSP) in our RGB sample by identifying a minimum between the two subpopulations (see Fig. 7 in M08; however the uncertainties in our abundances combined with the relatively small spread in Na and O in M4 did not allow us to define one reliably. We have instead included the M08 PSP at [Na/O] in the figure. Using this PSP we find , which is consistent with that found by M08. It is also close to , as determined for the double main sequence using photometric star counts (Milone et al., 2014).
The usual Na-O anticorrelation can be seen in the RGB sample, with a spread of dex in [Na/Fe] and dex in [O/Fe]. In contrast, the AGB distribution is heavily skewed to SP1 compositions, with the spread in AGB abundances being restricted to dex in [Na/Fe] and dex in [O/Fe]. There are no AGB stars above the M08 PSP, giving and .
4 Discussion and conclusions
| NGC | Other | [Fe/H] | Y | Sample size | HB | Elements | ||||
| RGB | AGB | morphology | used | |||||||
| 104 | 47 Tuc | 0.0222footnotemark: 2 | 11333footnotemark: 3 | 35 | 55 | 37 | 33 | R | Na | |
| 5272 | M 3 | 0.0244footnotemark: 4 | 4655footnotemark: 5 | 9 | 50 | 33 | 34 | R+B | Al | |
| 5904 | M 5 | - | 1075 | 15 | 50 | 33 | 34 | R+B+EB | Al | |
| 6121 | M 4 | 0.0166footnotemark: 6 | 10677footnotemark: 7 | 15 | 55 | 0 | 100 | R+B | Na-O | |
| 6205 | M 13 | 0.0688footnotemark: 8 | 675 | 14 | 70 | 27 | 61 | B+EB | Al | |
| 6266 | M 62 | 0.0899footnotemark: 9 | 131010footnotemark: 10 | 5 | 46 | 0 | 100 | R+B+EB | Na-O, Mg-Al | |
| 6752 | - | 0.031111footnotemark: 11 | 241212footnotemark: 12 | 20 | 70 | 0 | 100 | EB | Na | |
| 7089 | M 2 | 0.071313footnotemark: 13 | 125 | 5 | 80 | 40 | 50 | B+EB | Al | |
| 2 Milone et al. (2012) 3 Johnson et al. (2015) 4 Valcarce et al. (2016) 5 García-Hernández et al. (2015) | ||||||||||
| 6 Valcarce et al. (2014) 7 This study 8 Dalessandro et al. (2013) 9 Milone (2015) 10 Lapenna et al. (2015) | ||||||||||
| 11 Milone et al. (2013) 12 Campbell et al. (2013) 13 Milone et al. (2015) | ||||||||||
The novel feature of this work is the AGB sample. This is the first time that the AGB has been specifically targeted in M4. We found that our sample of AGB stars has a much smaller spread in Na and O abundances than the RGB sample. Following the population separation point from M08, the AGB distribution is consistent with and . However, given (i) that the tails of the SP1 and SP2 RGB distributions appear to overlap in [Na/O] (cf. Fig. 7 in M08), and (ii) the uncertainties in our data, it is possible that the higher-Na (lower-O) AGB stars actually lie in the tail of the SP2 distribution. This would increase the value of from zero. Thus, until better data are obtained for the AGB stars, some uncertainty remains as to the exact failure rate () of M4. It is clear however that the majority of AGB stars in M4 have compositions typical of SP1 stars (Fig. 2). A further uncertainty lies in the NLTE corrections, which may not be accurate for AGB stars. This was suggested by Lapenna et al. (2015) as a possible risk to determining subpopulation membership based on NLTE-affected Na lines; however there is growing evidence from a number of studies (including the Lapenna et al., 2015 M 62 study) that SP2 AGB avoidance is common in GCs. These studies are based on various elements and atomic lines (Table 4).
To put this finding in context we provide a summary of AGB and RGB subpopulation membership in Table 4 for the GCs for which values have been determined. The table also includes HB morphology descriptions. As previously mentioned, recent observational and theoretical work has suggested a close link between HB morphology, He-enrichment, and values in GCs. For example, helium enrichment in NGC 6752 and M 62 – both of which have – has been inferred to be relatively high, with Y 0.03 and 0.08, respectively (Milone et al., 2013; Milone, 2015). Both these GCs also have extended blue HBs. In Table 4 the GC with the closest HB morphology to M4 is M3. The helium spread in M3 has been reported to be up to Y (Valcarce et al., 2016). In terms of AGB stars, García-Hernández et al. (2015) report that M3 has , as is (qualitatively) expected from its HB morphology and moderate He enrichment. Given M4’s low He enrichment (Y , Valcarce et al., 2014), and its lack of an extended blue-HB, it would be expected that the AGB abundance distribution should be similar to M3 or 47 Tucanae (red-HB only, ). It should be noted that age is a critical parameter in HB morphology, and that the differences in ages between these three clusters (M3, M4 and 47 Tuc) are up to Gyr (Carretta et al., 2010; Charbonnel & Chantereau, 2016). Instead of showing a low to moderate AGB failure rate, as may be expected, M4 is consistent with a GC with an extended blue-HB and a higher SP2 He abundance. Furthermore, a comparison between the HB morphologies of M4 and NGC 6752 shows that the M4 blue HB ends approximately where the NGC 6752 HB starts (around Teff K). Using star counts Campbell et al. (2013) report that it is only the stars hotter than K (the Grundahl Jump) that fail to reach the AGB, ie. far beyond the bluest HB stars in M4. Models predict AGB avoidance only at even higher temperatures (see eg. Fig. 3 in Campbell et al. 2013). This suggests that there is one (or more) extra parameters that determine AGB avoidance, and that the HB stellar models cannot reproduce the observations, particularly for M4.
The extreme paucity (or possible total lack, ) of SP2 AGB stars in the ‘normal’ globular cluster M4 imposes further constraints upon the theory of the evolution of low-mass metal-poor stars, in particular the evolution of SP2 stars through the giant phases of evolution, and how this may be tied to their initial He abundances, mass-loss histories, and other factors. Finally, this result (i) demonstrates that star counts using the AGB to test stellar evolution time-scales may be unreliable because of altered CMD number statistics, (ii) could help to understand the source of excess UV flux in the spectra of elliptical galaxies due to the high surface temperatures of AGB-manqué stars, and (iii) may provide indirect clues to the formation history of globular clusters and their HB morphologies.
Acknowledgements
Based in part on data acquired through the AAO, via programs 14B/27 and 15A/21 (PI Campbell). VD acknowledges support from AAO distinguished visitor program 2016.
References
- AAO Software Team (2015) AAO Software Team 2015, 2dfdr: Data reduction software, Astrophysics Source Code Library (ascl:1505.015)
- Alonso et al. (1999) Alonso A., Arribas S., Martínez-Roger C., 1999, A&AS, 140, 261
- Amarsi et al. (2015) Amarsi A. M., Asplund M., Collet R., Leenaarts J., 2015, MNRAS, 454, L11
- Asplund (2005) Asplund M., 2005, ARA&A, 43, 481
- Asplund et al. (2009) Asplund M., Grevesse N., Sauval A. J., Scott P., 2009, ARA&A, 47, 481
- Campbell et al. (2010) Campbell S. W., Yong D., Wylie-de Boer E. C., Stancliffe R. J., Lattanzio J. C., Angelou G. C., Grundahl F., Sneden C., 2010, MmSAI, 81, 1004
- Campbell et al. (2013) Campbell S. W., et al., 2013, Nature, 498, 198
- Carretta et al. (2009a) Carretta E., et al., 2009a, A&A, 505, 117
- Carretta et al. (2009b) Carretta E., Bragaglia A., Gratton R., D’Orazi V., Lucatello S., 2009b, A&A, 508, 695
- Carretta et al. (2010) Carretta E., Bragaglia A., Gratton R. G., Recio-Blanco A., Lucatello S., D’Orazi V., Cassisi S., 2010, A&A, 516, A55
- Carretta et al. (2013) Carretta E., Gratton R. G., Bragaglia A., D’Orazi V., Lucatello S., 2013, A&A, 550, A34
- Cassisi et al. (2014) Cassisi S., Salaris M., Pietrinferni A., Vink J. S., Monelli M., 2014, A&A, 571, A81
- Castelli & Kurucz (2004) Castelli F., Kurucz R. L., 2004, ArXiv Astrophysics e-prints,
- Charbonnel & Chantereau (2016) Charbonnel C., Chantereau W., 2016, A&A, 586, A21
- Charbonnel et al. (2013) Charbonnel C., Chantereau W., Decressin T., Meynet G., Schaerer D., 2013, A&A, 557, L17
- Dalessandro et al. (2013) Dalessandro E., Salaris M., Ferraro F. R., Mucciarelli A., Cassisi S., 2013, MNRAS, 430, 459
- De Silva et al. (2009) De Silva G. M., Gibson B. K., Lattanzio J., Asplund M., 2009, A&A, 500, L25
- García-Hernández et al. (2015) García-Hernández D. A., Mészáros S., Monelli M., Cassisi S., Stetson P. B., Zamora O., Shetrone M., Lucatello S., 2015, ApJL, 815, L4
- Gratton et al. (1996) Gratton R. G., Carretta E., Castelli F., 1996, A&A, 314, 191
- Gratton et al. (2004) Gratton R., Sneden C., Carretta E., 2004, ARA&A, 42, 385
- Gratton et al. (2010) Gratton R. G., D’Orazi V., Bragaglia A., Carretta E., Lucatello S., 2010, A&A, 522, A77
- Gratton et al. (2012) Gratton R. G., Carretta E., Bragaglia A., 2012, A&A~Rev., 20, 50
- Greggio & Renzini (1990) Greggio L., Renzini A., 1990, ApJ, 364, 35
- Hendricks et al. (2012) Hendricks B., Stetson P. B., VandenBerg D. A., Dall’Ora M., 2012, AJ, 144, 25
- Ivans et al. (1999) Ivans I. I., Sneden C., Kraft R. P., Suntzeff N. B., Smith V. V., Langer G. E., Fulbright J. P., 1999, AJ, 118, 1273
- Johnson et al. (2015) Johnson C. I., et al., 2015, AJ, 149, 71
- Lapenna et al. (2014) Lapenna E., Mucciarelli A., Lanzoni B., Ferraro F. R., Dalessandro E., Origlia L., Massari D., 2014, ApJ, 797, 124
- Lapenna et al. (2015) Lapenna E., Mucciarelli A., Ferraro F. R., Origlia L., Lanzoni B., Massari D., Dalessandro E., 2015, ApJ, 813, 97
- Lind et al. (2011) Lind K., Asplund M., Barklem P. S., Belyaev A. K., 2011, A&A, 528, A103
- MacLean et al. (2015) MacLean B. T., De Silva G. M., Lattanzio J., 2015, MNRAS, 446, 3556
- Malavolta et al. (2015) Malavolta L., Piotto G., Bedin L. R., Sneden C., Nascimbeni V., Sommariva V., 2015, MNRAS, 454, 2621
- Marino et al. (2008) Marino A. F., Villanova S., Piotto G., Milone A. P., Momany Y., Bedin L. R., Medling A. M., 2008, A&A, 490, 625
- Marino et al. (2011) Marino A. F., Villanova S., Milone A. P., Piotto G., Lind K., Geisler D., Stetson P. B., 2011, ApJL, 730, L16
- Milone (2015) Milone A. P., 2015, MNRAS, 446, 1672
- Milone et al. (2012) Milone A. P., et al., 2012, ApJ, 744, 58
- Milone et al. (2013) Milone A. P., et al., 2013, ApJ, 767, 120
- Milone et al. (2014) Milone A. P., et al., 2014, MNRAS, 439, 1588
- Milone et al. (2015) Milone A. P., et al., 2015, MNRAS, 447, 927
- Mochejska et al. (2002) Mochejska B. J., Kaluzny J., Thompson I., Pych W., 2002, AJ, 124, 1486
- Momany et al. (2003) Momany Y., Cassisi S., Piotto G., Bedin L. R., Ortolani S., Castelli F., Recio-Blanco A., 2003, A&A, 407, 303
- Norris (1981) Norris J., 1981, ApJ, 248, 177
- Norris et al. (1981) Norris J., Cottrell P. L., Freeman K. C., Da Costa G. S., 1981, ApJ, 244, 205
- Ramírez & Meléndez (2005) Ramírez I., Meléndez J., 2005, ApJ, 626, 465
- Sheinis et al. (2015) Sheinis A., et al., 2015, Journal of Astronomical Telescopes, Instruments, and Systems, 1, 035002
- Smith & Norris (1993) Smith G. H., Norris J. E., 1993, AJ, 105, 173
- Sneden (1973) Sneden C. A., 1973, PhD thesis, The University of Texas at Austin
- Sousa (2014) Sousa S. G., 2014, preprint, (arXiv:1407.5817)
- Sousa et al. (2015) Sousa S. G., Santos N. C., Adibekyan V., Delgado-Mena E., Israelian G., 2015, A&A, 577, A67
- Takeda (2003) Takeda Y., 2003, A&A, 402, 343
- Tody (1986) Tody D., 1986, in Crawford D. L., ed., Proc. SPIE Vol. 627, Instrumentation in Astronomy VI. p. 733
- Valcarce et al. (2014) Valcarce A. A. R., Catelan M., Alonso-García J., Cortés C., De Medeiros J. R., 2014, ApJ, 782, 85
- Valcarce et al. (2016) Valcarce A. A. R., Catelan M., Alonso-García J., Contreras Ramos R., Alves S., 2016, preprint, (arXiv:1601.06747)