Fermi Study of 5–300 GeV emission from the high-mass pulsar binary PSR B125963/LS 2883
Abstract
We report the results from our detailed analysis of the Fermi Large Area Telescope (LAT) data for the pulsar binary PSR B125963/LS 2883. During the GeV flares that occurred when the pulsar was in the periastron passages, we have detected a 5–300 GeV component at in emission from the binary. The detection verifies the presence of the component that has been marginally found in the previous studies of the binary. Furthermore, we have discovered that this component was present even in the quiescent state of the binary, specifically the mean anomaly phase 0.7–0.9. The component can be described by a power law with photon index , and the flux in the flares is approximately one order of magnitude higher than that in quiescence. We discuss the origin of this component. It likely arises from the inverse-Compton process: high-energy particles from the shock, due to the interaction between the winds from the pulsar and massive companion, scatter the seed photons from the companion to GeV/TeV energies. Based on this scenario, model fits to the broad-band X-ray–to–TeV spectra of the binary in the flaring and quiescent states are provided.
Subject headings:
gamma rays: stars – pulsars: individual (PSR B125963)1. Introduction
Among a handful high-mass -ray binaries currently found in our Galaxy (e.g., Dubus 2013; Acero et al. 2015), PSR B125963/LS 2883 (hereafter B125963) is unique in that its compact star is known being a 47.8 ms radio pulsar (Johnston et al., 1992), while those in the others are not certain. Whether there is a black hole or a pulsar in such a binary is critical for our understanding of their high-energy emission mechanisms. For the former case, -ray binaries would be like microquasars with emission powered by accretion energy, while for the latter, they would be pulsar binaries powered by the rotational energy (Dubus, 2013). Given that B125963 might be the representing example of the -ray binary group, providing a clear picture for the physical processes that occur in such binaries, its general properties are of great importance and have been studied in amazing detail at every accessible energy band.
The companion LS 2883 in B125963 has been identified as an O9.5Ve main sequence (e.g., Johnston et al. 1994; Shannon et al. 2014) at a distance of kpc (Negueruela et al., 2011). The pulsar moves around the massive companion with an orbital period of yr, and the orbit is highly eccentric (). An orbital inclination angle of 247 can be estimated from the mass function of this binary (, and assuming a standard neutron star mass of 1.4 ; Johnston et al. 1994). It is considered that the pulsar wind has a strong interaction with the stellar wind, resulting in a termination shock, where particles are accelerated and nonthermal emission is radiated over a wide range of energy bands (e.g., Tavani & Arons 1997). As the pulsar moves near the periastron of the orbit, because the equatorial disk of LS 2883 is inclined at an angle of to the orbital plane (Melatos et al., 1995; Shannon et al., 2014), the pulsar crosses the disk twice. During the crossing, much enhanced emission has been observed (e.g., Chernyakova et al. 2006, 2014).
Previously, B125963 has been well studied at X-ray energies (see, e.g., Chernyakova et al. 2006, 2009), and the very-high-energy (VHE) -ray emission was discovered by High Energy Stereoscopic System (HESS; Aharonian et al. 2005) during the 2004 periastron passage. After Fermi Gamma-Ray Space Telescope (Fermi) was launched in 2008, GeV -ray emission was also detected during the 2010 periastron passage (Abdo et al., 2011). Since then, more intensive studies of the binary have been conducted over the past few years. Now from various observations, it has been established that during a periastron passage, the source’s X-ray emission is 10 times enhanced and the flux peak appears approximately 20 days after the periastron. At GeV energies, a flare that can be significantly detected by Fermi occurs 30–80 days after the periastron (Tam et al., 2015; Caliandro et al., 2015; Chernyakova et al., 2015), with emission described by a power law with photon index (Tam et al., 2015; Caliandro et al., 2015). The X-ray plus low-energy -ray emission during the same passage time periods has been suggested to be due to synchrotron radiation of high energy particles accelerated at the termination shock of the pulsar wind (e.g., Takata & Taam 2009; Kong et al. 2011; Chernyakova et al. 2015). In addition, marginal detections of the source in the Fermi high energy range (several tens of GeV) during the flares were recorded (see Tam et al. 2015 and Figure 8 in Chernyakova et al. 2015). This component may be the low energy tail of the spectral component observed at TeV by HESS (H.E.S.S. Collaboration et al., 2013), and has been suggested to be due to the inverse Compton (IC) process: the stellar photons are up-scattered by the particles from the shocked pulsar wind to the high energies. (e.g., Takata & Taam 2009; Kong et al. 2011; Chernyakova et al. 2015).

In this paper we report our detailed analysis of the Fermi Large Area Telescope (LAT) data of the binary for studying the high energy component. From the analysis, we verified the detection of the component during the flares, and found that this component existed even during the quiescent time period (i.e., excluding the periastron passages).
2. Data Analysis and Results
2.1. Fermi LAT Data
LAT is a -ray imaging instrument onboard Fermi. It scans the whole sky every three hours and can continuously conduct long-term -ray observations of thousands of GeV sources (Atwood et al., 2009). In the analysis, we selected 0.1–300 GeV LAT events from the Fermi Pass 8 database inside a region centered at the position of B125963, which is R.A.=13h02m4764, Decl.=63∘50′0867 (equinox J2000.0; Shannon et al. 2014). The time period of the LAT data is from 2008-08-04 15:43:36 (UTC) to 2015-11-26 00:08:16 (UTC). Following the recommendations of the LAT team111http://fermi.gsfc.nasa.gov/ssc/data/analysis/scitools/, we included the events with zenith angles less than 90 degrees, which prevents the Earth’s limb contamination, and excluded the events with quality flags of ‘bad’.
2.2. Likelihood and Spectral Analysis of the Periastron Passage Data
We first repeated the analysis reported in the previous studies of the periastron passages in year 2010 (MJD 55545) and 2014 (MJD 56781; Abdo et al. 2011; Tam et al. 2011, 2015; Caliandro et al. 2015). Around the periastron time , the passage period was considered to be from to days, within which the flares (when the GeV emission was detected in a one-day timescale) occurred in a time period of 30–80 days after (see, e.g., Tam et al. 2015; Chernyakova et al. 2015; Caliandro et al. 2015). Excluding within each of the periastron passages, the remaining non-flaring time period was defined as .
2.2.1 Likelihood Analysis
We included all sources within 20 degrees centered at the position of B125963 in the Fermi LAT 4-year catalog (Acero et al., 2015) to make the source model. The spectral forms of these sources are provided in the catalog. The spectral parameters of the sources within 5 degrees from B125963 were set as free parameters, and the other parameters were fixed at their catalog values. B125963 was included in the source model as a point source with emission modeled with a power law. In addition, we considered the background Galactic and extragalactic diffuse emission in the source model with the spectral model gll_iem_v06.fits and the file iso_P8R2_SOURCE_V6_v06.txt, respectively. The normalizations of the diffuse components were set as free parameters.
Using the LAT science tools software package v10r0p5, we performed standard binned likelihood analysis to the LAT data in the 0.2 GeV band. The events below 200 MeV were not included, so as to reduce the effects of the relatively large uncertainties of the instrument response function of the LAT in the low energy range. We found photon index 0.1 and photon flux photons s-1 cm-2, with a Test Statistic (TS) value of 406 for B125963 in the periastron passages. A TS value at a given position is calculated from TS, where and are the maximum likelihood values for a model without and with an additional source respectively. It is a measurement of the fit improvement for including the source, and is approximately the square of the detection significance of the source (Abdo et al., 2010).
In addition, we also performed likelihood analysis during and . We found 0.04, photons s-1 cm-2 (with a TS value of 545) in the former, and 0.3, photons s-1 cm-2 (with a TS value of 42) in the latter. The results in are consistent with those in the previous studies (see Caliandro et al. 2015; Chernyakova et al. 2015). The flux is 5 times higher than that during , while the photon indices in the two time periods are approximately the same.
2.2.2 Spectral Analysis
We extracted the -ray spectra of B125963 during and by performing maximum likelihood analysis of the LAT data in 8 evenly divided energy bands in logarithm from 0.1–300 GeV. In the extraction, the spectral normalizations of the sources within 5 degrees from B125963 were set as free parameters, while all the other parameters of the sources were fixed at the values obtained from the above maximum likelihood analysis. We kept only spectral data points when TS greater than 4 (2 significance) and derived 95% flux upper limits otherwise.
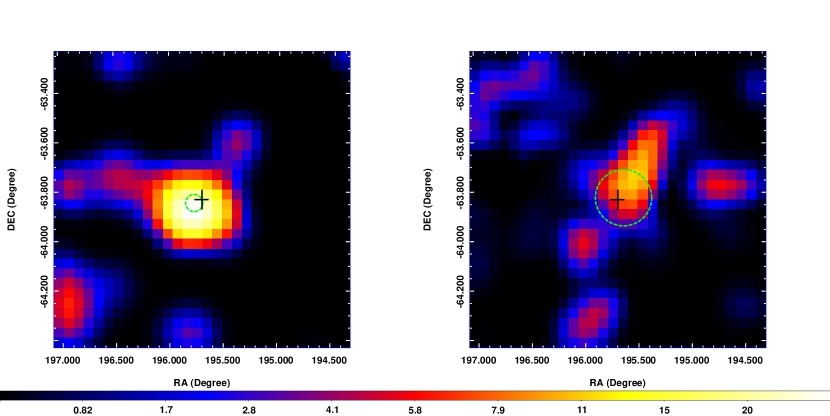
The obtained spectra are shown in Figure 1, with the flux and TS values of the spectral data points provided in Table 1. In the spectra, only emission at 0.16 and 0.45 GeV bands in was significantly detected, and a high-energy component was detected in as the TS values at 25 and 67 GeV bands are 12 and 14 respectively (see Table 1).
2.3. Analysis for the High-Energy Component
2.3.1 Likelihood Analysis
To study the properties of the high-energy component, we first performed binned likelihood analysis of the LAT data in the 5 GeV energy range. We found TS26 in , where 0.4 and 5–300 GeV photon flux photons s-1 cm-2 were obtained. We also performed the analysis of the data in the ‘quiescent’ time period , i.e., excluding the periastron passages of to days, and found TS11, where 0.4 and photons s-1 cm-2 were obtained. The results indicate and detections of the component in the two time periods. The component probably has the same power-law emission all the time, while the flux was one order of magnitude higher than that in . We tested the analysis of the data in 10 GeV or 15 GeV energy ranges. However the results were not as significant as that in 5 GeV energy range.
The 5 GeV TS maps of a region centered at B125963 during the two time periods are shown in Figure 2. No catalog sources are within the square region. The -ray emission appears to be a typical point source in the TS map, but somehow slightly extended towards the north-west direction in .
Running gtfindsrc in the LAT software package, we determined their positions. For the flaring state, the best-fit position is R.A.=19577, Decl.=6385 (equinox J2000.0), with 1 nominal uncertainty of 002. B125963 is 003 away from the position, outside of the 1 but within the 2 error circles. For the quiescent state, R.A.=19565, Decl.=6383 (equinox J2000.0), with 1 nominal uncertainty of 007. B125963 is 002 away from this best-fit position and within the 1 error circle.
2.3.2 Orbital Variability
To further constrain the presence of the high-energy component in , we performed likelihood analysis of the 5 GeV data in 10 orbital phase bins. Because of the highly eccentric orbit of B125963, we used the mean anomaly phase bins so as to have approximately similar exposures in every bin. We set the spectral normalizations of the sources within 5 degrees from B125963 as free parameters, while all the other parameters of the sources were fixed at the values obtained from the likelihood analysis of the 5 GeV data. The orbital light curve and TS curve extracted are shown in Figure 3. The phase zero was set at . Besides the data point detected in phase 0.0–0.1 that is over part of the periastron passage (each phase bin corresponds to 120 days), two data points have TS values greater than 4 in phase 0.7–0.8 and 0.8–0.9.

The binary has a long orbital period, and therefore we checked the exposure time for each bin. We binned 5 GeV events in a 03 radius circular region (the size of the LAT’s Point Spread Function at 5 GeV) centered at B125963 in 1-day time bins, and calculated the exposures of the time bins using gtexposure in the LAT software package. The obtained exposure time curve is plotted in Figure 3 as a reference. It shows that the exposures have a maximum factor of 1.6 differences. Our analysis results are not affected by the exposure differences, since the phase ranges of 0.7–0.9 do not have the highest exposure time.
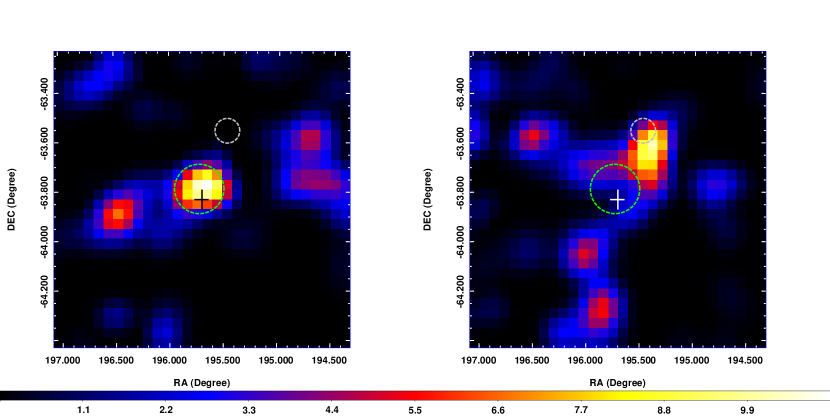
We calculated two TS maps during phase 0.7–0.9 and 0.1–0.7 to confirm the light curve result, which are shown in Figure 4. The high-energy emission during phase 0.7–0.9 was detected with TS of 11. The best-fit position is R.A.=19572, Decl.=6379 (equinox J2000.0), with 1 nominal uncertainty of 006. B125963 is 005 from the best-fit position and within the 1 error circle. During phase 0.1–0.7, TS2, indicating the non-detection of the component. However in the latter TS map, a nearby additional source was possibly revealed at the north-west of B125963 with TS10. We determined the best-fit position for the additional source and obtained R.A.=19547, Decl.=6356 (equinox J2000.0), with 1 nominal uncertainty of 003.
2.3.3 Spectral Analysis
We extracted the -ray spectrum in , which is shown in Figure 1. There was no detection of any low-energy emission ( GeV), consistent with the results from previous studies. The high-energy emission was marginally detected at 25 and 67 GeV bands (the TS values are 5; Table 1).
The origin of the nearby source found in phase 0.1–0.7 is not clear, and since it is located close to the B125963 counterpart (outside of the 2 error circle; see the right panel of Figure 2) determined in phase 0.7–0.9, there could be possible contamination due to their proximity. To check this, we performed likelihood analysis to the 5 GeV LAT data during phase 0.7–0.9 when the nearby source is not significantly present, and extracted the spectrum during the phase range. The results are consistent with those obtained for the whole quiescent time period.
3. Discussion
Having analyzed more than 7 years of Fermi LAT Pass 8 data for the B125963 region, we have verified that in addition to the low-energy -ray emission with 3, a high-energy component in 5 GeV energy range was clearly present during the flaring state. This component was only marginally detected () in the previous studies of the pulsar’s periastron passages (e.g., Tam et al. 2015; Chernyakova et al. 2015). The improvement on the detection significance is likely due to the use of Pass 8 data in our analysis. Moreover, our detailed analysis indicates that this component even existed during the quiescent state, mean anomaly phase 0.7–0.9. The brightening of the component during the flaring state, with the flux an order of magnitude larger than that during quiescence, helps confirm the weak detection () in the latter state. In addition, a nearby source, north-west to B125963, was likely revealed from our analysis. The existence of this source is probably the reason why B125963 appeared slightly extended along the north-west direction in the quiescent 5–300 GeV TS map (right panel of Figure 2).
The 5 GeV emission component during quiescence is only significant in the mean anomaly phase of 0.7–0.9, corresponding to 371 to 123 days before the periastron. Multiple X-ray observations have shown that for the phase range before the pulsar’s entrance to the circumstellar disk, fluxes were low with (Chernyakova et al., 2006). At TeV energies, the earliest HESS detection reported probably was from 104 days from the periastron (2.9 detection from a 5.3 hour livetime observation; Aharonian et al. 2009). Towards the periastron, the TeV flux gradually increased and then rose to a level of more than 10 times larger during the periastron passage (Aharonian et al., 2009; Chernyakova et al., 2014). We note that our detection of 5 GeV emission during phase 0.7–0.9 is only 3, and the Fermi exposure for phase 0.9–1.0 is the lowest (see Figure 3). Thus we suspect that the 5 GeV emission, as the low energy tail of the TeV emission, would start increasing from phase 0.7, and might become detectable in phase 0.9–1.0 in the near future when sufficient Fermi data are collected. Since the mean anomaly phase 0.7 corresponds to the true anomaly phase 0.53, the high energy component is present in most of the second half of the binary orbit.
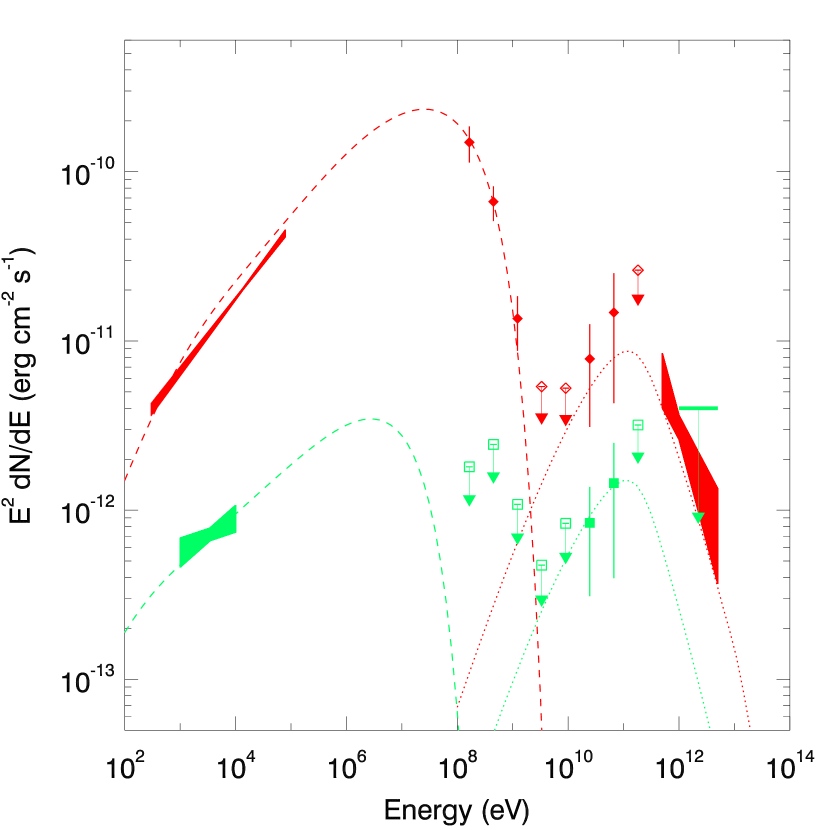
With the low-energy GeV spectrum of B125963 having , it is likely that the GeV emission is the high-energy tail of the synchrotron emission from the shocked pulsar wind, which explains the observed X-ray emission. On the other hand, the observed emission above 5 GeV is the low-energy tail of the IC process, which produces TeV emission observed at the periastron passage, of the shocked pulsar wind off the stellar photons. Based on this scenario, we fit the broadband X-rays–to–TeV spectra with the model that includes the synchrotron radiation and IC scattering process of the shocked pulsar wind. The model is based on Takata & Taam (2009). We assumed that the energy distribution of the shocked particles forms a broken power-law function at the shock, and the Lorentz factor at the break in the distribution is , below and above which we fixed the power law indices and at and (or when in ), respectively. The maximum Lorentz factor of the particles accelerated at the shock was assumed to be that from balancing between the synchrotron radiation time scale and the acceleration time scale (where ; see Takata & Taam 2009 for the details). We found that the efficient acceleration process was needed to explain the Fermi observation below 1 GeV with the synchrotron radiation process. We calculated the evolution of the particle distribution with the adiabatic loss and radiation losses of the synchrotron radiation and the IC scattering process. The orbit of B125963 is highly eccentric. Hence, we used the typical value of the separations between the pulsar and companion to fit the observed phase-averaged spectra in the two states; AU for the quiescent state and AU for the flaring state. The shock distance from the pulsar was calculated from the wind momentum ratio , which is the typical value of the momentum ratio of the pulsar wind and stellar wind/disk. The model fits to the spectra are shown in Figure 5. The spectra can generally be described by the model.
Since the detection of the orbital variability in X-ray (e.g., Chernyakova et al. 2006, 2009) and TeV (Aharonian et al., 2009) fluxes, detailed, different models (Khangulyan et al., 2007; Takata & Taam, 2009; Kong et al., 2012) have been proposed to explain the observed orbital properties. Our detection of the 5–300 GeV emission in the quiescent phase 0.7–0.9 has provided another piece of observational result to be considered in modeling. As the IC process should occur over the whole orbit, the high-energy emission is always being radiated. However in phase 0.1–0.5 when the pulsar moves towards us, the IC scattering between particles that moves toward us and stellar photons is a tail-on collision process, which significantly reduces the radiation efficiency. We suspect that this difference would probably be the reason why we do not seen the component in the first half of the orbit. In order to fully explore this possibility, detailed modeling of the processes over the orbit is warranted.
References
- Abdo et al. (2010) Abdo, A. A., Ackermann, M., Ajello, M., et al. 2010, ApJS, 188, 405
- Abdo et al. (2011) —. 2011, ApJ, 736, L11
- Acero et al. (2015) Acero, F., Ackermann, M., Ajello, M., et al. 2015, ApJS, 218, 23
- Aharonian et al. (2005) Aharonian, F., Akhperjanian, A. G., Aye, K.-M., et al. 2005, A&A, 442, 1
- Aharonian et al. (2009) Aharonian, F., Akhperjanian, A. G., Anton, G., et al. 2009, A&A, 507, 389
- Atwood et al. (2009) Atwood, W. B., Abdo, A. A., Ackermann, M., et al. 2009, ApJ, 697, 1071
- Caliandro et al. (2015) Caliandro, G. A., Cheung, C. C., Li, J., et al. 2015, ApJ, 811, 68
- Chernyakova et al. (2009) Chernyakova, M., Neronov, A., Aharonian, F., Uchiyama, Y., & Takahashi, T. 2009, MNRAS, 397, 2123
- Chernyakova et al. (2006) Chernyakova, M., Neronov, A., Lutovinov, A., Rodriguez, J., & Johnston, S. 2006, MNRAS, 367, 1201
- Chernyakova et al. (2014) Chernyakova, M., Abdo, A. A., Neronov, A., et al. 2014, MNRAS, 439, 432
- Chernyakova et al. (2015) Chernyakova, M., Neronov, A., van Soelen, B., et al. 2015, MNRAS, 454, 1358
- Dubus (2013) Dubus, G. 2013, A&A Rev., 21, 64
- H.E.S.S. Collaboration et al. (2013) H.E.S.S. Collaboration, Abramowski, A., Acero, F., et al. 2013, A&A, 551, A94
- Johnston et al. (1992) Johnston, S., Manchester, R. N., Lyne, A. G., et al. 1992, ApJ, 387, L37
- Johnston et al. (1994) Johnston, S., Manchester, R. N., Lyne, A. G., Nicastro, L., & Spyromilio, J. 1994, MNRAS, 268, 430
- Khangulyan et al. (2007) Khangulyan, D., Hnatic, S., Aharonian, F., & Bogovalov, S. 2007, MNRAS, 380, 320
- Kong et al. (2012) Kong, S. W., Cheng, K. S., & Huang, Y. F. 2012, ApJ, 753, 127
- Kong et al. (2011) Kong, S. W., Yu, Y. W., Huang, Y. F., & Cheng, K. S. 2011, MNRAS, 416, 1067
- Melatos et al. (1995) Melatos, A., Johnston, S., & Melrose, D. B. 1995, MNRAS, 275, 381
- Negueruela et al. (2011) Negueruela, I., Ribó, M., Herrero, A., et al. 2011, ApJ, 732, L11
- Shannon et al. (2014) Shannon, R. M., Johnston, S., & Manchester, R. N. 2014, MNRAS, 437, 3255
- Takata & Taam (2009) Takata, J., & Taam, R. E. 2009, ApJ, 702, 100
- Tam et al. (2011) Tam, P. H. T., Huang, R. H. H., Takata, J., et al. 2011, ApJ, 736, L10
- Tam et al. (2015) Tam, P. H. T., Li, K. L., Takata, J., et al. 2015, ApJ, 798, L26
- Tavani & Arons (1997) Tavani, M., & Arons, J. 1997, ApJ, 477, 439
| Flaring state | Periastron passage | Quiescent state | |||||
| excluding the flares | |||||||
| Band | TS | TS | TS | ||||
| (GeV) | (GeV) | (10-12 erg cm-2 s-1) | (10-12 erg cm-2 s-1) | (10-12 erg cm-2 s-1) | |||
| 0.16 | 0.1–0.3 | 149.318.9 | 637 | 39.410.0 | 93 | 1.8 | 0 |
| 0.45 | 0.3–0.7 | 66.66.9 | 267 | 19.44.0 | 44 | 2.4 | 1 |
| 1.22 | 0.7–2.0 | 13.63.4 | 25 | 7.0 | 3 | 1.1 | 1 |
| 3.32 | 2.0–5.5 | 5.4 | 1 | 3.0 | 0 | 0.5 | 0 |
| 9.03 | 5.5–14.9 | 5.3 | 1 | 2.0 | 0 | 0.8 | 0 |
| 24.58 | 14.9–40.5 | 7.84.7 | 12 | 7.0 | 2 | 0.80.5 | 5 |
| 66.86 | 40.5–110.3 | 14.710.4 | 14 | 5.4 | 0 | 1.41.0 | 5 |
| 181.89 | 110.3–300.0 | 26.2 | 0 | 15.0 | 0 | 3.2 | 0 |
Note: fluxes without uncertainties are the 95 upper limits.