A Prolonged Southward IMF-Bz Event of May 02–04, 1998: Solar, Interplanetary Causes and Geomagnetic Consequences
Abstract
A detailed investigation was carried out to understand a prolonged (44 hours) weakly southward interplanetary magnetic field (IMF-Bz) condition during May 02–04, 1998. In-situ observations, during the period, showed the passage of an expanding magnetic cloud embedded in an interplanetary coronal mass ejection (ICME), followed up by a shock and an interplanetary discontinuity driven by another ICME. It is the arrival of the ICMEs and the upfront shocks that cause the prolonged southward IMF-Bz condition. The magnetic configuration of the source regions of the IMF associated with the ICME interval were also examined, which showed open magnetic field structures, emanating from a small active region on the north of the heliospheric current sheet (HCS). The structures remained constantly to the north of the HCS, both on April 29 and May 01, suggesting no change in their polarity. The draping of these outward directed radial field lines around the propagating CMEs in the shocked plasma explained the observed polarity changes of the IMF-Bz at 1 AU. In addition, multiple enhancements were also detected in the geomagnetic field variations, which showed a distinct one-to-one correspondence with the density pulses observed at 1 AU, during 0700–1700 UT on May 03. The spectral analysis of both the variations showed the same discrete frequencies of 0.48, 0.65 and 0.75 mHz, demonstrating that the solar wind density enhancements can cause detectable global geomagnetic disturbances. The observations, thus, provide a deeper insight into the possible causes and geomagnetic consequences of a prolonged weakly southward IMF-Bz condition.
BISOI ET AL. \titlerunningheadA 44 Hour Southward IMF-Bz \authoraddrCorresponding author:Key Laboratory of Solar Activity, National Astronomical Observatories, Chinese Academy of Sciences, Beijing 100012, China. (e-mail: susanta@nao.cas.cn)
1 Introduction
Inspite of significant advances in both instrumental capabilities and theoretical simulations, our understanding of various aspects of solar wind-magnetosphere-ionosphere coupling is still far from comprehensive. Nevertheless, over the years, a consensus has been reached on the potential impact of the north-south component of the interplanetary magnetic field (IMF-Bz), which controls the amount of solar wind energy transferred into the magnetosphere through magnetic reconnection of the IMF-Bz and the terrestrial magnetic field (e.g., [Dungey (1961)]). The coupling is strongest when the IMF-Bz is southward. The solar plasma moving with a velocity, Vsw and having a frozen-in southward IMF-Bz generates a dawn-to-dusk electric field, Ey = (-Vsw Bz) (Tsurutani and Meng, 1972; Gonzalez et al., 1994; Echer et al., 2008a). The electric field is primary responsible for causing magnetic storms. It has been shown that it is the extraordinary and long duration southward IMF-Bz events (magnitudes greater than -10 nT and lasting for over 3 hours), rather than high solar wind velocity, which plays a crucial role in triggering magnetic storms (Gonzalez and Tsurutani, 1987; Tsurutani et al., 1992), and are therefore an important aspect for space weather studies.
The causes of strong and long duration southward IMF-Bz events identified to date are either of solar or interplanetary origins. Events having solar origins are primarily associated with well-defined solar eruptive phenomena such as coronal mass ejection (CME) (Klein and Burlaga, 1982; Lindsay et al., 1995), solar flares (Tang et al., 1989), filament or prominence eruptions (Tang et al., 1989), and high-speed solar wind streams (HSS) from coronal holes (CHs) (Sheeley et al., 1976). The major southward IMF-Bz events responsible for severe, and great storms are all caused by magnetic clouds within CMEs (Gosling et al., 1990; Tsurutani et al., 1992; Echer et al., 2008b). A CME is a huge eruption of coronal plasma and is classically composed of three parts (Illing and Hundhausen, 1986). This includes 1) a leading edge 2) a dark cavity 3) a bright core. The leading edge of the CME mainly comprises of coronal loops, and these have been detected at 1 AU (Tsurutani et al., 1998), while the bright core is due to the cold and dense filament material (Webb and Hundhausen, 1987) which have also been detected at 1 AU. The filament is geoeffective (Kozyra et al., 2014) while the loop is generally not (Tsurutani et al., 2014). The dark region of the CME is known as magnetic cloud (Burlaga et al., 1981; Klein and Burlaga, 1982) and can be detected at 1 AU in in-situ observations during the passage of the CME. They are usually characterized by a higher magnetic field strength than the ambient solar wind, a radial dimension of 0.25 AU at 1 AU, a smoothly rotating field direction, and low proton temperature (Tsurutani et al., 1988). More often all three components of a CME are not detected at 1 AU, and so in the interplanetary space a CME is known as interplanetary coronal mass ejection (ICME). ICMEs at 1 AU were identified by observations of counter-streaming electrons with energies 80 MeV. This suggests that the ICME (with MC) have a magnetic flux rope structure (Klein and Burlaga, 1982) with their ends anchored to the Sun. The radial fields rooted to the Sun are the “magnetic foot” regions of the ICME or the MC (Gosling et al., 1974).
Events having interplanetary origins include those with shock compressed sheath fields (Tsurutani et al., 1988; Echer et al., 2008a), driver gas magnetic fields (Tang et al., 1985; Tsurutani et al., 1988; Tang et al., 1989; Echer et al., 2008a), draped interplanetary magnetic fields (Gosling and McComas, 1987; Tsurutani et al., 1988; Echer et al., 2008a), unusual or kinky heliospheric current sheets (Tsurutani et al., 1984), and corotating interaction regions (CIRs) (Smith and Wolfe, 1976; Rosenberg and Coleman, 1980; Tsurutani et al., 1995, 2006). A small number of southward IMF-Bz events are however, caused by large amplitude variations of intermittent Alfvenic turbulence, and waves or discontinuities (Tsurutani et al., 1988, 1992). In a study of the interplanetary causes of the extreme southward IMF-Bz events responsible for major geomagnetic storms during 1978–1979, Tsurutani et al. (1988) reported that half of the southward IMF-Bz events were caused by shock compressed sheath fields, while the other half were caused by driver gas fields or magnetic clouds (MC). In a similar study during solar cycle 23, Echer et al. (2008a) also reported that intense southward IMF-Bz events were caused by MC which drove fast shocks causing 24% of the storms, sheath fields also causing 24% of the storms, and combined sheath and MC fields causing 16% of the storms. MC are thus considered to be an important source of the southward IMF-Bz events. In a recent study, Zhang and Moldwin (2014) reported a statistical study of solar sources of extreme, long duration, southward IMF-Bz events (IMF-Bz 10 nT and lasting for more than 6 hours). A majority (53%) of these events were related to MCs and 10% were related to ICME without MC signatures. For events associated with MC having shocks ahead, if there is already pre-existing southward fields upstream of the shock, then the shock arrival compresses the fields and intensifies them (Tsurutani et al., 1988, 2011). Subsequently, as these southward fields approach the MC, the field lines drape around the plasma leading to strong southward fields (Gonzalez et al., 1994), thereby, resulting in a long duration southward IMF-Bz event. It is to be noted though, that the draping of the field lines around the CME depends on the CME trajectory, the direction of the radial interplanetary magnetic field (IMF), and the position of the heliospheric current sheet separating the positive and negative field lines (Gosling and McComas, 1987; McComas et al., 1989).
Though many attempts have been made, it is not straightforward to determine the possible cause of prolonged southward IMF-Bz events, and it is certainly more difficult when the southward IMF-Bz is weak for prolonged intervals. The objective of the present paper is to investigate the cause of an extremely long duration (44 hrs), weakly southward and relatively stable IMF-Bz that gave rise to geomagnetic storm conditions during the period May 2–4, 1998. To the best of our knowledge, this is for the first time that such an unusually prolonged weakly southward IMF-Bz and its possible solar or interplanetary causes is being reported. However, there are reports of extended periods of southward IMF-Bz events, such as the weakly southward IMF-Bz for 12 hrs on February, 13–14, 2001 (Walker et al., 2006) and for 33 hrs on July 15–16, 2012 (Bagiya et al., 2014). Tanskanen et al. (2005) also reported a long southward IMF-Bz event of 31 hours while studying magnetotail response of prolonged southward IMF-Bz events lasting longer than 8 hours during November 1999 through April 2002. However, none of these papers addressed their origin.
| Indian Stations | Magnetic Latitude (ML) |
|---|---|
| Trivandrum (TRD) | 00.03∘N |
| Pondicherry (PND) | 03.07∘N |
| Visakhapatnam (VSK) | 08.56∘N |
| Alibag (ABG) | 10.36∘N |
| Nagpur (NGP) | 12.33∘N |
| Shillong (SHL) | 16.30∘N |
| Gulmarg (GUL) | 25.60∘N |
The geomagnetic response of such extreme and long duration southward IMF-Bz events are generally a magnetic storm (Tsurutani and Meng, 1972; Gonzalez and Tsurutani, 1987; Tsurutani et al., 1992) or a magnetic substorm (Tsurutani and Meng, 1972; Walker et al., 2006). However, during weakly southward IMF-Bz fields, solar wind “ram” pressure changes () become important. Variations in commonly cause sudden impulses (SI) (e.g.,Wilson and Sugiura (1961); Russell et al. (1994); Francia et al. (2001); Villante et al. (2005); Villante and Piersanti (2009)), and are generally caused by arrival of interplanetary shocks at 1 AU (Sonett and Colburn, 1965). On some occasions, pairs of sudden impulses or SI pairs, separated by a few hours, have been identified at ground stations (Rastogi et al., 2010). Also, the IP shocks (or ram pressure changes) could trigger substorms due to precursor southward IMF conditioning (Zhou and Tsurutani, 2001). So, in general it can be said that, global geomagnetic disturbances, caused by such abrupt changes in solar wind velocity, have been of interest and have been studied in great detail over the years. Besides velocity the ram pressure changes depends on solar wind density, which plays a role in ring current intensification (Chen et al., 1994; Jordanova et al., 1998; Borovsky et al., 1998; Smith et al., 1999; Wang et al., 2003). Even the ram pressure changes arising due to only high density variations could externally trigger isolated intense substorm events or supersubstorms (AE -2500 nT) during storm or non-storm conditions (Tsurutani et al., 2015). However, studies on the impact of solar wind density variations on the geomagnetic environment are sparse.
The present prolonged southward IMF-Bz event, on May 02–04, 1998, resulted in a mild storm on May 02 as well as an intense storm on May 04 (Ganushkina et al., 2005). In addition to these storms, we also found quasi-periodic geomagnetic field variations for a duration from 0700 UT–1700 UT on May 03, 1998. Corresponding to these quasiperiodic magnetic field variations, similar solar wind density variations were observed at 1 AU. So in the present investigation, based on a case study, we showed that solar wind density variations can affect geomagnetic field variations even during a long weakly southward and relatively stable IMF-Bz condition.
It has also revealed by a spectral analysis of solar wind density variations having periodic or quasi-periodic fluctuations that they exhibit discrete frequencies (Kepko et al., 2002; Kepko and Spence, 2003; Viall et al., 2009a) or wavelengths (Viall et al., 2008). These are particular frequencies or wavelengths, where the spectral analysis often shows significant power. Such frequencies have been found to be occurred at 0.7, 1.4, 2.0, 2.7 mHz in the ultra-low frequency (ULF) range. Kepko et al. (2002) and Kepko and Spence (2003) also reported such discrete frequencies in magnetospheric fields, and concluded that the ULF fluctuations in solar wind density were the driver of magnetospheric field oscillations. Later, Kepko and Spence (2003) argued that the density fluctuations instead were actually periodic density structures (PDS) formed near the solar surface, which being frozen-in the solar plasma, convect with the ambient solar wind to 1 AU. In a study of solar wind density fluctuations for 11 years during solar cycle 23, (Viall et al., 2008) reported inherent radial scale sizes of PDS occurring at wavelengths of L 73, 120, 136, and 180 Mm (for the slow wind) and L 187, 270, 400 Mm (for the fast wind). To find the sources of PDS, a series of papers, based on the study of alpha-to-proton solar wind abundance ratio (Viall et al., 2009b), and the remote observations of PDS using imaging data from Solar Terrestrial Relations Observatory (STEREO) spacecraft (Viall et al., 2010; Viall and Vourlidas, 2015), reported that they are formed in the variable coronal solar plasma around or below 2.5 R⊙, which advect with the slow solar wind to 1 AU. In the present paper, we also verified whether such discrete frequencies were present in both solar wind density and geomagnetic field variations during the period from 0700 UT–1700 UT on May 03, 1998, when we found a clear one-to-one correspondence between the two.
| 210 MM Stations | Magnetic Latitude (ML) |
|---|---|
| Kotel’nyy (KTN) | 69.64∘N |
| Tixie (TIK) | 65.67∘N |
| Chokurdakh (CHD) | 64.67∘N |
| Zyryanka (ZYK) | 59.62∘N |
| Magadan (MGD) | 53.56∘N |
| Moshiri (MSR) | 37.61∘N |
| Popov Island (PPI) | 36.62∘N |
| Onagawa (ONW) | 24.85∘N |
| Kagoshima (KAG) | 25.13∘N |
| Yamakawa (YMK) | 13.80∘N |
| Lunping (LNP) | 10.36∘N |
| Guam (GAM) | 04.57∘N |
| Muntinlupa (MUT) | 03.58∘N |
| Biak (BIK) | 12.18∘S |
| Learmonth (LMT) | 34.15∘S |
| Canberra (CAN) | 45.98∘S |
| Katanning (KAT) | 46.03∘S |
1.1 Tracking of Solar Wind Events at 1 AU to its Solar Source Region
Using in-situ measurements, solar wind flows can be traced back, from the Earth’s orbit (at 1 AU) to a solar source surface at 2.5 R⊙, where R⊙ is solar radius. Further, using measurements of photospheric magnetic fields and potential field computations the flows can be mapped back to the Sun. Many examples exist of such studies, some of which are listed here. In order to study quadrupole distortions of the heliospheric current sheet, from May 1976 to May 1977, Bruno et al. (1982, 1984) successfully used the solar wind trace-back method in conjunction with a potential field model. In early 1995, using data obtained from the Ulysses and Wind spacecraft, Neugebauer et al. (1998) traced back solar-wind structures to the source surface at 2.5 R⊙ and then mapped them back to the photosphere. In an attempt to link outflows from an equatorial coronal hole and solar wind observed at 1 AU, McIntosh et al. (2011) used space based data from the Advanced Composition Explorer (ACE) to trace the solar wind back to the source surface using potential field source surface (PFSS) models. To identify the source regions of gradual solar energetic particle (SEP) events at 1 AU, Ko et al. (2013) first used solar wind speed measurements to map the Sun-L1 interplanetary magnetic field lines back to its source regions on the Sun at the time of SEP observations, and compared the characteristics of the SEP events to the identified sources of IMF.
The velocity traceback technique though, is applicable only to steady state solar wind flows, however, it has also been successfully used even when the solar wind flow were highly non-radial (e.g. Balasubramanian et al. (2003); Janardhan et al. (2005, 2008a, 2008b)) during the well known “solar wind disappearance event” of May 11, 1999. To identify the solar source locations of the disappearance event, the authors traced back solar wind flows to the source surface at 2.5 R⊙, and using potential field computations (Hakamada and Kojima, 1999) mapped them back to the photosphere. From their study of the disappearance event of May 11, 1999, Janardhan et al. (2005) reported the maximum trace back errors to be 30∘.
In this paper, we also used the two-step trace back method to locate the footpoints or the source region of the IMF associated with the prolonged IMF-Bz event. In the first step, we traced back the field lines, using in-situ measurements of solar wind speed from the ACE spacecraft at 1 AU, to the source surface at 2.5 R⊙. Following this, in the second step, using potential field computations (Hakamada and Kojima, 1999) to synoptic maps, we traced the field lines from the source surface back to the photosphere, and investigated the background magnetic field conditions on the Sun during our period of interest.
It is important to note that generally in such potential field models, the coronal magnetic field below the source surface is assumed to be quasi-stationary, while it is considered to be open beyond the source surface. Also, it is to be noted that the tracing of the source region and magnetic field lines, using a Carrington synoptic magnetogram has to be carefully treated at the two ends of a magnetogram. The magnetic field at this region changes faster than the normal level, which can lead to variations in the tracing process and the extrapolations of the magnetic field lines (Huang et al., 2014). However, for our May 2–4, 1998 event, the Carrington longitude was close to the center of the magnetogram, so the boundary effect would not be significant.
2 Presentation of Data
For IMF and solar wind observations at 1 AU, we have used data available in the public domain from http://cdaweb.gsfc.nasa.gov/cgi-bin/eval2.cgi. For interplanetary plasma and IMF data such as solar wind proton velocity and the strength of IMF we have used data obtained from the ACE spacecraft (Stone et al., 1998). Ground based measurements of solar wind velocities in the inner heliosphere, using radio observations of interplanetary scintillation at 327 MHz (Kojima and Kakinuma, 1990) were also utilized. For studying the photospheric magnetic field distribution, synoptic magnetograms, made using data from the Michelson-Doppler-Interferometer (MDI: Scherrer et al. (1995)) instrument onboard the Solar and Heliospheric Observatory (SOHO: (Domingo et al., 1995)), were used. Measurements of ground magnetic deviations were obtained from both Indian stations and the 210∘ magnetic meridian (210 MM) network (Yumoto and CPMN Group, 2001). The seven Indian and seventeen 210 MM stations used have been shown in Tables 1 and 2. The Indian stations are mainly located at low-latitudes, while the 210 MM network of stations are located at latitudes starting from low though mid and on to high latitudes. Of these seventeen stations, thirteen are located in the Northern hemisphere, while four are in the Southern hemisphere.
2.1 Interplanetary Scintillation Observations
Interplanetary Scintillation (IPS), typically observed at meter wavelengths, is a diffraction phenomenon in which coherent electromagnetic radiation from a distant radio source passes through the turbulent, refracting solar wind and suffers scattering, thereby resulting in random temporal variations of the signal intensity (scintillation) at the Earth. A schematic illustration of the typical IPS observing geometry can be seen in Bisoi et al. (2014a). IPS is an efficient, cost-effective method of studying the large scale structure of the solar wind at meter wavelengths, over a wide range of heliocentric distances, ranging from about 0.2 AU to 0.8 AU at 327 MHz (Hewish et al., 1964; Janardhan and Alurkar, 1993; Ananthakrishnan et al., 1995; Janardhan et al., 1996; Moran et al., 2000; Bisoi et al., 2014a). Intensity variations from point-like extragalactic radio sources, during IPS observations, actually provide remote-sensing information about rms electron density fluctuations, , along the lines-of-sight to the observed radio sources (Bisoi et al., 2014a). In fact, IPS is so sensitive to changes in that it has even been used to study the fine-scale structure in cometary ion tails during radio source occultations by cometary tail plasma (Janardhan et al., 1991, 1992; Iju et al., 2015). IPS data were obtained from the Institute for Space-Earth Environmental Research (ISEE), Nagoya University, Nagoya, Japan and using a tomographic technique, IPS observations from ISEE, Japan were used to produce synoptic velocity maps (Kojima et al., 1998) which were then projected back to a fixed heliocentric distance, viz. the source surface, at 2.5 R⊙. Such synoptic velocity maps represent the large-scale structure of the solar wind in the inner heliosphere.
3 A Prolonged Southward IMF-Bz Event
Fig.1 presents solar wind conditions at 1 AU (measurements of solar wind magnetic field and plasma) of an event on day of 1.5 – 4.5 on May, 1998, and the state of magnetospheric response associated with the event. The topmost panel of Fig.1 shows the southward component of interplanetary magnetic field (Bz). An unusually prolonged southward IMF-Bz lasting for a period of 44 hours, from 0920 UT on May 02 to 0520 UT on May 04, is clearly evident as shown by the solid red line in the uppermost panel of Fig.1. To identify the cause of such a prolonged southward IMF-Bz condition, we first studied the interplanetary (IP) disturbances associated with the event through solar wind parameters such as magnitude of magnetic field (B), proton velocity (Vp), proton density (Np) and proton temperature (Tp) as shown from the top second to the fifth panel of Fig.1, respectively.
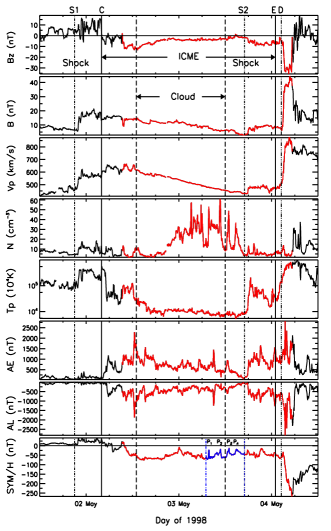
A forward shock was identified at 2123 UT on May 01 as indicated by a vertical dash-dotted line (S1). The arrival of the shock increased the proton density (20 cm-3), velocity (600 kms-1), and temperature (1010K) as well as magnetic field intensity (20 nT). Prior to the shock, the magnitude of IMF was high (10 nT), and the IMF-Bz was 0 nT 6 hours before and +7 nT just 30 min before. The solar wind plasma preconditions were as follows: B was 10 nT, Vp was 300 kms-1, and Np was 10 cm-3. Post shock, the IMF-Bz showed rapid fluctuations, and the average IMF-Bz was northward having +10 nT. However, the field actually turned first southward (Bz was -8 nT) from the northward direction (Bz was 10 nT) at 0300 UT on May 02 upon arrival of an ICME at 1 AU, marked by a vertical solid line (C). The arrival of ICME at 1 AU has been characterized by jumps in Vp, Np and Tp, and a decrease in B. However, until 0920 UT, the southward field was not stable, and showed a second southward turning only at 0920 UT on May 02. Thereafter, the IMF-Bz was constantly southward and relatively stable for the next 24 hours.
The solar wind plasma during the prolonged period of weakly southward IMF-Bz condition showed constant high magnetic field intensity than the ambient field and continuous low proton temperature. These are typical signatures of the presence of a driver gas plasma or magnetic cloud (MC). The passage of the MC (Malandraki et al., 2002) is indicated by vertical dashed lines in Fig.2. Malandraki et al. (2002) reported two prompt electron events as detected by ACE spacecraft during the passage of ICME, one when the CME leading edge arrives at 1 AU and the other when the front of MC passes at 1 AU. The monotonic decreases in both magnetic field and proton speed suggest that the ICME was expanding. Since the MC was traveling for around 24 hours with an approximately speed of 500 kms-1, it suggests that the radial dimension of the MC was 0.28 AU, which is the typical radial width of a MC as mentioned earlier. Also, a high density plasma parcel (30-60 cm-3) was located between 1800 UT on May 02 and 1700 UT on May 03, for about 24 hours. The density parcel, in fact, showed periodic/quasi-periodic density variations. The He++/H+ ratio (though not shown here) had also shown significantly increased values, as high as 80% (Skoug et al., 1999).
A second forward shock was identified at 1700 UT on May 03, indicated by a vertical dash-dotted line (S2). The arrival of shock showed a small jumps in Vp, Np, Tp, and B compressing the already pre-existing southward fields and intensifying them further. Prior to the shock, the solar wind plasma preconditions were as follows: B was 0 nT, Vp was 300 km, and Np was 8-10 cm-3. The IMF-Bz was 0 nT just 2 hours before. The shock was propagating back of the first ICME, and was associated with a second ICME arriving later (Malandraki et al., 2002). The end of ICME interval (E), shown by a vertical solid line, was observed with a decrease in Tp. Just prior to the end of ICME, when the southward field was slowly turning northward, a strong interplanetary discontinuity was identified, indicated by a vertical long dash-dotted line (D). Post-discontinuity, the solar wind showed high jumps in Vp, Np, Tp, and B, however, these variations occurred over an extended period suggesting that it was not a shock. The discontinuity compressed the weak pre-existing southward fields and intensifying them further (Bz decreases from -5 nT to -32 nT). The variations in solar wind plasma composition and properties during May 02-04, 1998 have been very well studied and reported by other researchers (e.g., Gloeckler et al. (1999); Skoug et al. (1999); Chen and Fritz (1999, 2001); Bamert et al. (2002); Malandraki et al. (2002); Posch et al. (2003); Ganushkina et al. (2005)).
3.1 Orientation of the Magnetic Fields
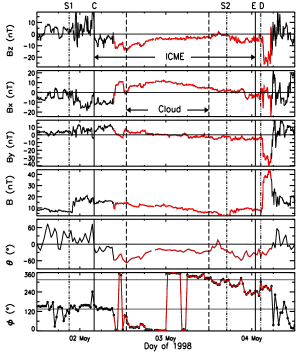
Fig.2 shows, from top to bottom, the magnetic field components (Bz, Bx, By) in Geocentric Solar Ecliptic (GSE) coordinates, the magnitude of magnetic field (B), and the direction of magnetic field ( and ). In the GSE coordinate system, the X axis points from the Earth to the Sun, the Z axis is normal to the ecliptic, and the Y axis forms a right hand coordinate system. The angle is the angle of the magnetic field out of the ecliptic plane, while the angle is the angle that the magnetic field makes with the X-axis in the XY plane. Before the passage of the MC, the magnetic field showed rapid fluctuations, while it was very smooth during its passage, as indicated by the low variance in the magnitude of magnetic field. From Fig.2, it is clear that the Bx component remained positive during MC traversal, while the Bz component was negative. However, the By component showed a change from positive to negative, indicating the usual directional changes noticed during the MC traversal. The typical Parker’s spiral configuration of the IMF has values of or , which corresponds to the positive or the negative IMF, respectively, shown by the horizontal lines in the bottommost panel of Fig.2. The value usually denotes the position of the ecliptic north pole. It is seen from Fig.2 that was negative during the whole event. The IMF turned southward (negative ), upon the arrival of the ICME, and continued to be thereafter southward until May 04. The angle was around from 00 UT to 08 UT on May 02, indicating a steady state configuration with a positive IMF. The first crossing of the IMF was noticed just prior to the MC and on it’s arrival, the IMF became non-steady for a while. The second crossing of the IMF was seen early on May 03, from positive to negative, corresponding to the directional changes in the By component. Thereafter, the angle was continued to be around until 1700 UT on May 03, indicating a steady negative IMF configuration, which again became non-steady upon the arrival of the shocks driven by the second ICME from 1700 UT on May 03 to early on May 04.

3.2 Geomagnetic Consequences
The magnetospheric response corresponding to the unusually prolonged southward IMF-Bz condition on May 02–04 has been shown in the bottom three panels of Fig.1, which show ground measurements of the auroral electrojet index (AE), the westward electrojet index (AL) and the symmetric ring current index (SYM-H), respectively. On arrival of the first forward shock, S1, a sudden increase in SYM/H index ( 25 nT), i.e., a positive sudden impulse (SI), was observed. However, only a very small increase in AE and AL indices was noticed. The arrival of the ICME, that caused the first southward turning of the IMF-Bz field and the reverse shock, initiated a depression in SYM-H index early on May 02 at 0400 UT. So the arrival of forward and reverse shocks caused, respectively, a positive and a negative SI, as shown in the study by Rastogi et al. (2010). The AE and AL indices, respectively, showed increases up to 1000 nT and -800 nT indicating onset of a moderate substorm activity. A moderate storm (SYM-H -80 nT) actually began on the second southward turning of the IMF-Bz when the southward IMF-Bz field intensified (Bz -10 nT) further. Correspondingly, AE and AL indices showed much higher values, indicating the progression of a substorm activity. At about 1300 UT on May 02, their amplitudes had values greater than -1500 nT, indicating an intense substorm activity in progress. Besides, the southward pre-conditioning, the solar wind plasma density was found to be higher (10-15 cm-3), coincident with the substorm event. The increased solar wind density could have externally triggered the intense substorm activity.
Thereafter, on weakening of the southward field, the storm entered into the recovery phase as indicated by the slow increase in SYM-H index. The passage of a high density plasma parcel early on May 02 further caused a depression in SYM/H index. In fact, multiple enhancements in SYM-H index were identified, shown by the blue solid line and demarcated by the vertical blue dash-dotted lines in the bottommost panel of Fig.1, from 0700 UT–1700 UT on May 03, during the steady weakly southward IMF-Bz condition. The multiple peaks in SYM-H occurred at 0725 UT, 1010 UT, 1210 UT, and 1430 UT and were referred to in the rest of the paper as P1, P2, P3, and P4, respectively. During this steady weakly southward IMF-Bz condition, we found fair amount of constant changes in both AE and AL indices indicating a fair substorm activity. The arrival of the second forward shock again caused sharp increases in AE and AL indices that led to the onset of a moderate substorm activity. Subsequently, the arrival of the IP discontinuity caused a strong intensification of the southward IMF fields, and resulted in an intense geomagnetic storm that began early on May 04. Correspondingly, the SYM-H index showed a strong positive SI followed by a strong depression in its strength ( -250 nT). Also, we found substantial enhancements in AE index ( 2500 nT) as well as in AL index ( -2500 nT) that led to a large substorm expansion.
It is thus clear that during the prolonged southward IMF-Bz condition of May 02–04, a constant geomagnetic activity with the values of SYM-H -50 nT and a fairly constant substorm activity with the values of AE 500 nT was observed prior to the onset of the great storm on May 04. The storms during May 02–04 have been very well studied (Chen and Fritz, 1999, 2001; Bamert et al., 2002; Posch et al., 2003; Ganushkina et al., 2005). However, the multiple enhancements noticed in SYM-H, during the prolonged quasi-stable southward IMF-Bz condition on May 03, are unique and are being reported for the first time. We discuss them in detail in the following section.

4 Multiple Pulses in the Geomagnetic Field Variations
As mentioned earlier, as a geomagnetic response to the quasi-stable southward IMF-Bz condition during May 03, 1998, we identified the occurrence of multiple enhancements in the Earth’s magnetic field as seen by the multiple pulses in SYM-H index during 0700 UT–1700 UT on May 03. Starting from the top and going down, the panels of Figure 3 show respectively, the IMF-Bz, the component of solar wind velocity in the X-direction (VX), the Y-component of the interplanetary electric field (IEFy), the solar wind dynamic pressure (Pdyn), the solar wind proton density (N), the SYM-H index, the AE index, and the AL index for the period 0700 UT–1700 UT on May 03. The multiple pulses are numbered from P1 through P4, and have also been shown in the lowermost panel of Fig.1.
Corresponding to the multiple peaks in SYM-H, we identified multiple enhancements in solar wind dynamic pressure and solar wind density, indicated by the dashed vertical lines in Fig.3. These density variations are specifically of interest, as there were no significant variations observed in the IMF-Bz, solar wind velocity, and the IEFy except for the corresponding deviations in the SYM-H. We also didn’t see much variation in both AE and AL indices corresponding to the peaks in the SYM-H field. It is important to note that the surface magnetic deviations in the SYM-H have a distinct one-to-one correspondence both in time and profile with that of the solar wind density pulses. Since the SYM-H field represents the mean variation of the H field at all mid-latitude ground stations, the observed deviations showed that the event is a global one. Further, we have taken care to verify that the SYM-H pulses are global by examining records of the change in the horizontal component of geomagnetic field (H) from ground-based magnetograms obtained from Indian magnetic observatories as well as from the 210 MM magnetic stations.
4.1 Geomagnetic Field Variations at Indian and 210 MM Stations
Fig.4 shows the H variations, from 0700–1700 UT on May 03, 1998, for seven Indian stations (left panel) and seventeen stations of 210 MM network (right panel) with the magnetic latitude (ML) of each ground station indicated at the right of each curve. The magnetic latitudes of Indian and 210 MM network stations shown in Fig.4 have already been listed in Tables 1 and 2. It is evident from Fig.4 that the H variations from 0700–1700 UT for both the Indian (left hand panels of Fig.4) as well as the 210 MM stations (right hand panels of Fig.4), had shown increases corresponding to the pulses P1, P2, P3, and P4. Only for the case of pulse P3, as already noticed from the variation of the AE and AL indices shown in Fig.3, we found signatures of positive and negative bays (e.g., (Russell et al., 1994)) on inspection of the H variations of 210 MM stations. The H variations at the Indian and the 210 MM stations are synchronous at all latitudes, and have been marked by the vertical dashed lines in each panel of Fig.4. It is to be noted that these deviations in the H field, as stated earlier, have clearly shown a one-to-one correspondence with the episodic enhancements in the solar wind density as shown in Fig.3.
4.2 Discrete Frequencies of Density and Geomagnetic Field Fluctuations
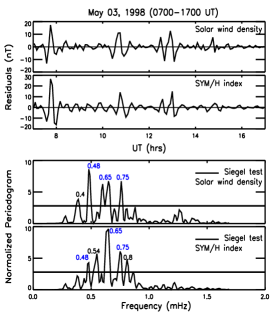
It is evident from Fig.3 that, during the period from 0700–1700 UT on May 03, 1998, the solar wind density changes and geomagnetic field variations were quite similar. The same also can be clearly seen from their residuals, as shown in the top two panels of Fig.5. Though the existence of quasi-periodic variations is clear from the residuals of density and SYM-H index, however, it is difficult to pinpoint the discrete frequencies at which they occurred. We, thus, subjected the residuals of solar wind density and geomagnetic field variations to a Lomb–Scargle Fourier transform (Lomb, 1976; Scargle, 1982, 1989)) to find the discrete peaks.
The bottom two panels of Fig.5 show the Lomb-Scargle normalized periodograms of solar wind density and SYM-H field obtained for the period from 0700–1700 UT on May 03. The significant frequency components were determined using the Siegel test statistics (Siegel, 1980; Bisoi et al., 2014b). The black horizontal lines in the bottom two panels of Fig.5 are drawn at the critical level determined by the Siegel test. From Fig.5, it is clear that the density and geomagnetic field pulsations have peaks near frequencies, f = 0.48, 0.65, and 0.75 mHz, or periods, T = 35, 26, and 22 min. The frequency peaks reported here belong to the long period or ULF oscillations. In addition, to the common frequencies, the density data also exhibit a peak near f = 0.4 mHz, while the SYM-H field show peaks near f = 0.54 and 0.8 mHz. As discussed earlier, the periodic density variations are actually PDS that are present in the solar wind. The PDS are formed near the solar surface, and convect with the ambient solar wind to 1 AU. Based on this fact, we computed the length-scales of the PDS, using the method followed by Kepko and Spence (2003) and Viall et al. (2008), defined as the wavelength, L = /f, where is the solar wind velocity and f is the observed discrete frequency. The radial scale sizes of the density structures were thus found to be occurred at L = 600, 704, 756, 947, and 1160 Mm.
5 Solar Sources of the Event
5.1 Flare and CME Observations
From the end of April to the beginning of May, 1998, several flares/CMEs erupted on the Sun (Thompson et al., 2000). A “halo” CME was captured by Extreme Ultraviolet Imaging Telescope (EIT) on board SOHO on April 29 at 1600 UT, and by Large Angle and Spectrometric Coronagraph (LASCO; Brueckner et al. (1995)) instrument on board SOHO on April 29 at 1658 UT (Bamert et al., 2002; Malandraki et al., 2002). Just prior to the eruption of the CME, a M-class flare (M6.8) erupted at 1606 UT on April 29. It has been reported that though the flare and filament eruption occurred in the southeast (S17E16) of the disk center from an active region AR 8210, the CME moved across the equator and appeared in the northeast limb (Wang et al., 2000). The shock driven by the CME on April 29 reached at 1 AU at 2123 UT on May 01, while the leading edge of the CME arrived at 0300 UT on May 02 (Malandraki et al., 2002). A X-class flare and another fast halo CME were, respectively, detected in SOHO/EIT at 1340 UT and in LASCO/C2 at 1406 UT on May 02. The flare and CME were produced in the southwest (S15 W15) from AR 8210 (Thompson et al., 2000), however, the CME moved across the equator and appeared in the northwest limb as seen from LASCO/C2 images (Wang et al., 2002). The shock driven by the second CME traveled along the back of the first CME, and arrived at 1 AU at 1700 UT on May 03.
6 In-situ Magnetic Field and Remote-sensed IPS Observations
A study of the observation of bidirectional electron events from the Electron, Proton, Alpha Monitor on board ACE (ACE/EPAM) (Malandraki et al., 2002) has reported that the magnetic field lines at 1 AU during the ICME traversal were magnetically anchored to the Sun. To verify the background IMF-conditions associated with the event, we traced back in-situ measurements of solar wind speed (and the associated IMF) from the ACE spacecraft at 1 AU to the source surface at 2.5 R⊙, assuming constant velocities and radial expansion along the Parker’s spirals. The arrival of CMEs, in the present case, could have actually caused deviations in the Parker’s spiral resulting in the highly non-radial flows (Owens and Cargill, 2004). However, we could still use the trace back method considering the fact that the source regions of flows (and the IMF) determined would be within reasonable errors. We verified (though not shown here) from the deviations of the solar wind flow velocities estimated using in-situ measurements of ACE spacecraft that the flows during May 02–04 were largely radial. They only became highly non-radial right after the arrival of the second CME on May 04. Also, the value of remained around 135∘ or 315∘, as shown in the bottommost panel of Fig.2, indicating a steady state IMF configuration.
The heliographic latitude and longitude of the source regions of the IMF at 2.5 R⊙ were first obtained by transforming the available positions of ACE spacecraft at a particular time from the GSE coordinates to Carrington coordinates. The heliographic latitude at the source surface is generally same as that of the heliographic latitude of the ACE spacecraft. However, the heliographic longitude at the source surface was obtained by adding an offset to the heliographic longitude of ACE at 1 AU (Huang et al., 2014). The offset was determined by estimating the longitude through which the Sun had rotated during the solar wind propagation time from the source surface to 1 AU using the velocity trace back method.
The topmost panel of Fig.6 shows ACE measurements of proton velocities traced back to the source surface at 2.5 R⊙ as a function of heliographic longitude. The red dashed vertical lines, marked at the heliographic longitudes of 128∘ and 158∘, indicates the day of year (DOY) 119.72–121.98 (1716 UT, Apr 29–May 01, 2331 UT) corresponding to the trace back locations of the solar wind velocities (or the associated IMF) at 1 AU, during our period of interest from the DOY 122.39–124.22 (0920 UT, May 02–0520 UT, May 04).
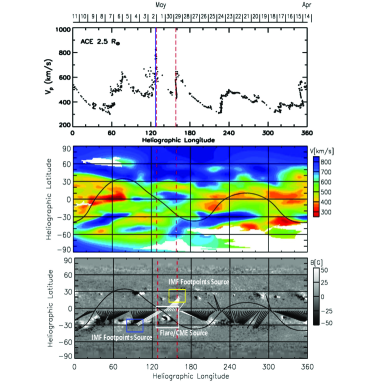
The heliographic latitude of the traced back velocities/IMF at the start and the end of the period of interest was found to be -4∘ and -5∘, respectively. The blue vertical solid line indicates the trace back locations of the IMF corresponding to the onset of a SI prior to a strong geomagnetic storm on May 04. Dates of Central Meridian Passage (CMP) are indicated at the top of the uppermost panel of Fig.6. From the topmost panel of Fig.6, it is clear that during this period the proton velocity showed a steady increase from 400 km to 820 km without much fluctuations, indicating the increase in velocity could be due to the eruption of CME on April 29.
The middle panel of Fig.6 shows a tomographic synoptic velocity map for CR 1935. The velocity map was obtained using IPS observations from the ISEE, Japan and represent solar wind velocities projected on to the source surface at 2.5 R⊙. The white regions on the map indicate data gaps while the color bar on the right shows the velocity of solar wind flow. The curved black line on the map is the source surface magnetic neutral line (MNL). It is clear from the middle panel of Fig.6 that the solar wind flow, in the trace-back region, was largely dominated by velocity flows between 500–600 km . Also, a high-velocity flow was observed north of the equator which is probably an extension of the high velocity flows from the high-latitude polar coronal holes.
The lowermost panel of Fig.6 shows a synoptic magnetogram during CR1935, from the MDI instrument on board the SOHO spacecraft. The black and white patches represent regions of strong magnetic fields, corresponding to active region locations that distinguish the two opposite magnetic polarities. The curved black line on the map is the source surface MNL, while the two dashed vertical parallel lines bracket the trace back locations. A large active region is seen to be located to the south of the neutral line in the trace back period, which has been identified as the source of the flare and CME that erupted on April 29 and May 02, 1998 (Thompson et al., 2000). The converging black lines on the synoptic magnetogram join magnetic fields at the source surface to the photosphere. The magnetic fields were computed using a potential field model by Hakamada and Kojima (1999), and they lie in an equally spaced grid along the equator, while their radially back-projected photospheric foot points lie in tightly bunched regions associated with active regions north and south of the equator. These footpoints were the source regions of the open magnetic field lines connected from the Sun to 1 AU at the time of event. The lines in white mark the field lines corresponding to the period with CMP dates from April 29–May 01, 1998. It is important to note that the converging field lines shown in white in the lowermost panel of Fig.6 were found to be associated with active regions both north and south of the equator. The locations of the footpoints on the photosphere are shown inside the rectangular boxes in yellow and blue, while the source region of the flare and CME are shown inside a rectangular box in white. The magnetic field strength within the pixel areas around the first IMF footpoint location has been found to be weaker, while the field strength around the second IMF footpoint location has been found to be stronger. It is evident from the middle panel of Fig.6 that the region of traced field lines to the north of the equator was dominated by large median velocity flows of approximately 600–800 km.
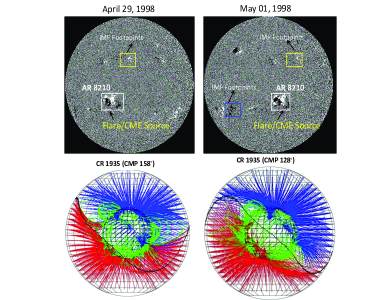
6.1 Active Region Locations
The upper two panels of Fig.7 show the location of active regions on the sun on April 29, 1998 (upper left) and May 01, 1998 (upper right). The active region AR 8210, was the source region of the flare/CME that erupted on April 29, is shown inside a large rectangular box in white in the top left panel. The active region is located close to the central meridian at a longitude of 16∘E to the south of the equator on April 29. The footpoint of the IMF, at the start of the traced back interval, on April 29 is associated with a small active region shown inside a small rectangular box in yellow in the top left panel. This active region is located in close proximity to the central meridian on April 29. The top right panel of Fig.7 shows the positions of the active regions on May 01. The location of the IMF footpoint, at the end of the traced back interval, on May 01 is associated with the active region on the south of the equator, shown in a small rectangular box in blue.
The lower two panels of Fig.7 show the three-dimensional structure of the computed coronal magnetic fields on April 29, 1998 (lower left panel) and May 01, 1998 (lower right panel) respectively, as viewed from a Carrington longitude of 158∘ (left) and 128∘ (right) corresponding to the start and the end of the traced back interval. The coronal magnetic fields can’t be measured directly, and so were computed using photospheric magnetic fields as inputs to potential field extrapolations (Hakamada and Kojima, 1999). The magnetic field lines from the potential field computations fan out from tightly bunched regions associated with active regions north and south of the equator with the blue and red lines denoting the outward (positive) and inward (negative) open fields, respectively. The green lines denote closed field lines, while the solid black line is the MNL. Only fields between 5 G and 250 G on the photosphere have been plotted in order not to clutter the figure, and the open field lines at 2.5 R⊙ are plotted in steps of 5∘ in longitude and latitude. From Fig.7 (lower panels) it is evident that apart from the polar coronal hole regions showing the open field lines, the other open field lines were associated with the small active region north to the equator, which is the source region of the IMF footpoints of the prolonged southward IMF-Bz interval, as shown inside the small rectangular box in yellow in the top left panel. It is important to note that the open field lines associated with the region were found to be positive and remained constantly north of the MNL both on April 29 and May 01. This implies that the large-scale open field structures associated with the region didn’t change their polarity and remained radial beyond the source surface for most of the time during the trace back period corresponding to the prolonged southward IMF event.
It can be seen from Fig.7 (lower right panel) that the MNL shifted towards the north-west on May 01. The open magnetic field structures directed inward were found to the south of the MNL associated with a bunch of closed magnetic field lines and loops. As mentioned earlier, they were the footpoint locations of the traced back IMF at the end of the prolonged southward IMF interval, shown inside a small rectangular box in blue in the top right part, associated with an active region on the southeast of the solar disk center.
7 Discussion
Our analysis of the north-south component of interplanetary magnetic field at 1 AU during geomagnetic storm conditions in the period May 02–04, 1998 showed a nearly 44 hour long or unusually prolonged weakly southward IMF-Bz in the time interval from 0920 UT, May 02, 1998 to 0520 UT, May 04, 1998. This is for the first time that such an unusually long duration southward IMF-Bz event has been reported.
7.1 Interplanetary Sources
From in-situ measurements, at 1 AU, of solar wind plasma and magnetic field, it is evident that the prolonged IMF-Bz event was associated with an ICME identified from May 02, 0500 UT–May 04, 0100 UT. The ICME was actually the counterpart of a large “halo” CME that erupted on April 29, 1998 at 1658 UT (Thompson et al., 2000; Malandraki et al., 2002). Prior to the CME eruption, a M6.8 flare erupted at 1606 UT. The shock driven by the flare and CME led to the forward shock at 2123 UT on May 01 and the reverse shock at 0300 UT on May 02, respectively. The arrival of the forward shock caused the compression of the upstream plasma and led to the fluctuations in the IMF components. Subsequently, the draping of the field lines around the CME in the shocked plasma produced the northward IMF-Bz fields. The arrival of the ICME, marked by a reverse shock, resulted in an out-of-ecliptic IMF component, that led to the first southward turning of the IMF-Bz. In a study of the outward propagation of the flare-associated CME, Hoeksema and Zhao (1992) reported the preferential existence of the southward IMF-Bz component at 1 AU. It is, thus, the arrival of the ICME at 1 AU, driven by the flare-associated CME of April 29, that led to the first southward turning of the IMF-Bz observed at 0920 UT on May 02.
The ICME interval at 1 AU contained a well-defined MC observed from 1300 UT, May 02 to 1200 UT, May 03, for over 24 hours. Given such long hours of traversal of MC, we estimated the radial width of the MC and found it to be nearly 0.28 AU. Also, in-situ observation of the monotonic decreases in the solar wind speed and the magnitude of the magnetic field shows that the MC was expanding in the IP space. As mentioned earlier, it has been reported by Malandraki et al. (2002) that the magnetic field lines during the ICME passage were anchored to the Sun. Also, as discussed above, the fields were already southward, prior to the MC, due to the arrival of the ICME. Thus, as the MC approached, the southward field lines draped around the MC and led them to be further southward and intense (Gonzalez et al., 1994). Since the source region of the CME that erupted on April 29 was in the south of the disk center, the internal field of the CME/MC should have a southward directed field (McComas et al., 1989). It is known that most MCs while propagating through the IP space don’t change their polarity (Marubashi, 1986), so the southward directed internal field could result in a southward IMF component at 1 AU. Earlier observations (Zhao and Hoeksema, 1998; Zhang and Moldwin, 2014) have also reported that the most southward IMF-Bz events are associated with ICME having MC signatures. It is, thus, expected that the prolonged weakly southward magnetic fields, for nearly 24 hours, during May 03, was a result of the expanding large MC associated with the ICME passage. Also, the long duration of MC can be studied by comparing the magnetic flux geometry of the MC at the location of the encounter with the spacecraft, obtained using the magnetic flux rope models (Burlaga, 1988; Marubashi, 2000; Marubashi and Lepping, 2007; Marubashi et al., 2015), to the observed magnetic field variations at 1 AU.
The arrival of a second forward shock and an IP discontinuity at 1 AU (Skoug et al., 1999), driven by a second flare-associated CME erupted on May 02, 1406 UT (Skoug et al., 1999; Malandraki et al., 2002), compressed the pre-existing southward IMF-Bz component (Tsurutani et al., 1988; Gonzalez et al., 1994). This, in turn, resulted in a strong southward IMF-Bz as noticed on May 04, 0200 UT.
7.2 Solar Sources
Two flare-associated CMEs erupted, respectively, on April 29 and May 02. The source region of both of the CMEs was a large active region AR 8210 (Thompson et al., 2000). We tracked source regions of the solar wind flows associated with the event, using the trace back technique of constant velocities along Archimedean spirals, back to the solar source surface at 2.5 R⊙. The source locations of solar wind flows, corresponding to the start and the end of the IMF interval, were identified to the south of the equator and between the heliographic longitudes of 128∘ and 158∘. From observations of solar wind velocity from ISEE/IPS observatory and the photospheric magnetic fields from SOHO/MDI, we were able to show that the traced back flows were associated with an active region AR 8210 at a longitude of 16∘S. It is to be noted that the active region is the source region of the flares/CMEs erupted on April 29 and May 02. A positive SI was observed at the end of the present long duration southward IMF event. This was caused due to a shock driven by a second faster CME, which erupted on May 02, and arrived at the back of the first CME just prior to the end of the first ICME interval. The arrival of the second shock just before the end of the first ICME raised the question whether the eruption of the second CME had destroyed the magnetic configuration of the field lines during the trace back period, and whether information of the background IMF conditions on the solar surface was destroyed. From our analysis, however, we showed that the eruption of CME took place right after our trace back period indicating that the source regions of the IMF determined by the velocity trace back technique would be valid (Ko et al., 2013). It is also to be noted that the active region AR 8210 remained south of the magnetic neutral line (MNL) during the whole trace back period indicating no change in the IMF configuration.
Using the field-line tracing of the computed coronal magnetic fields from the solar surface to the photosphere, we were able to locate the footpoints of the IMF source region at the start of the prolonged southward IMF-Bz event at 1 AU to a small unnamed active region on April 29, lying close to the central meridian and to the north of the equator. The footpoints of the IMF source regions at the end of the prolonged southward IMF-Bz event at 1 AU were found to be associated with a region in the close-proximity of an active region, located to the south of the equator. The magnetic field lines during the passage of the ICME were anchored to the Sun, thus, the footpoints of the traced back IMF were actually the foot regions of the ICME observed at 1 AU. Further, the potential field computations of source surface magnetic fields on April 29 and May 01 showed open magnetic field structures with positive polarity emanating from this unnamed active region. The open field lines, which remained constantly to the north of the heliospheric current sheet both on April 29 and May 01, clearly suggest no change in their polarity during the trace back period, from April 29–May 01. It is also known from observations that, depending on the hemisphere, the open magnetic field lines spiral either inward or outward, and the configuration changes, generally, either during periodic solar polar reversals occurring at the maximum of each solar cycle (Janardhan et al., 2005, 2008a, 2008b) or due to the wake of CME eruption (Ko et al., 2013). However, the polarity reversal of solar cycle 23 occurred in CR 1949 while our event was during CR1935. Also, the second CME was erupted on May 02, after our trace back period and after the first CME which erupted on April 29. From our observations, it is evident that the sudden change in proton velocity (due to the eruption of the CME on April 29) was seen before or around the same period when the IMF-Bz at 1 AU became southward. Therefore, no change in magnetic field configuration can be expected. It is noticed however, from our field-line tracing that the IMF showed a change, towards the end of the southward IMF-Bz interval, in their footpoint locations from the north to the south. Also, the potential field computations of source surface magnetic fields on May 01 showed open magnetic field lines with negative polarity emanating close to the southeast active region. This is consistent with observation of the IMF crossing at 1 AU (change in the value of from positive to negative as shown in Fig.2) during the ICME passage.
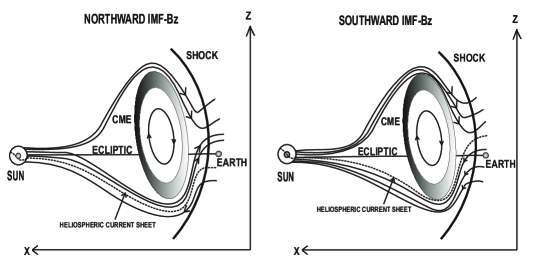
Fig.8 shows a schematic of the draping of the field lines around the CME plasma. As mentioned earlier, the first CME, erupted on April 29, was propagating northward (Wang et al., 2000), so the center of the CME would be to the north of the ecliptic. Also, the IMF field lines were directed away from the Sun (outward), while the HCS was to the south of the equator. Such a condition with the CME propagating to the north of the ecliptic and with the field lines radially outward has been shown in the left panel of Fig.8. It can be seen from Fig.8 that the draping of the field lines around the CME, in the shocked plasma, has resulted in northward IMF-Bz fields (Gosling and McComas, 1987; McComas et al., 1989). This is consistent with the observed northward IMF-Bz fields noticed after the post-shock early on May 02. The CME internal field, which was southward directed, resulted in the southward IMF-Bz fields at 1 AU. The second CME, erupted on May 02, was also propagating to the north (Wang et al., 2002), so the center of the CME would be to the north of the ecliptic. The IMF field lines, as mentioned earlier, on the north were still radially outward, while the IMF field lines on the south were radially inward. As mentioned earlier, the HCS moved to the northwest, but was still to the south of the equator. The right panel of Fig.8 presents such a condition, where the CME was propagating to the north of the ecliptic and the field lines were radially inward, which resulted in southward IMF-Bz fields due to the draping of the sunward field lines around the CME/MC. The southward fields when approached the MC within the CME having southward directed internal fields would be intensified further. In fact, strong southward IMF-Bz fields were observed towards the end of the interval. Assuming the CME moved radially outward from the Sun, the IMF fields originally anchored to the Sun southward (northward) of the CME source location would still be traced back to the Sun southward (northward) of the CME (McComas et al., 1989). It is to be noted that the CMEs of April 29 and May 02, erupted from the same active region, AR 8210, which was located to the south of the disk center. Thus, when we tracked down the radial IMF fields at the start and the end of the interval, the IMF footpoints were located to the north and the south of the equator, respectively, as expected.
It is, thus, clear that the passage of the ICMEs in the interplanetary medium played a crucial role that led to the unusually prolonged southward IMF-Bz condition. The open field lines from the northern active region, which were anchored to the Sun and remained constantly radially outward during the whole interval, explained the observed polarity changes of the IMF-Bz fields within the shocked plasma.
7.3 Geomagnetic Activity
The IMF-Bz remaining southward for prolonged hours during May 02–04 led to a moderate storm and a strong storm, respectively, early on May 02 and early on May 04. In between the storms during the weakly prolonged quasi-stable IMF-Bz condition (Bz -5nT) on May 03, we also found multiple peaks in the SYM-H with corresponding enhancements in the solar wind dynamic pressure (and solar wind density) between 0700 UT and 1700 UT on May 03, 1998. These pulses are unique in a sense that both the IMF-Bz and solar wind velocity barely showed any variation. Thus, any significant change in the ground level magnetic fields could be attributed to the solar wind pressure variations (or density variations). The multiple peaks identified both at low-latitude Indian stations and 210 MM network of stations during the above period provided a clear evidence that these enhancements were global in nature. Since perturbations in SYM-H index, usually represent mean variations in the symmetric ring current (the westward symmetric electric current that flows along the geomagnetic equator), it is clear that the prolonged weakly southward IMF-Bz preconditions on May 02-04, 1998 developed a quasi-stable ring current, promoted by solar wind-magnetosphere coupling for a long period.
In the presence of the strong southward IMF-Bz for long intervals, the solar wind flux has been continuously loaded to the magnetosphere/magnetotail causing a magnetospheric convection on the nightside. This, in turn, leads to transport and acceleration of particles from the magnetotail and the plasmasheet towards the Earth’s inner magnetosphere (Kamide et al., 1998; Daglis et al., 1999) forming the storm-time ring current. In the present study, early on May 02, when the southward IMF-Bz was relatively stronger, the ring current was intensified, as seen by the relative depression in SYM-H index, due to the enhanced convection. Early on May 03 while the southward IMF-Bz was relatively weaker, it is not expected to form a ring current. Under these weak IMF-Bz conditions, the density variations in the solar wind can be a driver for the ring current (Chen et al., 1994; Jordanova et al., 1998; Borovsky et al., 1998; Smith et al., 1999; Wang et al., 2003). The plasma sheet density in the near-Earth plasma sheet regions, which is well correlated to the density in the solar wind (Terasawa et al., 1997; Borovsky et al., 1997, 1998), supplies the energy and form the ring current (Thomsen et al., 1998; Kozyra et al., 1998; Liemohn et al., 1999). In the present case, the increases in the solar wind density, from 10–60 cm-3 early on May 03, when the IMF-Bz was weak but still southward, perhaps led to increased number of particles entering the magnetosphere. This, in turn, increased the energy accumulated in the magnetotail and plasmasheet, even when the energy injection began to decline due to the saturated magnetospheric convection. Subsequently, the solar wind dynamic pressure enhancements, corresponding to density variations during 0700–1700 UT on May 03, formed a quasi-stable ring current. We believe that the multiple peaks in the SYM-H index were manifestations of the multiple peaks developed in the quasi-stable ring current. Our study, thus, indicates that Pdyn variations owing to density changes might play an important role in the development of ring current during the quasi-steady prolonged southward IMF-Bz condition. In a similar study, Araki et al. (1993) showed the effect of the solar wind dynamic pressure, caused by solar wind density variations, on the geomagnetic field through study of changes in the Dst index. The study (Tanskanen et al., 2005) of the solar wind pre-conditions during the different magnetotail phenomena corresponding to the prolonged southward IMF-Bz intervals reported that the magnetospheric convection is more likely when the mean southward IMF-Bz is -5 nT, while loading and unloading is more likely when IMF-Bz is -5 nT. In the present study, we found that the southward IMF-Bz was -5 nT during the weakly southward IMF-Bz condition on May 03. It indicates an occurrence of a night side steady magnetospheric convection during the period which, thus, led to the development of a quasi-stable ring current owing to the density variations.
Also, our periodogram analysis suggested the presence of the discrete frequencies in the solar wind density variations, during 0700–1700 UT, May 03, near f = 0.48, 0.65, and 0.75 mHz, or T = 35, 26, and 22 min. It is known from earlier observations (Kepko et al. (2002); Kepko and Spence (2003); Viall et al. (2009a)) that such long period and sub-mHz ULF frequencies oscillations have been existed in magnetospheric fields. Confirming the fact, we also found the similar discrete frequencies in the ground magnetic fields or the symmetric ring current strength (SYM-H fields). The frequencies obtained here in solar wind density variations are in agreement with those reported by Viall et al. (2009a). Also, the estimation of their radial length scales showed that the associated PDS of the density variations have significant power at wavelengths, L = 600, 704, 756, 947, and 1160 Mm. The observed length scales of the PDS estimated here are larger in sizes than those reported by Viall et al. (2008). Our spectral analysis results fit well into the global picture that shows that the ULF oscillations of the solar wind density variations act as the drivers of the magnetospheric field oscillations. The density variations could be attributed to the significantly increased values of the He++/H+ ratio (Skoug et al., 1999) observed at 1 AU, between 1800 UT on May 02 and 1700 UT on May 03, though the origin of the density pulses is need to be investigated. The origin of the associated PDS with the density variations has been well studied (Viall et al., 2009b, 2010; Viall and Vourlidas, 2015), which revealed that these can be due to variations in the solar coronal plasma, which convect with the ambient solar wind from the Sun to 1 AU. The increased He++/H+ ratio at 1 AU, during the prolonged southward IMF-Bz interval, indicates that the PDS could be of the solar origin, which convected with the solar wind during the outward propagation of the CME from the Sun to 1 AU (Viall et al., 2009b). The details of those, however, requires a separate further study and will be investigated in a future work.
It is generally understood that the Earth’s magnetotail during such long hours of the southward IMF-Bz intervals respond in different manners such as isolated loading and unloading, periodic loading and unloading, and steady magnetospheric convection (Tanskanen et al. (2005) and references therein). A series of substorms, known as periodic substorms, can occur when the southward IMF-Bz is southward for several hours (Huang, 2002; Huang et al., 2003a, b). Since the magnetosphere is open for long hours during these IMF-Bz conditions, solar wind variations can make their way into the magnetosphere, and subsequently to the ground causing disturbances at low and mid-latitudes with periods of nearly 2–3 hours. These substorms are usually associated with periodic loading and unloading of plasma particle fluxes and are commonly referred to as saw tooth events (Henderson, 2004). They, in turn, can contribute to disturbances recorded at ground magnetic stations. Thus, one of the possible reasons for the occurrence of the multiple pulses on May 03, 1998 may be due to the substorm activity. So it is important to delineate the multiple processes occurring together. We have taken care to verify the energetic proton fluxes from all the available Los Alamos National Laboratory (LANL) spacecraft to see if there were any periodic injections of fluxes. However, except for the pulse P3, we didn’t find such flux injections corresponding to the onset of pulses P1, P2, and P4, rejecting the possibility of any periodic substorms during that period.
Besides the precursor southward IMF of more than 10 hours, typical signatures of magnetospheric/magnetotail preconditioning were found prior to the onset of the storm on May 04 such as a SI, constant values of SYM-H with -50 nT, and a fairly constant substorm activity with the values of AE between 500 and 1000 nT. The great storms reported by (Tsurutani et al., 1992) also reported similar magnetospheric/magnetotail pre-conditioning with Dst -50 nT and AE 500 nT prior to the onset of the great magnetic storm. However, a careful inspection of the AE and AL indices, in the present study, with AE -2500 nT showed that they were not supersubstorms as discussed in Tsurutani et al. (2015).
8 Summary and Conclusion
The present work is important as it is for the first time such a prolonged weakly southward IMF-Bz of nearly 44 hours has been reported and the cause of this has been addressed in detail by investigating both the interplanetary and solar sources. The interplanetary plasma and magnetic field measurements at 1 AU showed the passage of two ICMEs during the event. The shocks and the magnetic cloud driven by the first ICME led to the observed southward IMF-Bz during May 02–04. The sharp southward IMF-Bz near the end of the event was due to the second ICME and its upstream shock. Investigation of the solar sources indicated that the first ICME was due to a fast halo CME which erupted on April 29 and the second ICME was due to a fast halo CME erupted on May 02. It is to be noted that both the CMEs erupted from the same active region AR 8210.
Also, we were able to locate the source region of the solar wind flows and the associated IMF during the event to the solar surface at 2.5 R⊙, located in close proximity of the active region AR 8210. The field-line tracing of the IMF, from the source surface to the photosphere, showed that the footpoints of the IMF during the event were associated with a small active region on the north and an active region on the south. Examination of their corresponding magnetic configuration showed open magnetic field structures emanating from the northern active region. These open field lines were directed away from the Sun and didn’t change their direction during the whole trace back period of April 29–May 01, corresponding to the event at 1 AU. The draping of these constantly radial outward field lines, during the prolonged southward IMF-Bz interval, around the CME/MC at 1 AU, explained the observed polarity changes of the IMF-Bz within the shocked plasma.
Additionally, we also investigated multiple global disturbances of the geomagnetic fields from 0700–1700 UT on May 03 to understand the underlying cause. It was shown that the multiple density enhancements in the solar wind, within a period of only 10 hours, could develop quasi-stable ring currents. This, in turn, could lead to the multiple surface magnetic field deviations, without the contribution from either the solar wind velocity or the IMF-Bz. Further, the spectral analysis of solar wind density and geomagnetic field variations showed the presence of the common discrete frequencies at 0.48, 0.65, and 0.75 mHz confirming the solar wind density variations as the driver of the global geomagnetic disturbances. The work, thus, presents an observational link of solar surface phenomena with that of worldwide magnetic response during an unusually prolonged southward IMF-Bz condition.
Acknowledgements.
The authors thank King, J.H. and Papatashvilli, N. of Adnet Systems, NASA, GSFC, the CDAWeb team, the ACE instrument team, the ACE Science Center, the MDI consortia for making data available in the public domain via the World Wide Web. SOHO is a project of international collaboration between ESA and NASA. IPS observations were carried out under the solar wind program of ISEE, Nagoya University, Japan. For IMF and solar wind data used can be obtained from http://cdaweb.gsfc.nasa.gov/cgi-bin/eval2.cgi. ACE and MDI/SOHO data are available in the public domain (http://www.srl.caltech.edu/ACE/ASC/level2/index.html and http://sohodata.nascom.nasa.gov/cgi-bin/data_query). Other data are available from the authors upon request such as for IPS solar wind velocity (fujiki@stelab.nagoya-u.ac.jp), Indian magnetograms used in the present paper (susanta@nao.cas.cn) and 210 MM magnetograms (yoshi@geo.kyushu-u.ac.jp). SKB acknowledges the support by the Chinese Academy of Sciences International Talent Scheme, Project Number: 2015PM066 (Funded by CHINESE ACADEMY OF SCIENCES PRESIDENT’S INTERNATIONAL FELLOWSHIP INITIATIVE). Yihua Yan is supported by NSFC Grant: 11433006. The work by A.Y. was supported by MEXT/JSPS KAKENHI Grant Number 15H05815. One of the authors, JP, would like to thank Prof. U.R. Rao for useful suggestions that have improved the paper. The authors also thank the reviewers for their constructive comments and suggestions that have significantly improved the paper.References
- Ananthakrishnan et al. (1995) Ananthakrishnan, S., V. Balasubramanian, and P. Janardhan (1995), Latitudinal Variation of Solar Wind Velocity, Space Sci. Rev., 72, 229–232, 10.1007/BF00768784.
- Araki et al. (1993) Araki, T., K. Funato, T. Iguchi, and T. Kamei (1993), Direct detection of solar wind dynamic pressure effect on ground geomagnetic field, Geophys. Res. Lett., 20, 775–778, 10.1029/93GL00852.
- Bagiya et al. (2014) Bagiya, M. S., R. Hazarika, F. I. Laskar, S. Sunda, S. Gurubaran, D. Chakrabarty, P. K. Bhuyan, R. Sridharan, B. Veenadhari, and D. Pallamraju (2014), Effects of prolonged southward interplanetary magnetic field on low-latitude ionospheric electron density, Journal of Geophysical Research (Space Physics), 119, 5764–5776, 10.1002/2014JA020156.
- Balasubramanian et al. (2003) Balasubramanian, V., P. Janardhan, S. Srinivasan, and S. Ananthakrishnan (2003), Interplanetary scintillation observations of the solar wind disappearance event of May 1999, Journal of Geophysical Research (Space Physics), 108, 1121–+, 10.1029/2002JA009516.
- Bamert et al. (2002) Bamert, K., R. F. Wimmer-Schweingruber, R. Kallenbach, M. Hilchenbach, B. Klecker, A. Bogdanov, and P. Wurz (2002), Origin of the May 1998 suprathermal particles: Solar and Heliospheric Observatory/Charge, Element, and Isotope Analysis System/(Highly) Suprathermal Time of Flight results, Journal of Geophysical Research (Space Physics), 107, 1130, 10.1029/2001JA900173.
- Bisoi et al. (2014a) Bisoi, S. K., P. Janardhan, M. Ingale, P. Subramanian, S. Ananthakrishnan, M. Tokumaru, and K. Fujiki (2014a), A Study of Density Modulation Index in the Inner Heliospheric Solar Wind during Solar Cycle 23, Astrophys. J., 795, 69, 10.1088/0004-637X/795/1/69.
- Bisoi et al. (2014b) Bisoi, S. K., P. Janardhan, D. Chakrabarty, S. Ananthakrishnan, and A. Divekar (2014b), Changes in Quasi-periodic Variations of Solar Photospheric Fields: Precursor to the Deep Solar Minimum in Cycle 23?, Sol. Phys., 289, 41–61, 10.1007/s11207-013-0335-3.
- Borovsky et al. (1997) Borovsky, J. E., M. F. Thomsen, and D. J. McComas (1997), The superdense plasma sheet: Plasmaspheric origin, solar wind origin, or ionospheric origin?, Journal of Geophysical Research (Space Physics), 102, 22,089–22,106, 10.1029/96JA02469.
- Borovsky et al. (1998) Borovsky, J. E., M. F. Thomsen, and R. C. Elphic (1998), The driving of the plasma sheet by the solar wind, Journal of Geophysical Research (Space Physics), 103, 17,617–17,640, 10.1029/97JA02986.
- Brueckner et al. (1995) Brueckner, G. E., R. A. Howard, M. J. Koomen, C. M. Korendyke, D. J. Michels, J. D. Moses, D. G. Socker, K. P. Dere, P. L. Lamy, A. Llebaria, M. V. Bout, R. Schwenn, G. M. Simnett, D. K. Bedford, and C. J. Eyles (1995), The Large Angle Spectroscopic Coronagraph (LASCO), Sol. Phys., 162, 357–402, 10.1007/BF00733434.
- Bruno et al. (1982) Bruno, R., L. F. Burlaga, and A. J. Hundhausen (1982), Quadrupole distortions of the heliospheric current sheet in 1976 and 1977, Journal of Geophysical Research (Space Physics), 87, 10,339–10,346, 10.1029/JA087iA12p10339.
- Bruno et al. (1984) Bruno, R., L. F. Burlaga, and A. J. Hundhausen (1984), K-coronameter observations and potential field model comparison in 1976 and 1977, Journal of Geophysical Research (Space Physics), 89, 5381–5385, 10.1029/JA089iA07p05381.
- Burlaga et al. (1981) Burlaga, L., E. Sittler, F. Mariani, and R. Schwenn (1981), Magnetic loop behind an interplanetary shock - Voyager, Helios, and IMP 8 observations, Journal of Geophysical Research (Space Physics), 86, 6673–6684, 10.1029/JA086iA08p06673.
- Burlaga (1988) Burlaga, L. F. (1988), Magnetic clouds and force-free fields with constant alpha, Journal of Geophysical Research (Space Physics), 93, 7217–7224, 10.1029/JA093iA07p07217.
- Chen and Fritz (1999) Chen, J., and T. A. Fritz (1999), May 4, 1998 storm: Observations of energetic ion composition by POLAR, Geophys. Res. Lett., 26, 2921–2924, 10.1029/1999GL003582.
- Chen and Fritz (2001) Chen, J., and T. A. Fritz (2001), Features of energetic ions near the compressed magnetosphere, Journal of Atmospheric and Solar-Terrestrial Physics, 63, 463–472, 10.1016/S1364-6826(00)00173-5.
- Chen et al. (1994) Chen, M. W., L. R. Lyons, and M. Schulz (1994), Simulations of phase space distributions of storm time proton ring current, Journal of Geophysical Research (Space Physics), 99, 5745–5759, 10.1029/93JA02771.
- Daglis et al. (1999) Daglis, I. A., R. M. Thorne, W. Baumjohann, and S. Orsini (1999), The terrestrial ring current: Origin, formation, and decay, Reviews of Geophysics, 37, 407–438, 10.1029/1999RG900009.
- Domingo et al. (1995) Domingo, V., B. Fleck, and A. I. Poland (1995), The SOHO Mission: an Overview, Sol. Phys., 162, 1–2, 10.1007/BF00733425.
- Dungey (1961) Dungey, J. W. (1961), Interplanetary Magnetic Field and the Auroral Zones, Physical Review Letters, 6, 47–48, 10.1103/PhysRevLett.6.47.
- Echer et al. (2008a) Echer, E., W. D. Gonzalez, B. T. Tsurutani, and A. L. C. Gonzalez (2008a), Interplanetary conditions causing intense geomagnetic storms (Dst ¡ -100 nT) during solar cycle 23 (1996-2006), Journal of Geophysical Research (Space Physics), 113, A05221, 10.1029/2007JA012744.
- Echer et al. (2008b) Echer, E., W. D. Gonzalez, and B. T. Tsurutani (2008b), Interplanetary conditions leading to superintense geomagnetic storms (Dst ¡ -250 nT) during solar cycle 23, Geophys. Res. Lett., 35, L06S03, 10.1029/2007GL031755.
- Francia et al. (2001) Francia, P., S. Lepidi, P. D. Giuseppe, and U. Villante (2001), Geomagnetic sudden impulses at low latitude during northward interplanetary magnetic field conditions, Journal of Geophysical Research (Space Physics), 106, 21,231–21,236, 10.1029/2000JA900136.
- Ganushkina et al. (2005) Ganushkina, N. Y., T. I. Pulkkinen, and T. Fritz (2005), Role of substorm-associated impulsive electric fields in the ring current development during storms, Annales Geophysicae, 23, 579–591, 10.5194/angeo-23-579-2005.
- Gloeckler et al. (1999) Gloeckler, G., L. A. Fisk, S. Hefti, N. A. Schwadron, T. H. Zurbuchen, F. M. Ipavich, J. Geiss, P. Bochsler, and R. F. Wimmer-Schweingruber (1999), Unusual composition of the solar wind in the 2-3 May 1998 CME observed with SWICS on ACE, Geophys. Res. Lett., 26, 157–160, 10.1029/1998GL900166.
- Gonzalez and Tsurutani (1987) Gonzalez, W. D., and B. T. Tsurutani (1987), Criteria of interplanetary parameters causing intense magnetic storms (Dst of less than -100 nT), Planet. Space Sci., 35, 1101–1109, 10.1016/0032-0633(87)90015-8.
- Gonzalez et al. (1994) Gonzalez, W. D., J. A. Joselyn, Y. Kamide, H. W. Kroehl, G. Rostoker, B. T. Tsurutani, and V. M. Vasyliunas (1994), What is a geomagnetic storm?, Journal of Geophysical Research (Space Physics), 99, 5771–5792, 10.1029/93JA02867.
- Gosling and McComas (1987) Gosling, J. T., and D. J. McComas (1987), Field line draping about fast coronal mass ejecta - A source of strong out-of-the-ecliptic interplanetary magnetic fields, Geophys. Res. Lett., 14, 355–358, 10.1029/GL014i004p00355.
- Gosling et al. (1974) Gosling, J. T., E. Hildner, R. M. MacQueen, R. H. Munro, A. I. Poland, and C. L. Ross (1974), Mass ejections from the sun - A view from SKYLAB, Journal of Geophysical Research (Space Physics), 79, 4581–4587, 10.1029/JA079i031p04581.
- Gosling et al. (1990) Gosling, J. T., S. J. Bame, D. J. McComas, and J. L. Phillips (1990), Coronal mass ejections and large geomagnetic storms, Geophys. Res. Lett., 17, 901–904, 10.1029/GL017i007p00901.
- Hakamada and Kojima (1999) Hakamada, K., and M. Kojima (1999), Solar Wind Speed and Expansion Rate of the Coronal Magnetic Field during Carrington Rotation 1909, Sol. Phys., 187, 115–122, 10.1023/A:1005183914772.
- Henderson (2004) Henderson, M. G. (2004), The May 2-3, 1986 CDAW-9C interval: A sawtooth event, Geophys. Res. Lett., 31, L11804, 10.1029/2004GL019941.
- Hewish et al. (1964) Hewish, A., P. F. Scott, and D. Wills (1964), Interplanetary Scintillation of Small Diameter Radio Sources, Nature, 203, 1214–1217, 10.1038/2031214a0.
- Hoeksema and Zhao (1992) Hoeksema, J. T., and X. Zhao (1992), Prediction of magnetic orientation in driver gas associated -Bz events, Journal of Geophysical Research (Space Physics), 97, 3151–3157, 10.1029/91JA02702.
- Huang et al. (2014) Huang, C., Y. Yan, G. Li, Y. Deng, and B. Tan (2014), Tracking Back the Solar Wind to Its Photospheric Footpoints from Wind Observations - A Statistical Study, Sol. Phys., 289, 3109–3119, 10.1007/s11207-014-0508-8.
- Huang (2002) Huang, C.-S. (2002), Evidence of periodic (2-3 hour) near-tail magnetic reconnection and plasmoid formation: Geotail observations, Geophys. Res. Lett., 29, 2189, 10.1029/2002GL016162.
- Huang et al. (2003a) Huang, C.-S., G. D. Reeves, J. E. Borovsky, R. M. Skoug, Z. Y. Pu, and G. Le (2003a), Periodic magnetospheric substorms and their relationship with solar wind variations, Journal of Geophysical Research (Space Physics), 108, 1255, 10.1029/2002JA009704.
- Huang et al. (2003b) Huang, C.-S., J. C. Foster, G. D. Reeves, G. Le, H. U. Frey, C. J. Pollock, and J.-M. Jahn (2003b), Periodic magnetospheric substorms: Multiple space-based and ground-based instrumental observations, Journal of Geophysical Research (Space Physics), 108, 1411, 10.1029/2003JA009992.
- Iju et al. (2015) Iju, T., S. Abe, M. Tokumaru, and K. Fujiki (2015), Plasma distribution of Comet ISON (C/2012 S1) observed using the radio scintillation method, Icarus, 252, 301–310, 10.1016/j.icarus.2015.02.007.
- Illing and Hundhausen (1986) Illing, R. M. E., and A. J. Hundhausen (1986), Disruption of a coronal streamer by an eruptive prominence and coronal mass ejection, Journal of Geophysical Research (Space Physics), 91, 10,951–10,960, 10.1029/JA091iA10p10951.
- Janardhan and Alurkar (1993) Janardhan, P., and S. K. Alurkar (1993), Angular source size measurements and interstellar scattering at 103 MHz using interplanetary scintillation, Astron. & Astrophys., 269, 119–127.
- Janardhan et al. (1991) Janardhan, P., S. K. Alurkar, A. D. Bobra, and O. B. Slee (1991), Enhanced Radio Source Scintillation due to Comet Austin 1989C1, Australian Journal of Physics, 44, 565–+.
- Janardhan et al. (1992) Janardhan, P., S. K. Alurkar, A. D. Bobra, O. B. Slee, and D. Waldron (1992), Power spectral analysis of enhanced scintillation of quasar 3C459 due to Comet Halley, Australian Journal of Physics, 45, 115–126.
- Janardhan et al. (1996) Janardhan, P., V. Balasubramanian, S. Ananthakrishnan, M. Dryer, A. Bhatnagar, and P. S. McIntosh (1996), Travelling Interplanetary Disturbances Detected Using Interplanetary Scintillation at 327 MHz, Sol. Phys., 166, 379–401, 10.1007/BF00149405.
- Janardhan et al. (2005) Janardhan, P., K. Fujiki, M. Kojima, M. Tokumaru, and K. Hakamada (2005), Resolving the enigmatic solar wind disappearance event of 11 May 1999, Journal of Geophysical Research (Space Physics), 110, 8101–+, 10.1029/2004JA010535.
- Janardhan et al. (2008a) Janardhan, P., K. Fujiki, H. S. Sawant, M. Kojima, K. Hakamada, and R. Krishnan (2008a), Source regions of solar wind disappearance events, Journal of Geophysical Research (Space Physics), 113, 3102–+, 10.1029/2007JA012608.
- Janardhan et al. (2008b) Janardhan, P., D. Tripathi, and H. E. Mason (2008b), The solar wind disappearance event of 11 May 1999: source region evolution, Astron. & Astrophys. Lett., 488, L1–L4, 10.1051/0004-6361:200809667.
- Jordanova et al. (1998) Jordanova, V. K., C. J. Farrugia, L. Janoo, J. M. Quinn, R. B. Torbert, K. W. Ogilvie, R. P. Lepping, J. T. Steinberg, D. J. McComas, and R. D. Belian (1998), October 1995 magnetic cloud and accompanying storm activity: Ring current evolution, Journal of Geophysical Research (Space Physics), 103, 79–92, 10.1029/97JA02367.
- Kamide et al. (1998) Kamide, Y., W. Baumjohann, I. A. Daglis, W. D. Gonzalez, M. Grande, J. A. Joselyn, R. L. McPherron, J. L. Phillips, E. G. D. Reeves, G. Rostoker, A. S. Sharma, H. J. Singer, B. T. Tsurutani, and V. M. Vasyliunas (1998), Current understanding of magnetic storms: Storm-substorm relationships, Journal of Geophysical Research (Space Physics), 103, 17,705–17,728, 10.1029/98JA01426.
- Kepko and Spence (2003) Kepko, L., and H. E. Spence (2003), Observations of discrete, global magnetospheric oscillations directly driven by solar wind density variations, Journal of Geophysical Research (Space Physics), 108, 1257, 10.1029/2002JA009676.
- Kepko et al. (2002) Kepko, L., H. E. Spence, and H. J. Singer (2002), ULF waves in the solar wind as direct drivers of magnetospheric pulsations, Geophys. Res. Lett., 29, 1197, 10.1029/2001GL014405.
- Klein and Burlaga (1982) Klein, L. W., and L. F. Burlaga (1982), Interplanetary magnetic clouds at 1 AU, Journal of Geophysical Research (Space Physics), 87, 613–624, 10.1029/JA087iA02p00613.
- Ko et al. (2013) Ko, Y.-K., A. J. Tylka, C. K. Ng, Y.-M. Wang, and W. F. Dietrich (2013), Source Regions of the Interplanetary Magnetic Field and Variability in Heavy-ion Elemental Composition in Gradual Solar Energetic Particle Events, Astrophys. J., 776, 92, 10.1088/0004-637X/776/2/92.
- Kojima and Kakinuma (1990) Kojima, M., and T. Kakinuma (1990), Solar cycle dependence of global distribution of solar wind speed, Space Sci. Rev., 53, 173–222, 10.1007/BF00212754.
- Kojima et al. (1998) Kojima, M., M. Tokumaru, H. Watanabe, A. Yokobe, K. Asai, B. V. Jackson, and P. L. Hick (1998), Heliospheric tomography using interplanetary scintillation observations 2. Latitude and heliocentric distance dependence of solar wind structure at 0.1-1 AU, Journal of Geophysical Research (Space Physics), 103, 1981–1990, 10.1029/97JA02162.
- Kozyra et al. (1998) Kozyra, J. U., V. K. Jordanova, J. E. Borovsky, M. F. Thomsen, D. J. Knipp, D. S. Evans, D. J. McComas, and T. E. Cayton (1998), Effects of a high-density plasma sheet on ring current development during the November 2-6, 1993, magnetic storm, Journal of Geophysical Research (Space Physics), 103, 26,285–26,306, 10.1029/98JA01964.
- Kozyra et al. (2014) Kozyra, J. U., M. W. Liemohn, C. Cattell, D. De Zeeuw, C. P. Escoubet, D. S. Evans, X. Fang, M.-C. Fok, H. U. Frey, W. D. Gonzalez, M. Hairston, R. Heelis, G. Lu, W. B. Manchester, S. Mende, L. J. Paxton, L. Rastaetter, A. Ridley, M. Sandanger, F. Soraas, T. Sotirelis, M. W. Thomsen, B. T. Tsurutani, and O. Verkhoglyadova (2014), Solar filament impact on 21 January 2005: Geospace consequences, Journal of Geophysical Research (Space Physics), 119, 5401–5448, 10.1002/2013JA019748.
- Liemohn et al. (1999) Liemohn, M. W., J. U. Kozyra, V. K. Jordanova, G. V. Khazanov, M. F. Thomsen, and T. E. Cayton (1999), Analysis of early phase ring current recovery mechanisms during geomagnetic storms, Geophys. Res. Lett., 26, 2845–2848, 10.1029/1999GL900611.
- Lindsay et al. (1995) Lindsay, G. M., C. T. Russell, and J. G. Luhmann (1995), Coronal mass ejection and stream interaction region characteristics and their potential geomagnetic effectiveness, Journal of Geophysical Research (Space Physics), 100, 16,999–17,014, 10.1029/95JA00525.
- Lomb (1976) Lomb, N. R. (1976), Least-squares frequency analysis of unequally spaced data, Astrophys. Space Sci., 39, 447–462, 10.1007/BF00648343.
- Malandraki et al. (2002) Malandraki, O. E., E. T. Sarris, L. J. Lanzerotti, P. Trochoutsos, G. Tsiropoula, and M. Pick (2002), Solar energetic particles inside a coronal mass ejection event observed with the ACE spacecraft, Journal of Atmospheric and Solar-Terrestrial Physics, 64, 517–525, 10.1016/S1364-6826(02)00008-1.
- Marubashi (1986) Marubashi, K. (1986), Structure of the interplanetary magnetic clouds and their solar origins, Advances in Space Research, 6, 335–338, 10.1016/0273-1177(86)90172-9.
- Marubashi (2000) Marubashi, K. (2000), Physics of Interplanetary Magnetic Flux Ropes: Toward Prediction of Geomagnetic Storms, Advances in Space Research, 26, 55–66, 10.1016/S0273-1177(99)01026-1.
- Marubashi and Lepping (2007) Marubashi, K., and R. P. Lepping (2007), Long-duration magnetic clouds: a comparison of analyses using torus- and cylinder-shaped flux rope models, Annales Geophysicae, 25, 2453–2477, 10.5194/angeo-25-2453-2007.
- Marubashi et al. (2015) Marubashi, K., S. Akiyama, S. Yashiro, N. Gopalswamy, K.-S. Cho, and Y.-D. Park (2015), Geometrical Relationship Between Interplanetary Flux Ropes and Their Solar Sources, Sol. Phys., 290, 1371–1397, 10.1007/s11207-015-0681-4.
- McComas et al. (1989) McComas, D. J., J. T. Gosling, S. J. Bame, E. J. Smith, and H. V. Cane (1989), A test of magnetic field draping induced BZ perturbations ahead of fast coronal mass ejecta, Journal of Geophysical Research (Space Physics), 94, 1465–1471, 10.1029/JA094iA02p01465.
- McIntosh et al. (2011) McIntosh, S. W., R. J. Leamon, and B. De Pontieu (2011), The Spectroscopic Footprint of the Fast Solar Wind, Astrophys. J., 727, 7, 10.1088/0004-637X/727/1/7.
- Moran et al. (2000) Moran, P. J., S. Ananthakrishnan, V. Balasubramanian, A. R. Breen, A. Canals, R. A. Fallows, P. Janardhan, M. Tokumaru, and P. J. S. Williams (2000), Observations of interplanetary scintillation during the 1998 Whole Sun Month: a comparison between EISCAT, ORT and Nagoya data, Annales Geophysicae, 18, 1003, 10.1007/s00585-000-1003-0.
- Neugebauer et al. (1998) Neugebauer, M., R. J. Forsyth, A. B. Galvin, K. L. Harvey, J. T. Hoeksema, A. J. Lazarus, R. P. Lepping, J. A. Linker, Z. Mikic, J. T. Steinberg, R. von Steiger, Y.-M. Wang, and R. F. Wimmer-Schweingruber (1998), Spatial structure of the solar wind and comparisons with solar data and models, Journal of Geophysical Research (Space Physics), 103, 14,587–14,600, 10.1029/98JA00798.
- Owens and Cargill (2004) Owens, M., and P. Cargill (2004), Non-radial solar wind flows induced by the motion of interplanetary coronal mass ejections, Annales Geophysicae, 22, 4397–4406, 10.5194/angeo-22-4397-2004.
- Posch et al. (2003) Posch, J. L., M. J. Engebretson, V. A. Pilipenko, W. J. Hughes, C. T. Russell, and L. J. Lanzerotti (2003), Characterizing the long-period ULF response to magnetic storms, Journal of Geophysical Research (Space Physics), 108, 1029, 10.1029/2002JA009386.
- Rastogi et al. (2010) Rastogi, R. G., P. Janardhan, K. Ahmed, A. C. Das, and S. K. Bisoi (2010), Unique observations of a geomagnetic SI+ - SI- pair: Solar sources and associated solar wind fluctuations, Journal of Geophysical Research (Space Physics), 115, A12110, 10.1029/2010JA015708.
- Rosenberg and Coleman (1980) Rosenberg, R. L., and P. J. Coleman, Jr. (1980), Solar cycle-dependent north-south field configurations observed in solar wind interaction regions, Journal of Geophysical Research (Space Physics), 85, 3021–3032, 10.1029/JA085iA06p03021.
- Russell et al. (1994) Russell, C. T., M. Ginskey, and S. M. Petrinec (1994), Sudden impulses at low latitude stations: Steady state response for southward interplanetary magnetic field, Journal of Geophysical Research (Space Physics), 99, 13,403, 10.1029/94JA00549.
- Scargle (1982) Scargle, J. D. (1982), Studies in astronomical time series analysis. II - Statistical aspects of spectral analysis of unevenly spaced data, Astrophys. J., 263, 835–853, 10.1086/160554.
- Scargle (1989) Scargle, J. D. (1989), Studies in astronomical time series analysis. III - Fourier transforms, autocorrelation functions, and cross-correlation functions of unevenly spaced data, Astrophys. J., 343, 874–887, 10.1086/167757.
- Scherrer et al. (1995) Scherrer, P. H., R. S. Bogart, R. I. Bush, J. T. Hoeksema, A. G. Kosovichev, J. Schou, W. Rosenberg, L. Springer, T. D. Tarbell, A. Title, C. J. Wolfson, I. Zayer, and MDI Engineering Team (1995), The Solar Oscillations Investigation - Michelson Doppler Imager, Sol. Phys., 162, 129–188, 10.1007/BF00733429.
- Sheeley et al. (1976) Sheeley, N. R., Jr., J. W. Harvey, and W. C. Feldman (1976), Coronal holes, solar wind streams, and recurrent geomagnetic disturbances - 1973-1976, Sol. Phys., 49, 271–278, 10.1007/BF00162451.
- Siegel (1980) Siegel, A. F. (1980), Testing for periodicity in a time series, Amer. Statis. Assoc., 75, 345–348.
- Skoug et al. (1999) Skoug, R. M., S. J. Bame, W. C. Feldman, J. T. Gosling, D. J. McComas, J. T. Steinberg, R. L. Tokar, P. Riley, L. F. Burlaga, N. F. Ness, and C. W. Smith (1999), A prolonged He+ enhancement within a coronal mass ejection in the solar wind, Geophys. Res. Lett., 26, 161–164, 10.1029/1998GL900207.
- Smith and Wolfe (1976) Smith, E. J., and J. H. Wolfe (1976), Observations of interaction regions and corotating shocks between one and five AU - Pioneers 10 and 11, Geophys. Res. Lett., 3, 137–140, 10.1029/GL003i003p00137.
- Smith et al. (1999) Smith, J. P., M. F. Thomsen, J. E. Borovsky, and M. Collier (1999), Solar wind density as a driver for the ring current in mild storms, Geophys. Res. Lett., 26, 1797–1800, 10.1029/1999GL900341.
- Sonett and Colburn (1965) Sonett, C. P., and D. S. Colburn (1965), The SI+-SI- pair and interplanetary forward-reverse shock ensembles, Planet. Space Sci., 13, 675–+, 10.1016/0032-0633(65)90046-2.
- Stone et al. (1998) Stone, E. C., A. M. Frandsen, R. A. Mewaldt, E. R. Christian, D. Margolies, J. F. Ormes, and F. Snow (1998), The Advanced Composition Explorer, Space Sci. Rev., 86, 1–22, 10.1023/A:1005082526237.
- Tang et al. (1985) Tang, F., S.-I. Akasofu, E. Smith, and B. Tsurutani (1985), Magnetic fields on the sun and the north-south component of transient variations of the interplanetary magnetic field at 1 AU, Journal of Geophysical Research (Space Physics), 90, 2703–2712, 10.1029/JA090iA03p02703.
- Tang et al. (1989) Tang, F., B. T. Tsurutani, E. J. Smith, W. D. Gonzalez, and S. I. Akasofu (1989), Solar sources of interplanetary southward BZ events responsible for major magnetic storms (1978-1979), Journal of Geophysical Research (Space Physics), 94, 3535–3541, 10.1029/JA094iA04p03535.
- Tanskanen et al. (2005) Tanskanen, E. I., J. A. Slavin, D. H. Fairfield, D. G. Sibeck, J. Gjerloev, T. Mukai, A. Ieda, and T. Nagai (2005), Magnetotail response to prolonged southward IMF Bz intervals: Loading, unloading, and continuous magnetospheric dissipation, Journal of Geophysical Research (Space Physics), 110, A03216, 10.1029/2004JA010561.
- Terasawa et al. (1997) Terasawa, T., M. Fujimoto, T. Mukai, I. Shinohara, Y. Saito, T. Yamamoto, S. Machida, S. Kokubun, A. J. Lazarus, J. T. Steinberg, and R. P. Lepping (1997), Solar wind control of density and temperature in the near-Earth plasma sheet: WIND/GEOTAIL collaboration, Geophys. Res. Lett., 24, 935–938, 10.1029/96GL04018.
- Thompson et al. (2000) Thompson, B. J., E. W. Cliver, N. Nitta, C. Delannée, and J.-P. Delaboudinière (2000), Coronal dimmings and energetic CMEs in April-May 1998, Geophys. Res. Lett., 27, 1431–1434, 10.1029/1999GL003668.
- Thomsen et al. (1998) Thomsen, M. F., J. E. Borovsky, D. J. McComas, and M. R. Collier (1998), Variability of the ring current source population, Geophys. Res. Lett., 25, 3481–3484, 10.1029/98GL02633.
- Tsurutani and Meng (1972) Tsurutani, B. T., and C.-I. Meng (1972), Interplanetary magnetic-field variations and substorm activity, Journal of Geophysical Research (Space Physics), 77, 2964, 10.1029/JA077i016p02964.
- Tsurutani et al. (1984) Tsurutani, B. T., C. T. Russell, J. H. King, R. D. Zwickl, and R. P. Lin (1984), A kinky heliospheric current sheet - Cause of CDAW-6 substorms, Geophys. Res. Lett., 11, 339–342, 10.1029/GL011i004p00339.
- Tsurutani et al. (1988) Tsurutani, B. T., E. J. Smith, W. D. Gonzalez, F. Tang, and S. I. Akasofu (1988), Origin of interplanetary southward magnetic fields responsible for major magnetic storms near solar maximum (1978-1979), Journal of Geophysical Research (Space Physics), 93, 8519–8531, 10.1029/JA093iA08p08519.
- Tsurutani et al. (1992) Tsurutani, B. T., W. D. Gonzalez, F. Tang, and Y. T. Lee (1992), Great magnetic storms, Geophys. Res. Lett., 19, 73–76, 10.1029/91GL02783.
- Tsurutani et al. (1995) Tsurutani, B. T., C. M. Ho, J. K. Arballo, B. E. Goldstein, and A. Balogh (1995), Large amplitude IMF fluctuations in corotating interaction regions: Ulysses at midlatitudes, Geophys. Res. Lett., 22, 3397–3400, 10.1029/95GL03179.
- Tsurutani et al. (1998) Tsurutani, B. T., J. K. Arballo, G. S. Lakhina, C. M. Ho, J. Ajello, J. S. Pickett, D. A. Gurnett, R. P. Lepping, W. K. Peterson, G. Rostoker, Y. Kamide, and S. Kokubun (1998), The January 10, 1997 auroral hot spot, horseshoe aurora and first substorm: A CME loop?, Geophys. Res. Lett., 25, 3047–3050, 10.1029/98GL01304.
- Tsurutani et al. (2006) Tsurutani, B. T., W. D. Gonzalez, A. L. C. Gonzalez, F. L. Guarnieri, N. Gopalswamy, M. Grande, Y. Kamide, Y. Kasahara, G. Lu, I. Mann, R. McPherron, F. Soraas, and V. Vasyliunas (2006), Corotating solar wind streams and recurrent geomagnetic activity: A review, Journal of Geophysical Research (Space Physics), 111, A07S01, 10.1029/2005JA011273.
- Tsurutani et al. (2011) Tsurutani, B. T., G. S. Lakhina, O. P. Verkhoglyadova, W. D. Gonzalez, E. Echer, and F. L. Guarnieri (2011), A review of interplanetary discontinuities and their geomagnetic effects, Journal of Atmospheric and Solar-Terrestrial Physics, 73, 5–19, 10.1016/j.jastp.2010.04.001.
- Tsurutani et al. (2014) Tsurutani, B. T., E. Echer, K. Shibata, O. P. Verkhoglyadova, A. J. Mannucci, W. D. Gonzalez, J. U. Kozyra, and M. Pätzold (2014), The interplanetary causes of geomagnetic activity during the 7-17 March 2012 interval: a CAWSES II overview, Journal of Space Weather and Space Climate, 4(27), A02, 10.1051/swsc/2013056.
- Tsurutani et al. (2015) Tsurutani, B. T., R. Hajra, E. Echer, and J. W. Gjerloev (2015), Extremely intense (SML ¡ -2500 nT) substorms: isolated events that are externally triggered?, Annales Geophysicae, 33, 519–524, 10.5194/angeo-33-519-2015.
- Viall and Vourlidas (2015) Viall, N. M., and A. Vourlidas (2015), Periodic Density Structures and the Origin of the Slow Solar Wind, Astrophys. J., 807, 176, 10.1088/0004-637X/807/2/176.
- Viall et al. (2008) Viall, N. M., L. Kepko, and H. E. Spence (2008), Inherent length-scales of periodic solar wind number density structures, Journal of Geophysical Research (Space Physics), 113, A07101, 10.1029/2007JA012881.
- Viall et al. (2009a) Viall, N. M., L. Kepko, and H. E. Spence (2009a), Relative occurrence rates and connection of discrete frequency oscillations in the solar wind density and dayside magnetosphere, Journal of Geophysical Research (Space Physics), 114, A01201, 10.1029/2008JA013334.
- Viall et al. (2009b) Viall, N. M., H. E. Spence, and J. Kasper (2009b), Are periodic solar wind number density structures formed in the solar corona?, Geophys. Res. Lett., 36, L23102, 10.1029/2009GL041191.
- Viall et al. (2010) Viall, N. M., H. E. Spence, A. Vourlidas, and R. Howard (2010), Examining Periodic Solar-Wind Density Structures Observed in the SECCHI Heliospheric Imagers, Sol. Phys., 267, 175–202, 10.1007/s11207-010-9633-1.
- Villante and Piersanti (2009) Villante, U., and M. Piersanti (2009), Analysis of geomagnetic sudden impulses at low latitudes, Journal of Geophysical Research (Space Physics), 114, A06209, 10.1029/2008JA013920.
- Villante et al. (2005) Villante, U., M. Piersanti, P. di Giuseppe, M. Vellante, T. L. Zhang, and W. Magnes (2005), Sudden commencement event of 17 April 2002: Aspects of the geomagnetic response at low latitudes, Journal of Geophysical Research (Space Physics), 110, A12S23, 10.1029/2004JA010978.
- Walker et al. (2006) Walker, R. J., M. Ashour-Abdalla, M. El Alaoui, and F. V. Coroniti (2006), Magnetospheric convection during prolonged intervals with southward interplanetary magnetic field, Journal of Geophysical Research (Space Physics), 111, A10219, 10.1029/2005JA011541.
- Wang et al. (2003) Wang, C. B., J. K. Chao, and C.-H. Lin (2003), Influence of the solar wind dynamic pressure on the decay and injection of the ring current, Journal of Geophysical Research (Space Physics), 108, 1341, 10.1029/2003JA009851.
- Wang et al. (2000) Wang, H., P. R. Goode, C. Denker, G. Yang, V. Yurchishin, N. Nitta, J. B. Gurman, C. St. Cyr, and A. G. Kosovichev (2000), Comparison of the 1998 April 29 M6.8 and 1998 November 5 M8.4 Flares, Astrophys. J., 536, 971–981, 10.1086/308964.
- Wang et al. (2002) Wang, T., Y. Yan, J. Wang, H. Kurokawa, and K. Shibata (2002), The Large-Scale Coronal Field Structure and Source Region Features for a Halo Coronal Mass Ejection, Astrophys. J., 572, 580–597, 10.1086/340189.
- Webb and Hundhausen (1987) Webb, D. F., and A. J. Hundhausen (1987), Activity associated with the solar origin of coronal mass ejections, Sol. Phys., 108, 383–401, 10.1007/BF00214170.
- Wilson and Sugiura (1961) Wilson, C. R., and M. Sugiura (1961), Hydromagnetic Interpretation of Sudden Commencements of Magnetic Storms, Journal of Geophysical Research (Space Physics), 66, 4097–4111, 10.1029/JZ066i012p04097.
- Yumoto and CPMN Group (2001) Yumoto, K., and CPMN Group (2001), Characteristics of Pi 2 magnetic pulsations observed at the CPMN stations: A review of the STEP results, Earth, Planets, and Space, 53, 981–992.
- Zhang and Moldwin (2014) Zhang, X.-Y., and M. B. Moldwin (2014), The source, statistical properties, and geoeffectiveness of long-duration southward interplanetary magnetic field intervals, Journal of Geophysical Research (Space Physics), 119, 658–669, 10.1002/2013JA018937.
- Zhao and Hoeksema (1998) Zhao, X. P., and J. T. Hoeksema (1998), Central axial field direction in magnetic clouds and its relation to southward interplanetary magnetic field events and dependence on disappearing solar filaments, Journal of Geophysical Research (Space Physics), 103, 2077, 10.1029/97JA03234.
- Zhou and Tsurutani (2001) Zhou, X., and B. T. Tsurutani (2001), Interplanetary shock triggering of nightside geomagnetic activity: Substorms, pseudobreakups, and quiescent events, Journal of Geophysical Research (Space Physics), 106, 18,957–18,968, 10.1029/2000JA003028.