An optically-thick disk wind in GRO J165540?
Abstract
We revisited the unusual wind in GRO J165540 detected with Chandra in 2005 April, using long-term RXTE X-ray data and simultaneous optical/near-infrared photometric data. This wind is the most convincing case for magnetic driving in black hole binaries, as it has an inferred launch radius which is a factor of 10 smaller than the thermal wind prediction. However, the optical and near infrared fluxes monotonically increase around the Chandra observation, whereas the X-ray flux monotonically decreases from 10 days beforehand. Yet the optical and near infrared fluxes are from the outer, irradiated disk, so for them to increase implies that the X-rays likewise increased. We applied a new irradiated disk model to the multi-wavelength spectral energy distributions (SEDs). Fitting the optical and near-infrared fluxes, we estimated the intrinsic luminosity at the Chandra epoch was , which is more than one order of magnitude larger than the observed X-ray luminosity. These results could be explained if a Compton-thick, almost completely ionized gas was present in the wind and strong scattering reduced the apparent X-ray luminosity. The effects of scattering in the wind should then be taken into account for discussion of the wind-driving mechanism. Radiation pressure and Compton heating may also contribute to powering the wind at this high luminosity.
Subject headings:
accretion, accretion disks — black hole physics — X-rays: binaries — X-rays: individual(GRO J165540)I. Introduction
Since the first detection of highly ionized absorption lines in the late 1990’s, high-resolution X-ray spectroscopy has provided great opportunities to probe disk winds in black hole (BH) and neutron star (NS) low-mass X-ray binaries (e.g., Ueda et al., 1998; Kotani et al., 2000; Ueda et al., 2001; Boirin & Parmar, 2003; Díaz Trigo et al., 2006; Miller et al., 2006; Kubota et al., 2007; Miller et al., 2008; Díaz Trigo et al., 2014). Disk winds are thought to have an equatorial structure, extending along the disk plane with a relatively small solid angle, because the lines are only seen in systems with high inclination angles larger than (Ponti et al., 2012) and do not show large orbital dependence of variability (Yamaoka et al., 2001). The high mass loss rates, comparable to or even an order of magnitude larger than the mass accretion rates (Ueda et al., 2010; Neilsen et al., 2011), suggest that disk winds play a key role in the dynamics of accretion onto compact objects, although how and how much they affect the accretion disks have been poorly understood.
There are three major mechanisms proposed for powering the disk winds in low-mass X-ray binaries: radiation pressure, thermal pressure (due to Compton heating) and magnetic processes. Radiation pressure works effectively at near- or super-Eddington luminosity, if gas is highly ionized. Thermal winds can be launched from anywhere above a certain radius at which the isothermal sound speed of gas heated by X-rays overcomes the local escape velocity. This radius, called ”Compton radius” () is given by
| (1) |
where and are the black hole mass and Compton temperature, respectively. More detailed calculations suggest that the thermal winds can be launched from smaller radii, 0.1 (Begelman et al., 1983; Woods et al., 1996), which correspond to – ( is the gravitational radius: ) in stellar-mass BH X-ray binaries. Ionized gas located within remains bound to the surface of the accretion disks as hot atmosphere.
Since a wind is photoionized by X-ray radiation, its launching radius can be observationally estimated from the ionization parameter defined as,
| (2) |
where and represent the ionizing luminosity and the number density of the wind, respectively. Constraining directly is often not easy, and in such cases, the column density of the wind (, where is the length of the wind) has been used under the assumption , to derive through the above equation (e.g., Ueda et al., 1998; Kotani et al., 2000; Kubota et al., 2007). Díaz Trigo & Boirin (2013) showed that outflowing and static ionized absorbers in NS X-ray binaries have values consistent with the thermal driven winds and atmosphere, respectively. Many winds detected in BH X-ray binaries are also consistent with the thermal and/or radiation-pressure driven winds (e.g., Kotani et al., 2000; Kubota et al., 2007; Neilsen & Lee, 2009; Díaz Trigo et al., 2014). The wind velocities are about 100–1000 km s-1, in agreement with the prediction that the winds are generated in the outer parts of the disks.
In 2005, a remarkable wind from GRO J165540 was detected with Chandra High Energy Transmission Grating (HETG) (Miller et al., 2006; Netzer, 2006; Miller et al., 2008). The observed spectrum exhibited a rich forest of blueshifted ionized absorption lines. The estimated intrinsic luminosity (0.03 111 (Eddington Luminosity) erg s-1 for the solar abundances.) is not very high and hence the wind cannot be powered by radiation pressure. The thermal wind interpretation is also difficult, because this luminosity is just about the critical luminosity (; Begelman et al., 1983) below which the Compton heating is not efficient enough to drive a thermal wind.
As the result of detailed photoinization modeling, the GRO J165540 wind was found to have an ionization parameter of erg cm s-1. The density was directly estimated to be cm-3 from a density-sensitive line ratio of Fe XXII. By using Equation (2), the radius was derived to be cm, which is one order of magnitude smaller than the radius at which thermal driven winds can form. The disk wind was thus explained by the remaining scenario, i.e., a magnetic driven wind, although the observed outflow velocity ( km s-1) is lower than the local escape velocity at the radius of cm ( km s-1) and seems too low to drive a wind, unless it has a much larger velocity in the perpendicular direction.
Recently, Uttley & Klein-Wolt (2015) have found that unusual properties in X-ray short-term variability and continuum spectra were seen around the Chandra observation, from a comprehensive study of Rossi X-ray Timing Explorer (RXTE) data, covering almost the entire outburst episode in 2005. When a deep absorption structure emerged at keV, the hard X-ray flux was greatly reduced and a very soft X-ray spectrum appeared. The peculiar spectral shape was similar to that of the ”hypersoft state” sometimes observed in the high mass X-ray binary Cyg X-3, which has a massive stellar wind from its Wolf-Rayet companion (e.g., Koljonen et al., 2010). Meanwhile, the variability power above 0.1 Hz was gradually reduced as the observed X-ray flux decreased. They suggested that these behaviors are linked to the evolution of the disk wind or the accretion flow structure, yet the exact relations among them is still not completely clear.
In this article, we focus on the shape of the multi-wavelength SED of GRO J165540 and its evolution around the Chandra observation during the outburst, and reconsider the wind in the context of the long-term behavior of the accretion disk structure. We use the RXTE X-ray data and also simultaneous optical and near-infrared (OIR) photometric data from the SMARTS (the Small and Medium Aperture Research Telescope System). The OIR emission can be regarded as a reference of the intrinsic luminosity at the outermost part of the accretion disk, which would be less affected by reprocessing in the wind. The multi-wavelength SEDs thus allow us to connect the properties of inner and outer disks.
In Section II, we study the long-term X-ray and OIR behavior around the Chandra observation. In Section III, we analyze the multi-wavelength SED at the Chandra epoch using a new irradiated disk model, and compare the result with that in the normal high/soft state. Compiling all these results, we discuss the nature of the wind in Section IV. We used HEASOFT version 6.13 to reduce and analyze the data. In the following sections, errors represent the 90% confidence range for a single parameter, unless otherwise stated. Throughout the article, we refer to the table given by Wilms et al. (2000) as the solar abundances. The distance and inclination angle of GRO J165540 are assumed to be kpc (Hjellming & Rupen, 1995; Orosz & Bailyn, 1997) and (Greene et al., 2001), respectively.
II. Long-term trends in optical, near-infrared, X-ray properties
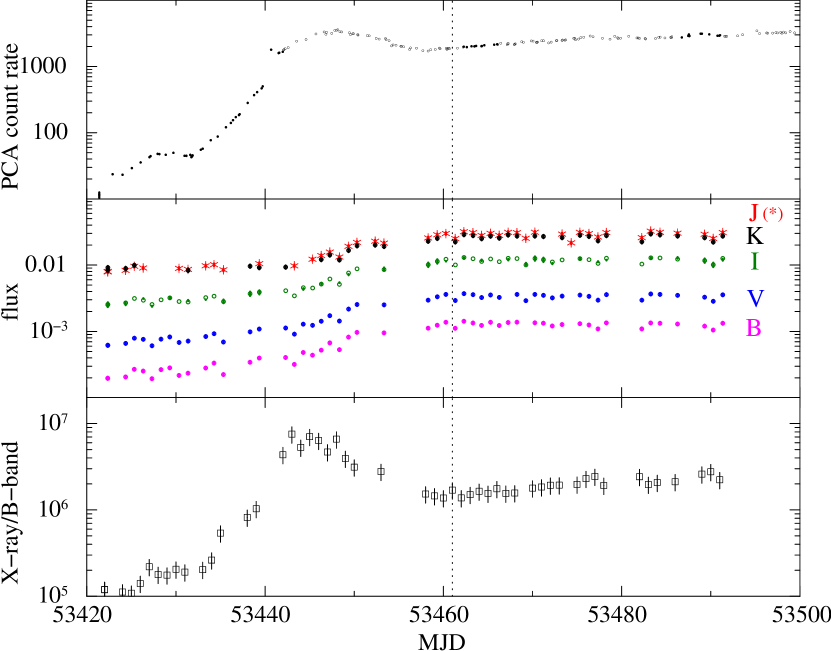
Figure 1 shows the long-term X-ray and optical/NIR behavior in the first 80 days of the outburst in 2005, including the date of the Chandra observation (April 1 MJD 53461). The X-ray count rates are obtained with the RXTE/Proportional Counter Array (PCA), and the OIR fluxes are taken from the SMARTS photometric observations in the , , , , and bands (see Buxton et al., 2005; Migliari et al., 2007, for the details of the observations).
The most remarkable point is that the OIR fluxes were monotonically increasing in the whole period, while the X-ray flux was decreasing before the Chandra epoch. This cannot be explained by an increase of the mass accretion rate alone. As noticed from the bottom panel of Fig. 1, the ratio between the X-ray and B-band fluxes marks the minimal value at around the Chandra observation, after the hard-to-soft transition at MJD 53440. We note that, among the 5 OIR bands, the -band flux should have the least fractional contribution of the blackbody emission from the companion (a F6 III-type star with a temperature of 6300 K; Shahbaz et al. 1999), and is dominated by the irradiated disk emission from the outer disk (see Section III for more details).
Using the OIR fluxes and simultaneous RXTE/Photon Counting Array (PCA) and High Energy X-ray Timing Experiment (HEXTE) data, we created multi-wavelength SEDs in the individual MJDs. We employed the standard data-reduction procedure described in the RXTE cook book and extracted the PCA spectra from the ”Standard 2” data of the Proportional Counter Array 2 (PCA2) and the HEXTE spectra from Cluster A and B data for each observation ID. The OIR magnitudes are converted to the fluxes, from which we produced spectra and response matrix files in the XSPEC format utilizing the ftool flx2xsp. We added a 0.5% systematic error to each bin in the PCA spectra, following previous works (e.g., Migliari et al., 2007; Uttley & Klein-Wolt, 2015).
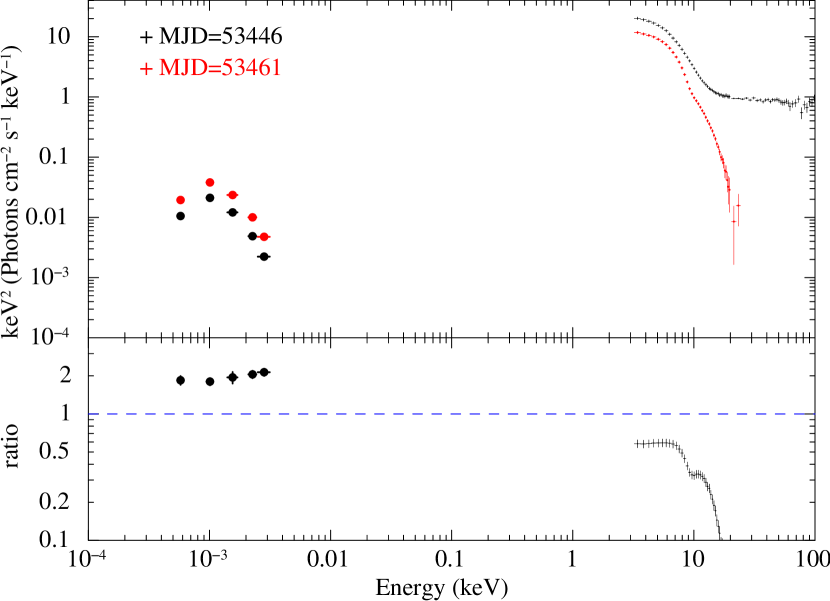
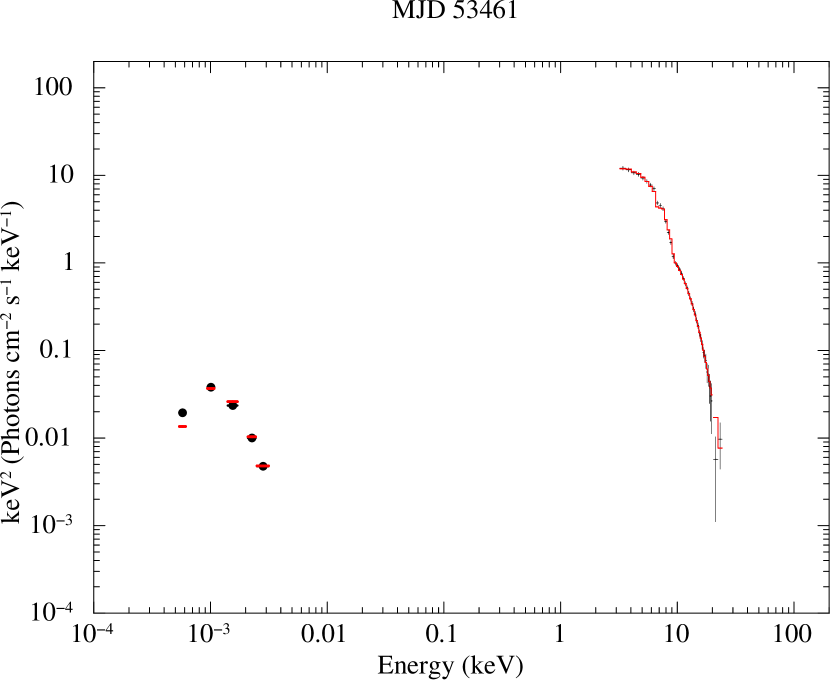
In Figure 2, the SED on MJD 53461, the date of the Chandra observation, is compared with that on MJD 53446 in the normal high/soft state, whose X-ray spectrum is well described by a multi-color disk (MCD) combined with a hard tail with a photon index of 2. Note that MJD 53446 corresponds to the peak of the observed X-ray flux in the initial outburst rise. This figure shows that the X-ray flux levels decreased at all energies from MJD 53446 to the Chandra epoch, whereas the OIR fluxes increased.
Moreover, a huge difference is present in the hard X-ray band. The difference is not just in normalization. The hard tail in the normal high/soft state is suppressed in the spectrum on MJD 53461, which is dominated by the soft X-ray fluxes below 10 keV. As reported by Uttley & Klein-Wolt (2015), this X-ray spectrum can be described with a MCD plus an unusually steep power-law component with a photon index of 5. This peculiar hypersoft state was steadily seen from a few days before the Chandra observation, after making rapid and frequent transitions between the normal high/soft and hypersoft states in the preceding 10 days. We note that, in Figure 2, a significant depression is present at 8 keV in the SED on MJD 53461, which is likely an ionized iron-K edge along with absorption lines produced by the disk winds. This feature was always visible during the hypersoft state, and deepened without significant energy shifts, as the observed X-ray flux decreased (see Uttley & Klein-Wolt, 2015).
As noticed in the bottom panel of Figure 2, the flux ratio of the two observations is almost constant in the soft X-ray band below 5 keV, where the disk blackbody dominates. This indicates that the apparent disk luminosity () decreased without significantly changing the inner disk temperature (). In fact, the hypersoft state produces a vertical branch in the vs. diagram (see Figure 16 in Done et al., 2007). This means that the evolution of the disk spectrum in the hypersoft state deviates from the standard relation.
What is unusual in the hypersoft state is not only the characteristics of the SED but also fast X-ray variability. As reported by Uttley & Klein-Wolt (2015), the high-frequency part of the flat noise component was remarkably reduced in the hypersoft state, compared with that in the normal high/soft state. The break frequency in the high/soft state was located at 5 Hz, whereas during the hypersoft state, it moved to lower frequencies with decreasing X-ray flux, to reach 0.1 Hz at the Chandra observation. They also found that the energy dependence of the PDS shape was not strong, suggesting that the decline of the high frequency variability was not simply caused by the disappearance of the power-law tail.
III. A new irradiated disk model ”optxrplir” and its application to the SEDs
Here we model the multi-wavelength SEDs of GRO J165540 in the normal soft state and at the Chandra epoch in the hypersoft state to test the possibility that the peculiar behaviors in the hypersoft state are associated with the disk wind. Using the OIR data as a reference of the intrinsic emission from the outermost disk region, we investigate whether and how much the disk wind can affect the intrinsic X-ray emission at the Chandra epoch.
III.1. The optxrplir model
Different spectral components (the companion star, the outer parts of the accretion disk, the synchrotron radiation from the jets or the hot accretion flow) can contribute to the OIR emission of BH X-ray binaries (see e.g., van Paradijs 1981, Gierliński et al. 2008, and Gierliński et al. 2009 for contribution from outer disks, Corbel & Fender 2002, Hynes et al. 2003, Buxton & Bailyn 2004, Russell et al. 2007, and Gandhi et al. 2010 for that from jets, and Poutanen & Veledina 2014, Poutanen et al. 2014, and Veledina et al. 2015 for that from hot flows). Normally, jet emission does not contribute in the disk dominant states. In fact, Migliari et al. (2007) found that the radio flux actually dropped down to an undetectable level and that jets were quenched in the hypersoft state. Usually, the outer disk emission is the major contributor in outbursting BH X-ray binaries with a low-mass companion. The outer disk region is illuminated by X-rays from the inner disk and the Comptonized corona, and consequently the reprocessed emission enhances the OIR fluxes. To determine the accurate mass accretion rates through the inner and outer disks, we have to account for the intrinsic disk, Compton-scattered, and reprocessed emission components in a self-consistent manner.
For this purpose, we use a new irradiated disk model named ”optxrplir” and apply it to the multi-wavelength SEDs. This model is based on the optxirr model (Sutton et al., 2014), which combines the two model implemented in XSPEC: ”optxagnf” (Done et al., 2012), the energetically-coupled disk plus Comptonized corona model including color temperature correction, and the irradiated disk model ”diskir” (Gierliński et al., 2008, 2009). Using our new model, we can fully consider the emissions from the inner and outer disk self-consistently.
The main difference between optxirr and our model optxrplir is the radial dependence of the X-ray flux irradiating the disk. The optxrplir model assumes that the illuminating flux does not scale with radius as , but . The reprocessed component in this model is thus more enhanced in outermost parts of the disk than the previous models. This radial dependence is derived from a more realistic calculation, by solving the hydrostatic and energy balance at each radius of a geometrically thin irradiated disk (Cunningham, 1976). In this condition, the disk height increases at larger radii in proportion to due to heating by irradiation. The dependence was recently adopted to model multi-wavelength SEDs in the low/hard state (Veledina et al. 2013). Also, previous irradiated disk models describe the strength of the reprocessed component with one parameter (the fraction of illuminating flux thermalized in the outer disk), while optxrplir separates it, for the convenience of calculation, into two explicit parameters: the geometry-dependent factor and , where is the height of the disk at the outer edge divided by the outer radius and is the albedo of the outer disk. We assume that the total X-rays, not only hard X-rays, are responsible for reprocessing. This is consistent with that the OIR SEDs were not largely changed in spite of the huge difference in the hard X-ray tail between the high/soft state and the hypersoft state.
The model includes two different Comptonization components in the similar way as the optxagnf model. One is a power-law component extending to the hard X-ray band above 10 keV, which can be used to model the hard tail observed in the normal high/soft state. The other is a low-temperature thermal Comptonization component, which can be used for the steep power-law component sometimes seen at slightly higher energies than a MCD component (e.g., Frontera et al., 2001; Ibragimov et al., 2005; Nakahira et al., 2012). We adopt the latter to model the steep power-law component in the hypersoft state. The former component (hereafter referred to as “power-law tail”) is described with a photon index and a cut-off energy, and the latter (“soft thermal Comptonization component”) with an electron temperature () and an optical depth (). The optxrplir model assumes that the power-law tail is generated from the gravitational energy dissipated within the radii from the innermost stable circular orbit (ISCO) to , and that the soft thermal Comptonization component is produced between and . Only disk blackbody emission (including irradiation) is emitted from the radii larger than . The rest parameters in the model are all taken from the optxagnf model (the BH mass and spin, the distance to the system, and the Eddington ratio) and the diskir model (the outer disk radius , and also and as explained above).

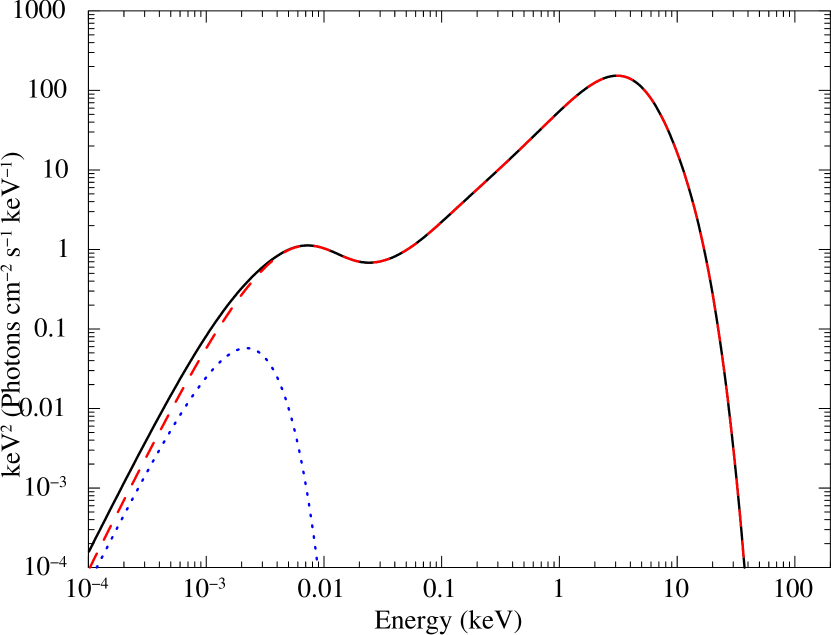
+bbodyrad model in the normal high/soft state (MJD 53446). The dashed and dotted lines represent the kerrconv*optxrplir component (including the irradiated disk emission and the hard tail) and the bbodyrad component (the blackbody emission from the companion star), respectively.
III.2. SED analysis with optxrplir
III.2.1 Model setup
To analyze our multi-wavelength SEDs of GRO J165540, we use optxrplir as a full model of the irradiated disk emission and its Comptonization. The OIR fluxes also include the blackbody emission from the companion star, for which we use the bbodyrad model. Throughout the SED analysis, we fixed the temperature and radius of the companion star at 6300 K and 5.0 , respectively, and the BH mass at 6.3 , following previous estimation by Shahbaz et al. (1999) and Greene et al. (2001). The interstellar X-ray absorption is taken into account by multiplying the tbabs model (Wilms et al., 2000). We adopt cm-2 (Miller et al., 2006; Takahashi et al., 2008) as the column density of the Galactic absorption. The extinction of the OIR fluxes is also considered by combining the redden model, in which the ratio of galactic extinctions and the interstellar reddening are assumed. The value of is derived from and the relation cm-2 mag-1, determined by Bohlin et al. (1978).
The optxrplir model assumes an inclination of in calculating the disk spectrum. To incorporate the inclination dependence of the disk emission, we set the normalization to (, in the case of GRO J165540 with ). In addition, this model does not include relativistic smearing. Following Done et al. (2013), we consider this effect by convolving our model with kerrconv (Brenneman & Reynolds, 2006). The kerrconv model uses , , inner and outer radii (in units of the ISCO radius: ) within which the relativistic effects are considered, the radial emissivity indices of inner and outer parts, and break radius (in units of ) at which the emissivity index changes. We link in kerrconv to that in optxrplir and fix at and the emissivity indices at 3. The inner and outer radii are set to and , respectively. In this way, we convolve the entire disk spectrum with a smearing kernel calculated from the radii between and , in which a large fraction of the disk flux is produced222 The choice of the outer radius for the kerrconv model does not substantially affect our results. In the case of a Schwarzschild black hole, % of the total disk emission is produced between and (Novikov & Thorne, 1973, the percentage is slightly larger for ). We confirm that the results of the spectral fits remain unchanged within the 90% error ranges when we adopt 5 and 10 (below which % and % of the flux are generated, respectively) as the outer radius., instead of integrating the smeared blackbody spectrum at each radius. As shown in Done et al. (2013), the kerrconv*optx model with this parameter setting gives a good approximation of relativistic disk models.
III.2.2 SED fits for the normal high/soft state
We first apply this model,
”tbabs*redden(kerrconv*
optxrplir+bbodyrad)”,
to the multi-wavelength SED on MJD 53446 in the normal
high/soft state. Since X-ray spectra in that state typically
have a power-law tail but no significant thermal
Comptonization component, here we ignore the soft
thermal Comptonization component in optxrplir
(i.e., is linked to ).
As for irradiation, the strength of the reprocessed component
is scaled with
and it is difficult to constrain both and
simultaneously in spectral fitting. Here,
we assume and leave
as a free parameter to absorb uncertainties in the
geometry of the outer disk.
The Eddington ratio (), BH spin , and
the photon index () and of the
power-law tail are also allowed to vary. The cut-off
energy of the power-law tail is set to be 1000 keV,
a sufficiently high value compared with the energy
range of the RXTE data. is fixed at
( cm), which
is the tidal radius of GRO J165540 given in
Shahbaz et al. (1998)333
This value corresponds to 80% of the Roche lobe size.
To test a different value, we leave as a
free parameter in the fit of the SED on MJD 53446, and
use the best-fit value to fit the SED at the Chandra
epoch. We confirm that this does not affect our conclusions..
We extend the energy range to keV–1000 keV
in the following spectral fit, because kerrconv is a
convolution model.
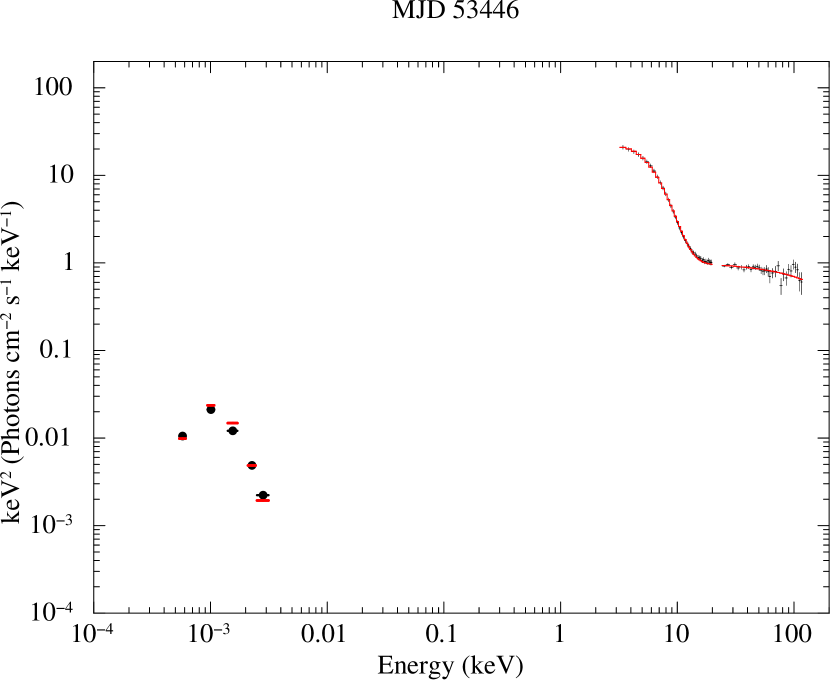
The left panel of Figure 3 shows the results of fit on MJD 53446. The model well reproduces both the OIR fluxes and the X-ray spectrum, yielding . The free parameters are constrained to be , , , , and . The strength of irradiated disk component is thus estimated to be . We note that the high value for is consistent with a highly ionized and reflective disk surface suggested by van Paradijs (1981), van Paradijs (1983), and Gierliński et al. (2009), but combinations of somewhat smaller and smaller (where ) may be also possible.
The best-fit model corrected for the interstellar absorption/extinction is plotted in Figure 4. It has a double-humped profile unlike the diskir model, which instead produces a flat ”shoulder” in the form. This demonstrates the difference in radial dependence of the disk temperature. We find that the OIR fluxes are dominated by reprocessed emission from the outer edge of the disk irradiated by X-rays. The OIR bands are located at slightly lower frequencies than that of the peak in the reprocessed component, above and below which the relations between the incident X-ray luminosity () and the luminosity of the irradiated outer disk () are given as and , respectively (see e.g., Coriat et al., 2009).
III.2.3 SED fits for the Chandra epoch in the hypersoft state
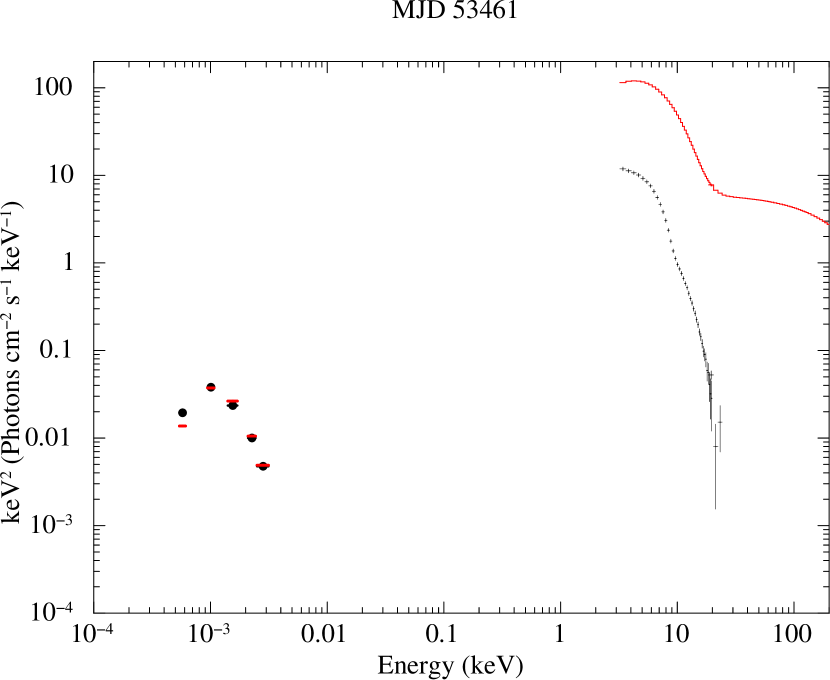
Adopting the resultant parameters, we next apply the optxrplir model to the SED on MJD 53461 in the hypersoft state. The right panel of Fig. 3 compares the SED on MJD 53461 with the same model on MJD 53446 in the high/soft state, except for the Eddington ratio, which is adjusted to fit the OIR fluxes. This gives a bolometric luminosity of 0.7 . Since the OIR to X-ray flux ratio became lower on MJD 53461 than that in the normal high soft state (see Fig. 1), the model does not fit the X-ray spectrum. We can clearly see that this model overestimates the soft X-ray flux by about 1 order of magnitude.
The discrepancy seen in the right panel of Fig. 3 cannot be explained by absorption in the optically-thin wind detected by Miller et al. (2008). We create a photoionized absorption model with XSTAR, employing the continuum spectral model in Miller et al. (2008) with a luminosity changed to 0.7 as an incident ionizing spectrum, and assuming the density of the wind as the value determined by them, cm-3. As the column density and ionization parameter, we adopt representative values in their photoionization models: cm-2 and erg cm s-1. However, we find this ionized absorption reduces only 3% of the soft X-ray flux. Electron scattering in the absorber, which is not accounted for in the XSTAR code, can only decrease 30% of the radiation. The discrepancy is neither canceled out by taking into account the decrease of the mass accretion rate in the inner disk region due to the mass loss in the wind. Miller et al. (2008) estimated the wind outflow rate to be 10% of the mass accretion rate (assuming that the outflow velocity perpendicular to the disk plane is not much higher than the line-of-sight velocity), and in the more recent work by Miller et al. (2015), it was estimated to be 30% of the mass accretion rate.
One possibility is that the disk wind made irradiation stronger than the normal high/soft state. The difference in the X-ray versus OIR flux ratio is canceled out if at the Chandra epoch is 4 times larger than that in the normal high/soft state. It is difficult for disk winds to produce blackbody radiation by themselves, because they normally have much higher temperatures than those in the outer disks and are optically thin for free-free absorption. Instead, they can contribute to the irradiation of the disk by scattering X-ray photons down and enhancing the illumination of the outer disk (Gierliński et al., 2009). In this case, the geometry-dependent factor for irradiation can be expressed as
| (3) |
where and represent the solid angle of the wind and the optical depth for scattering, respectively.
In our case, however, it is unlikely that the OIR fluxes are enhanced by the optically-thin magnetic wind. The Chandra spectrum predominantly shows absorption features instead of prominent P-Cygni profiles, and hence must be fairly small. In addition, the disk at the location of the magnetic wind ( cm) has a relatively high temperature and mainly produces photons with much higher energies than those in the OIR bands. The emitting region is too small to substantially contribute to the OIR fluxes. In the above modeling, the OIR fluxes are dominated by the reprocessed emission from the outer edge of the disk at cm, where the temperature is eV. Using the radial dependence of the temperature in the irradiated disk, (Cunningham, 1976; Veledina et al., 2013), we estimate the disk temperature at the launching point to be times larger than that at . To investigate whether the reprocessed emission from the disk around the wind launching radius can explain the opposite behavior of the OIR and X-ray fluxes, we add a bbodyrad component with a temperature of 7 eV to the model for MJD 53446, and compare it with the SED at the Chandra epoch. We find that the OIR flux levels cannot be reproduced unless we assume an unusually large solid angle at the launching point (more than 2 orders of magnitude larger than that of the disk).
Moreover, it is difficult for an enhanced alone to explain the trend in the soft X-ray spectrum: the inner disk temperature was not largely changed, while the observed X-ray flux was reduced. If the decline of the X-ray flux were produced simply by the decrease of the mass accretion rate in the inner disk region, the temperature should be reduced as well. Considering all the above discussion, we conclude that an optically-thin wind is unlikely to be the main cause of the differences in SED between the normal high/soft state and the hypersoft state.
Instead, it seems more likely that obscuring gas is present between the X-ray and optical emission regions, reducing the intrinsic X-ray spectrum. The gas is likely to be very highly ionized and affect the X-ray radiation by Compton-scattering, otherwise heavy absorption by less ionized material should modify the spectral shape in the soft X-ray band, inconsistent with the fact that it was kept almost constant in the hypersoft state (see Section II). Thus, the origin of the gas could be a Compton-thick, equatorial disk wind, strongly scattering-out the X-ray photons from the line of sight.
We then fit the multi-wavelength SED at the Chandra epoch using the soft thermal Comptonization component implemented in optxrplir, to extract quantitative information of the observed very steep power-law tail and obtain a better SED model. We assume that the X-ray flux is scattered by an almost fully ionized, Compton-thick wind, while the OIR emission regions are located outside of the wind. Under the presence of such a wind, it is difficult to predict whether becomes larger or smaller than that in the normal high/soft state, or remains constant. If the wind extends rather homogeneously over the outer disk region, the geometry-dependent factor increases to due to scattering in the wind. If the electron density is the highest at the wind launching point located at a much smaller radius than the outer edge, and if scattering predominantly occurs there, the wind reduces the X-ray photons illuminating the outer disk by . The optxrplir model uses the intrinsic X-ray luminosity to calculate the irradiated disk spectrum, and the decrease of illuminating photons is regarded as a decrease of . Here, we simply assume that is not largely changed and use the same value in the high/soft state.
We fixed the parameters, and at the values determined in the spectral analysis of the normal high/soft state, and allowed the Eddington ratio and the parameters for the soft thermal Comptonization, , , and to vary. The power-law component is switched off by setting to less than the ISCO. To consider the observed ionized absorption in the wind, we utilize the photoionized absorption model created above, leaving the ionization parameter and column density as free parameters. The cabs model is also incorporated to account for the effect that the dense wind (including both fully and partially ionized gas) scatters the X-ray photons out of the line of sight. We linked the column density of cabs to that of the photoionized absorption model. The final fit model is tbabs*xabs*cabs*redden*(kerrconv*optxrplir + bbodyrad), where xabs represents the photoionized absorption model. The xabs*cabs and redden components are turned off for the OIR and X-ray data, respectively, by fixing the column densities and reddening factor at negligibly small values.
The condition that we try to model is quite complicated. We simply approximate the observed steep power-law component by the soft thermal Comptonization component included in the optxrplir model. It assumes that the seed photons originate in the disk blackbody emitted from the inner disk region at radii within and that they are scatted by a one-zone cloud with given and . However, the real location, geometry and internal structure of the Comptonized plasma are unknown. The origin of that component could be a dense corona or a hot flow located in the X-ray emitting region, or perhaps a Compton-thick disk wind in the outer disk region that strongly down-scatters X-ray photons and modifies the intrinsic spectral shape (see Section IV). Thermal Compton scattering in an optically-thick cloud with arbitrary structures has not been prepared as an XSPEC model, and it is difficult to fit the SED directly with realistic models. Moreover, we use one-zone homogeneous ionized absorption and scattering models to describe the disk wind, but the real structure would be more complex. The main purpose of this analysis is not obtaining the precise values of the fit parameters, but investigating whether and how much optically-thick Compton scattering can reconcile the huge discrepancy shown in Figure 3. Numerical calculation of radiative transfer employing various structures of the Comptonized cloud and disk wind would be needed for more detailed studies, which is beyond the scope of this article. We leave it as a future work.
We find that the multi-wavelength SED can be characterized by the above model consisting of a disk with a luminosity of and a optically-thick, low-temperature Comptonization with and keV. Figure 5 plots the comparison of the data and the model, and Figure 6 presents the same model corrected for neutral/photoionized absorptions and extinction. The column density of the cabs and xabs model is estimated to be cm-2 and of the photoionized absorber is erg cm s-1. In this analysis, we have assumed that the outer disk emission is always seen in the OIR bands without obscuration. It could be partially hidden, however, if an optically-thick wind is present between the inner and outer disk regions. In this case, the intrinsic luminosity can be larger and the value estimated above can be regarded as a lower limit. We find that, when the normalization of the kerrconv*optxrplir component in the OIR bands is set to half of that in the X-ray band, the intrinsic disk luminosity goes up to . The model can still reproduce the observed X-ray spectrum by changing (which can be regarded as the strength of the soft thermal Comptonization component) from to 50 , and the column density of the xabs and cabs components to cm-2.
IV. Discussion
IV.1. The nature of the disk wind in GRO J165540
IV.1.1 Summary of the unusual behaviors
We have revisited the unusual wind detected with Chandra from the viewpoint of the long-term spectral and temporal evolutions in the X-ray and OIR bands. A number of peculiar behaviors were found to appear simultaneously in the hypersoft state around the Chandra observation, which are summarized as follows:
-
1.
The observed OIR fluxes are monotonically increasing, whereas the X-ray flux starts decreasing before the Chandra observation. The B-band vs. X-ray flux ratio marks the minimal value just around the Chandra observation.
-
2.
The observed disk luminosity becomes lower, while the inner disk temperature remains almost the same. The standard relation appears to break down (Done et al., 2007).
-
3.
The power-law tail seen in the high/soft state spectra is replaced by a low-temperature optically-thick Comptonized component, while the OIR SED keeps almost the same shape.
-
4.
The absorption feature at 8 keV is always seen, and it becomes deeper as the observed X-ray flux decreases (Uttley & Klein-Wolt, 2015).
-
5.
Rapid variability is reduced as the observed X-ray flux decreased. The high-frequency break in the X-ray PDS moves downwards from Hz to Hz. The break frequency correlates tightly with the observed 3–20 keV flux, while the energy dependence of the PSD shape is not strong (Uttley & Klein-Wolt, 2015).
These behaviors become most extreme at around the epoch of the wind detection with the Chandra/HETG. If they are not just a coincidence, they would be associated with the disk wind, since the ionized absorption feature always seen at keV suggests that the wind was steadily present in the hypersoft state.
IV.1.2 Interpretation of the long-term trend in the X-ray and OIR bands
As already discussed, the evolution of the OIR and X-ray fluxes cannot be explained by an increase of the mass accretion rate alone. In this case, the X-ray flux should have monotonically increased as well as the OIR fluxes. The decrease of the X-ray flux is too large to be canceled out by absorption and/or mass loss in the optically-thin disk wind detected with Chandra. It is also unlikely that an additional contribution from synchrotron emission from jets led to increase the OIR fluxes, since Migliari et al. (2007) suggest that jets were quenched in the hypersoft state.
One possible interpretation of the high OIR versus X-ray flux ratio in the hypersoft state is that reprocessed emission from the outer disk became stronger than the normal high/soft state. As discussed in Gierliński et al. (2009), powerful disk winds can enhance the irradiation of the disk. The flux ratio at the Chandra epoch could be explained if , which is scaled with , was 4 times larger than that in the normal high/soft state. This means that, if was constant, is 0.4 in the hypersoft state. This value seems somewhat too large, given that no strong emission lines are seen in the Chandra spectrum. Instead, a factor of 4 increase in may be achieved if decreased somehow in the hypersoft state. It may be also possible that the actual and values in the normal high/soft state are smaller than what we estimated and that increased in the hypersoft state. As explained in Section 3.2.2, we cannot constrain and simultaneously, and we simply fixed at 0.1 in modeling the high/soft state spectrum. However, the launching radius of the wind estimated in Miller et al. (2008) is relatively small and thus its temperature is much higher than the outer edge of the disk, around which the OIR photons are emitted (see Section 3.2.3). It is difficult for the disk emission enhanced by that wind to contribute to the OIR fluxes, unless we consider an unusually large emitting region.
In addition, the larger- interpretation alone cannot explain the peculiar behavior of the soft X-ray spectrum in the hypersoft state. If this were the case, the observed X-ray spectrum should directly reflect the intrinsic disk emission, and the trend in the disk luminosity versus inner disk temperature should indicate that the inner disk structure in the hypersoft state is different from that in the high/soft state, in which the inner edge of the standard disk is believed to extend to the ISCO stably (e.g., Ebisawa et al., 1993; Steiner et al., 2010; Shidatsu et al., 2011a). Some previous studies suggest that the disk is truncated at similar luminosities: in the bright low/hard state above (e.g., Done et al., 2007; Shidatsu et al., 2011b; Yamada et al., 2013; Kolehmainen et al., 2014; Shidatsu et al., 2014; Plant et al., 2015) and in the very high state (Tamura et al., 2012; Hori et al., 2014) over (Kubota & Makishima, 2004). However, the properties of the hypersoft state are nothing like these states; the X-ray spectra in the hypersoft state are much softer and the variability power on time scales of 0.01–10 s is more than one order of magnitude lower (see e.g., McClintock & Remillard, 2006; Done et al., 2007, for spectral and timing properties in each state). Moreover, disk truncation in these states produces a larger disk luminosity with a fixed inner temperature, which is the opposite behavior to that observed in the hypersoft state.
Instead, the evolution of the multi-wavelength SED could better described if is not so largely changed between the high/soft and hypersoft states and obscuring gas is present between the inner and outer disk regions, intercepting the line of sight and significantly reducing the observed X-ray luminosity. The obscuring material could be located in an equatorial disk wind. Strong Compton scattering in disk winds can reduce the intrinsic flux significantly, when we view them from a high inclination. Recent radiative transfer calculations have suggested that the scattered/reflected component of massive winds significantly contributes to the observed SEDs (Sim et al., 2010a, b). Some observational hints of wind reprocessing have already been found in low-mass X-ray binaries (Díaz Trigo et al., 2012, 2014) implying that broad emission lines, blended with absorption features, could be explained by the reprocessed component of the winds. In our case, however, the Compton-thick part in the wind would be almost completely ionized. Such a wind can scatter out and reduce the intrinsic X-ray photons in the line of sight, without changing the spectral shape in the soft X-ray band nor generating additional significant atomic absorption and/or emission structures. As shown by our SED analysis in Section III, this scenario can well explain the unusual trend in the disk spectrum. Using the OIR fluxes as a tracer of the reprocessed luminosity in the outer disk, we have demonstrated that the apparent X-ray flux at the Chandra epoch can be 1 order of magnitude lower than what is expected.
Similar very soft X-ray spectra with no or only a weak non-thermal power-law component are sometimes observed in other BH low-mass X-ray binaries, such as GRS 1915105, XTE J1550564, and GX 3394 (e.g., Kubota & Makishima, 2004; Zdziarski & Gierliński, 2004), in their brightest phase. They appear in the luminosity range from to , which is consistent with the luminosity of GRO J165540 at the Chandra epoch that we estimated in the SED modeling. In previous works, the faint and/or steep power-law tail above 10 keV was usually considered to be produced in the inner disk region, and the entire X-ray spectra in that phase were often reproduced by models composed of the standard disk and its Comptonized corona, or the so-called slim disk model, which describes accretion flows at very high mass accretion rates.
In the case of GRO J165540, the scattered-in component of the Compton-thick disk wind could also contribute to the observed Comptonization component. The Compton temperature of the disk wind is estimated to be 1 keV, by assuming the unabsorbed optxrplir model in Figure 6 as the intrinsic spectrum. This is comparable to the electron temperature of the soft Comptonization component. The fairly large difference between the optical depths of the scattered-in component (, modeled by optxrplir) and the scattered-out component (, estimated from the column density of the cabs model, cm-2), may suggest that different Comptonization components contribute to the soft component. However, considering uncertainties in the spectral modeling, we do not rule out the possibility that the total flux of the soft component is explained by scattering in the disk wind alone. We also note that the irradiated-disk emission enhanced by this Compton-thick wind would not contribute to the OIR fluxes greatly. This is because the wind is likely located at a much smaller radius than the outer edge of the disk (see the next section) and the relatively high disk temperature at that position requires a too large solid angle to produce the observed OIR emission (see also Section 3.2.3).
IV.1.3 Where is the hidden Compton-thick wind located?
Considering the definition of the ionization parameter, we can constrain the position of the Compton-thick, almost completely ionized part in the disk wind, with respect to the less ionized part producing absorption lines. The radial dependence of the ionization parameter is derived from Equation (2) as . If the density profile can be written as , a wind is more ionized at larger radii under the condition , while it has the opposite dependence when . The former condition can be established if the disk wind is accelerated in its outer parts. The mass loss rate is described as
| (4) |
where and represent the solid angle and velocity of the wind, respectively. A positive radial dependence of the outflow velocity corresponds to , when the mass loss rate and the solid angle are kept constant. Oppositely, the latter condition can be realized when the wind is decelerated.
The former case means that the Compton-thick region was located at a larger radius than that producing absorption lines, and that the latter part directly percepts the intrinsic X-ray luminosity. The luminosity that we estimated is about 20 times larger than the ionizing X-ray luminosity assumed in the photoionized plasma modeling in previous works. Since the launching radius depends on the square root of the ionizing luminosity (see Equation (2)), it can be larger than that estimated in Miller et al. (2008) by a factor of 4.4. In addition, radiation pressure reduces the local effective gravitational force by , and thereby the Compton radius is decreased by the same factor. Thus, the two factors can compensate the 1-order-of-magnitude difference between the wind launching radius estimated from the Chandra/HETG data and the minimum radius at which a thermal wind can be driven. The Compton temperature estimated from our SED model ( keV) gives the critical luminosity , and hence the intrinsic luminosity is sufficiently large to launch a thermal wind.
By contrast, the X-ray photons illuminating the less ionized part of the wind should be already reduced in the latter case, . We suggest this condition would be more plausible than , considering the column density of the scattered-out component ( cm-2). Approximating the density as , where is the size of the Compton-thick part in the line-of-sight direction, and assuming the ionized parameter of that part as erg cm s-1, we derive
| (5) |
This value is smaller than the wind launching radius estimated by Miller et al. (2008). A similar trend in has recently been found in the re-analysis of the Chandra data by Miller et al. (2015). From a detailed analysis of the absorption line profile, they detected multiple components in the wind, where a more ionized part was located at a smaller radius.
After Miller et al. (2006) first reported the Chandra/HETG result, the unusual wind in GRO J165540 has been revisited many times from both the observational and theoretical points of view (Netzer, 2006; Miller et al., 2008; Kallman et al., 2009; Luketic et al., 2010; Neilsen & Homan, 2012; Higginbottom & Proga, 2015). Many previous studies were based on the assumption that the wind was optically thin and launched at a few percent of the Eddington luminosity, in constructing photoionized plasma models and performing hydrodynamic simulations. If the wind was Compton-thick and formed at near- or super-Eddington luminosity, the effects of scattering in the wind and radiation pressure should be considered to discuss the wind driving mechanism. As described above, the launching radius of a thermal driven wind is smaller at a higher luminosity because radiation pressure reduces the effective gravity. A radiation pressure driven wind can be launched at even smaller radii above Eddington luminosity. Further numerical simulations and radiation transfer calculations at high mass accretion rates including the effects of Compton scattering would be needed to test whether a Compton-thick, almost completely ionized wind can be really launched and reproduce the observed properties.
IV.1.4 X-ray short-term timing properties
Similar hypersoft X-ray spectra are sometimes detected in the high-mass X-ray binary Cyg X-3 as well (Koljonen et al. 2010; see Uttley & Klein-Wolt 2015 for comparison of the two sources). This system always exhibits peculiar spectral states and lacks rapid variability on shorter time scales than 0.1 Hz. Zdziarski et al. (2010) succeeded in describing spectral shapes and the timing properties in Cyg X-3 by considering Compton-thick scattering plasma, likely formed by dense stellar winds from its Wolf-Rayet companion star, with a low temperature (3 keV) and a large optical depth () like those of the observed thermal Comptonization component in GRO J165540. They found that the break frequency () in the X-ray PDS is scaled by the size () and the optical depth of the scattering cloud that reduces the intrinsic fast variability, through the following relation:
| (6) |
This could be applied to GRO J165540 in the hypersoft state, if its low break frequency is caused by scattering in the Compton-thick disk wind. Using the optical depth for scattering in the line of sight () and the break frequency (0.1 Hz) at the Chandra epoch, we derive the size of the scattering gas to be cm, corresponding to . This value is much larger than the radius of the Compton-thick wind estimated in Section IV.1.3 and appears to favor a different interpretation that the Compton-thick gas extends to the outermost disk region. We note, however, that there are other possible explanations for the suppression of the short-term X-ray variations in the hypersoft state. As discussed in Uttley & Klein-Wolt (2015), the PDS profile may be generated by the intrinsic variation of the accretion flow, or variable scattering in the wind due to density inhomogeneities (see Section IV.3).
IV.2. A previously detected wind in GRO J165540
A similar or more extreme disk wind might be observed in a previous outburst as well. The first detection of ionized absorption lines in GRO J165540 was brought by Advanced Satellite for Cosmology and Astrophysics (ASCA; Tanaka et al. 1994) in the outburst starting from 1994 (Ueda et al., 1998). Ionized Fe-K absorption lines were detected in two epochs, when the source exhibited similar X-ray continuum spectra but had different observed X-ray fluxes by about one order of magnitude. The ionized absorber was more ionized when the source was brighter, as was seen in the 2005 outburst (Díaz Trigo et al., 2007; Neilsen & Homan, 2012). The observed X-ray flux in the Chandra observation falls between those at the two epochs reported by Ueda et al. (1998).
A sudden flux drop was detected in the ASCA observation at the lower flux (in 1994 August). The duration of the event was several hours, which was much longer than those observed in different periods (on time scales of second or minute Kuulkers et al., 1998; Shaposhnikov et al., 2007). Interestingly, in this ”dip” event, the source kept almost the same continuum shape as outside it, unlike normal absorption dips in low-mass X-ray binaries, which accompany spectral hardening (e.g., Kuulkers et al., 1998; Homan et al., 2005; Díaz Trigo et al., 2006; Kuulkers et al., 2013; Shidatsu et al., 2013). In the dipping period, the ionized Fe-K absorption lines disappeared, while a deep absorption edge appeared at 7 keV. This spectral behavior, which was described with double partial-covering absorbers in Tanaka et al. (2003), is reminiscent of the behavior during the hypersoft state in the 2005 outburst. The similarity might suggest that the unusual ”dip” event was produced by absorption and scattering in a more extreme wind with an even larger column density and an lower ionization parameter than that observed in 2005, and that a large fraction of the intrinsic X-ray photons was scattered out in the wind. There is, however, no information of the spectral shape in the hard X-ray band above 10 keV for the ASCA data, hampering further comparison.
IV.3. Implications for disk winds in other luminous X-ray binaries
If these peculiar behaviors in GRO J165540 seen around the Chandra observation are indeed attributed to an optically-thick disk wind launched at a luminosity close to the Eddington limit, they would carry important implications to massive winds thought to be formed at extreme mass accretion rates. Recent radiation (magneto-)hydrodynamic simulations predict radiation-pressure dominated, optically-thick disk winds to be driven in supercritical accretion disks (e.g., Ohsuga et al., 2005; Ohsuga & Mineshige, 2011; Dotan & Shaviv, 2011). Although the ionized Fe-K absorption lines like those observed in Galactic BH binaries have never been observed in ultraluminous X-ray sources (ULXs; Walton et al., 2012, 2013), Middleton et al. (2014) argued that uneven spectral structures often seen at 1 keV could be explained by broad blueshifted absorption lines. Recent deep optical spectroscopy revealed that the broad emission lines of H and He observed in ULXs (and also SS 433, which is the only known Galactic X-ray binary thought to power persistent supercritical accretion; see Fabrika 2004 and references therein) likely originate in dense, strong winds launched on supercritical accretion disks (Fabrika et al., 2015)444We note that these optical emission lines were emitted from much less ionized gas, presumably located at more distant parts in the winds than the optically-thick wind in GRO J165540 that we have considered.. Moreover, Gladstone et al. (2009) suggest that massive optically-thick winds could be the origin of the soft Comptonization component usually detected in ULXs. It has a low temperature (3 keV) and a large optical depth (–), similar to those estimated for the thermal Comptonization component in GRO J165540. Thus, the unusual GRO J165540 wind, formed at around the Eddington luminosity, may be smoothly connected to massive outflows from supercritical accretion flows. More recently, Soria & Kong (2015) and Urquhart & Soria (2015) have proposed a unified picture of the ULXs and the ultraluminous supersoft X-ray sources (ULSs, whose spectra are dominated by a blackbody-like component with a temperature of keV and have no hard tail), in terms of the effective optical depth () of the supercritical winds: in ULSs, the winds are effectively optically thick and we see only a blackbody emission, while ULX winds are optically thick to Compton scattering but , and thus produce a Comptonized component in the X-ray band. We note that in the case of GRO J165540, when a temperature of 1 keV and a density of cm-3 are assumed to estimate the opacity of free-free absorption in the wind.
Recent simulations by Takeuchi et al. (2013) demonstrated that the winds driven by supercritical accretion have a clumpy structure, which can generate variability. Spectral/flux variation in ULXs that could be explained by the clumpy disk winds has been observed on various wavelengths and time scales, such as X-ray flux on a time scale of several tens of second (Middleton et al., 2011) and optical emission lines on 1-day time scales (Fabrika et al., 2015). As pointed out by Uttley & Klein-Wolt (2015), the clumpiness of the wind may contribute to the observed evolution of high-frequency variability in GRO J165540. If the disk wind have the Keplerian velocity in the rotating direction, 0.1-s and 10-s variations correspond to the blob sizes of and located at , respectively. If the bend in the X-ray PDSs is produced by the absorption and scattering in a clumpy wind, variability at a lower frequency is generated by blobs with a larger size and/or located at a larger radius on the disk. In this case, the wind in the Chandra observation should have the largest blobs or be located at the most outer region during the hypersoft state, although it is not clear what are the mechanisms that made change the geometry and/or inner structures of the wind.
Wind absorption and scattering may also significantly affect the spectra of normal Galactic BH X-ray binaries, when they get close to the Eddington luminosity. At high luminosities, the dependence of the disk luminosity () on the inner disk temperature () in the high/soft state start departing from the track for the untruncated standard disk (see Done et al., 2007). High inclination sources with absorption dips and winds, including GRO J165540 and 4U 163047, deviate downward from the relation in the vs. plane with increasing luminosity, while low inclination systems like GX 3394 and LMC X-3 do not show such a bend but sometimes go slightly upward. This apparent inclination-dependent discrepancy might be associated with optically-thick disk winds and explained as follows: in high inclination sources, we see the inner disk region through the disk wind, and the intrinsic X-ray emission is reduced due to scattering out of the line of sight. In contrast, lower inclination sources have larger contribution of the components scattered into the line of sight, which enhance the X-ray emission from the inner disk region. Moreover, Compton down-scattering in the wind could decrease the observed inner disk temperature. If this is the case, the winds should be almost fully ionized, otherwise significant emission and absorption lines could be seen in low and high inclination systems, respectively. The intrinsic luminosity at the Chandra epoch that we estimated is consistent with the energy range that the deviation is seen in other systems, and the GRO J165540 wind may be linked to that behavior as an extreme case.
V. Conclusion
In this article, we proposed the possibility that the unusual wind in GRO J165540 was Compton-thick and almost completely ionized. We demonstrated that the multi-wavelength SED can be reproduced by considering the effects of scattering in the wind. We found that the intrinsic luminosity could be close to or above Eddington, which is much higher than that inferred from the observed X-ray flux. If this is the case, Compton heating and radiation pressure could be more important to drive the wind. To test this possibility, detailed radiation transfer calculation should be made by fully taking into account the effects of scattering in the wind.
We note a paper by Neilsen et al. (2016), which has appeared very recently. They analyzed X-ray and OIR data of GRO J1655-40 obtained in the similar period and drew a similar conclusion to ours that the wind was Compton thick. Their interpretation is that the wind was much more powerful and launched at much more extreme mass accretion rate ( times as high as the Eddington rate) than that in our interpretation, and that most of the observed OIR fluxes in the hypersoft state were produced by the emission from the cool photosphere of the wind itself, instead of the emission from irradiated disk. As discussed in Section 3.2.3, the wind in our model is likely to be optically thin for free-free absorption in the OIR bands, but such a dense wind as suggested by Neilsen et al. (2016) may be effectively thick in the OIR bands and generate blackbody emission.
References
- Begelman et al. (1983) Begelman, M. C., McKee, C. F., & Shields, G. A. 1983, ApJ, 271, 70
- Bohlin et al. (1978) Bohlin, R. C., Savage, B. D., & Drake, J. F. 1978, ApJ, 224, 132
- Boirin et al. (2005) Boirin, L., Méndez, M., Díaz Trigo, M., Parmar, A. N., & Kaastra, J. S. 2005, A&A, 436, 195
- Boirin & Parmar (2003) Boirin, L., & Parmer, A. N. 2003, A&A, 407, 1079
- Brenneman & Reynolds (2006) Brenneman, L. W., & Reynolds, C. S. 2006, ApJ, 652, 1028
- Buxton & Bailyn (2004) Buxton, M., & Bailyn, C. 2004, ApJ, 615, 880
- Buxton et al. (2005) Buxton, M., Bailyn, C., & Maitra, D. 2005, ATel, #418, 1
- Corbel & Fender (2002) Corbel, S., & Fender, R. P. 2002, ApJ, 573, L35
- Coriat et al. (2009) Coriat, M., Corbel, S., Buxton, M. M., et al. 2009, MNRAS, 400, 123
- Cunningham (1976) Cunningham, C. 1976, ApJ, 208, 534
- Díaz Trigo et al. (2006) Díaz Trigo, M., Parmar, J., Boirin, L., Méndez, M., & Kaastra, J. S. 2006, A&A, 445, 179
- Díaz Trigo et al. (2007) Díaz Trigo, M., Parmar, A. N., Miller, J., Kuulkers, E., & Caballero-García, M. D. 2007, A&A, 462, 657
- Díaz Trigo et al. (2009) Díaz Trigo, M., Parmar, A. N., Boirin, L., et al. 2009, A&A, 493, 145
- Díaz Trigo et al. (2012) Díaz Trigo, M., Sidoli, L., Boirin, L., & Parmar, A. N. 2012, A&A, 543, 50
- Díaz Trigo & Boirin (2013) Díaz Trigo, M., & Boirin, L. 2013, Acta Polytechnica, 53, 659
- Díaz Trigo et al. (2014) Díaz Trigo, M., Migliari, S., Miller-Jones, J. C. A., & Guainazzi, M. 2014, A&A, 571, 76
- Done et al. (2007) Done, C., Gierliński, M., & Kubota, A. 2007, A&A Rev., 15, 1
- Done et al. (2012) Done, C., Davis, S. W., Jin, C., Blaes, O., & Ward, M. 2012, MNRAS, 420, 1848
- Done et al. (2013) Done, C., Jin, C., Middleton, M., & Ward, M. 2013, MNRAS, 434, 1955
- Dotan & Shaviv (2011) Dotan, C., & Shaviv, N. J. 2011, MNRAS, 413, 1623
- Ebisawa et al. (1993) Ebisawa, K., Makino, F., Mitsuda, K., et al. 1993, ApJ, 403, 684
- Fabrika et al. (2015) Fabrika, S., Ueda, Y., Vinokurov, A., Sholukhova, O., & Shidatsu, M. 2015, Nature Physics, 11, 551
- Fabrika (2004) Fabrika, S. 2004, Astrophysics and Space Physics Reviews, 12, 1
- Frontera et al. (2001) Frontera, F., Palazzi, E., Zdziarski, A. A., et al. 2001, ApJ, 546, 1027
- Gandhi et al. (2010) Gandhi, P., Dhillon, V. S., Durant, M., et al. 2010, MNRAS, 407, 2166
- Gierliński et al. (2008) Gierliński, M., Done, C., & Page, K. 2008, MNRAS, 388, 753
- Gierliński et al. (2009) Gierliński, M., Done, C., & Page, K. 2009, MNRAS, 392, 1106
- Gladstone et al. (2009) Gladstone, J. C., Roberts, T. P., & Done, C. 2009, MNRAS, 397, 1836
- Greene et al. (2001) Greene, J., Bailyn, C. D., & Orosz, J. A. 2001, ApJ, 554, 1290
- Higginbottom & Proga (2015) Higginbottom, N., & Proga, D. 2015, ApJ, 807, 107
- Hjellming & Rupen (1995) Hjellming, R. M., & Rupen, M. P. 1995, Nature, 375, 464
- Homan et al. (2005) Homan, J., Miller, J. M., Wijnands, R., et al. 2005, ApJ, 623, 383
- Hori et al. (2014) Hori, T., Ueda, Y., Shidatsu, M., et al. 2014, ApJ, 790, 20
- Hynes et al. (2003) Hynes, R. I., Haswell, C. A., Cui, W., et al. 2003, MNRAS, 345, 292
- Ibragimov et al. (2005) Ibragimov, A., Poutanen, J., Gilfanov, M., Zdziarski, A. A. & Shrader, C. R. 2005 MNRAS, 362, 1435
- Kallman et al. (2009) Kallman, T. R., Bautista, M. A., Goriely, S., et al. 2009, ApJ, 701, 865
- Kolehmainen et al. (2014) Kolehmainen, M., Done, C., & Díaz Trigo, M. 2014, MNRAS, 437, 316
- Koljonen et al. (2010) Koljonen, K. I. I., Hannikainen, D. C., McCollough, M. L., Pooley, G. G., & Trushkin, S. A. 2010, MNRAS, 406, 307
- Kotani et al. (2000) Kotani, T., Ebisawa, K., Dotani T., et al. 2000, ApJ, 539, 413
- Kubota et al. (2007) Kubota, A., Dotani, T., Cottam, J., et al. 2007 PASJ, 59, 185
- Kubota & Makishima (2004) Kubota, A., & Makishima, K. 2004, ApJ, 601, 428
- Kuulkers et al. (1998) Kuulkers, E., Wijnands, R., Belloni, T., et al. 1998, ApJ, 494, 753
- Kuulkers et al. (2013) Kuulkers, E., Kouveliotou, C., Belloni, T., et al. 2013, A&A, 552, 32
- Luketic et al. (2010) Luketic, S., Proga, D., Kallman, T. R., Raymond, J. C., & Miller, J. M. 2010, ApJ, 719, 515
- McClintock & Remillard (2006) McClintock, J. E., & Remillard, R. A. 2006, in Compact Stellar X-Ray Sources, ed. W. H. G., Lewin & M. van der Klis (Cambridge: Cambridge Univ. Press), 157
- Middleton et al. (2011) Middleton, M. J., Roberts, T. P., Done, C., & Jackson, F. E. 2011, MNRAS, 411, 644
- Middleton et al. (2014) Middleton, M. J., Walton, D. J., Roberts, T. P., & Heil, L. 2014, MNRAS, 438, L51
- Migliari et al. (2007) Migliari, S., Tomsick, J. A., Markoff, S. et al. 2007, ApJ, 670, 610
- Miller et al. (2006) Miller, J. M., Raymond, J., Fabian, A. C., et al. 2006, Nature, 441, 953
- Miller et al. (2008) Miller, J. M., Raymond, J., Reynolds, C. S., et al. 2008, ApJ, 680, 1359
- Miller et al. (2015) Miller, J. M., Fabian, A. C., Kaastra, J. S., et al. 2015, ApJ, 814, 87
- Mitsuda et al. (1984) Mitsuda, K., Inoue, H., Koyama, K., et al. 1984, PASJ, 36, 741
- Nakahira et al. (2012) Nakahira, S., Koyama, S., & Ueda, Y., et al. 2012, PASJ, 64, 13
- Neilsen & Lee (2009) Neilsen, J., & Lee, J. C. 2009, Nature, 458, 481
- Neilsen et al. (2011) Neilsen, J., Remillard, R. A., & Lee, J. C. 2011, ApJ, 737, 69
- Neilsen & Homan (2012) Neilsen, J., & Homan, J. 2012, ApJ, 750, 27
- Neilsen et al. (2016) Neilsen, J., Rahoui, F., Homan, J., & Buxton, M. 2016, ArXiv:1603.04070
- Netzer (2006) Netzer, H. 2006, ApJ, 652, 117
- Novikov & Thorne (1973) Novikov, I. D., & Thorne K. S. 1973, in Black Holes, ed. C., Dewitt, & B. S., Dewitt, (New York: Gordon & Breach), 343
- Ohsuga et al. (2005) Ohsuga, K., Mori, M., Nakamoto, T., & Mineshige, S. 2005, ApJ, 628, 368
- Ohsuga & Mineshige (2011) Ohsuga, K., & Mineshige, S. 2011, ApJ, 736, 2
- Orosz & Bailyn (1997) Orosz, J. A., & Bailyn, C. D. 1997, ApJ, 477, 876
- Plant et al. (2015) Plant, D. S., Fender, R. P., Ponti, G., Muñoz-Darias, T., Coriat, M. 2015, A&A, 573, 120
- Ponti et al. (2012) Ponti, G., Fender, R. P., Begelman, M. C., et al. 2012, MNRAS, 422, L11
- Poutanen & Veledina (2014) Poutanen, J., & Veledina, A. 2014, Space Sci. Rev., 183, 61
- Poutanen et al. (2014) Poutanen, J., Veledina, A., & Revnivtsev, M. G. 2014, MNRAS, 445, 3987
- Russell et al. (2007) Russell, D. M., Fender, R. P., & Jonker, P. G. 2007, MNRAS, 379, 1108
- Shahbaz et al. (1998) Shahbaz, T., Charles, P. A., & King, A. R. 1998, MNRAS, 301, 382
- Shahbaz et al. (1999) Shahbaz, T., van der Hooft, F., Casares, J., Charles, P. A., & van Paradijs, J. 1999 MNRAS, 306, 89
- Shaposhnikov et al. (2007) Shaposhnikov, N., Swank, J., Shrader, C. R., et al. 2007, ApJ, 655, 434
- Shidatsu et al. (2011a) Shidatsu, M., Ueda, Y., Nakahira, S., et al. 2011a, PASJ, 63, 803
- Shidatsu et al. (2011b) Shidatsu, M., Ueda, Y., Tazaki, F., et al. 2011b, PASJ, 63, 785
- Shidatsu et al. (2013) Shidatsu, M., Ueda, Y., Nakahira, S., et al. 2013, ApJ, 779, 26
- Shidatsu et al. (2014) Shidatsu, M., Ueda, Y., Yamada, S., et al. 2014, ApJ, 789, 100
- Sim et al. (2010a) Sim, S. A., Miller, L., Long, K. S., Turner, T. J., & Reeves, J. N. 2010, MNRAS, 404, 1369
- Sim et al. (2010b) Sim, S. A., Proga, D., Miller, L., Long, K. S., & Turner, T. J. 2010, MNRAS, 408, 1396
- Soria & Kong (2015) Soria, R., & Kong, A. K. H. 2015, MNRAS, in press
- Steiner et al. (2010) Steiner, J. F., McClintock, J. E., Remillard, R. A., et al. 2010, ApJ, 718, L117
- Sutton et al. (2014) Sutton, A. D., Done, C., & Roberts, T. P. 2014, MNRAS, 444, 2415
- Takahashi et al. (2008) Takahashi, H., Fukazawa, Y., Mizuno, T., et al. 2008, PASJ, 60, 69
- Takeuchi et al. (2013) Takeuchi, S., Ohsuga, K., & Mineshige, S. 2013, PASJ, 65, 88
- Tamura et al. (2012) Tamura., M., Kubota, A., Yamada, S., et al. 2012, ApJ, 753, 65
- Tanaka et al. (1994) Tanaka, Y., Inoue, H., & Holt, S. S. 1994, PASJ, 46, L37
- Tanaka et al. (2003) Tanaka, Y., Ueda, Y., & Boller, T. 2003, MNRAS, 338, L1
- Ueda et al. (1998) Ueda, Y., Inoue, H., Tanaka, Y., et al. 1998, ApJ, 492, 782
- Ueda et al. (2001) Ueda, Y., Asai, K., Yamaoka, K., Dotani, T., & Inoue, H. 2001 ApJ, 556, L87
- Ueda et al. (2009) Ueda, Y., Yamaoka, K., & Remillard, R. 2009 ApJ, 695, 888
- Ueda et al. (2010) Ueda, Y., Honda, K., Takahashi, H., et al. 2010, ApJ, 713, 257
- Urquhart & Soria (2015) Urquhart, R., & Soria, R. 2015, MNRAS, in press
- Uttley & Klein-Wolt (2015) Uttley, P., & Klein-Wolt, M. 2015, MNRAS, 451, 475
- van Paradijs (1981) van Paradijs, J. 1981, A&A, 103, 140
- van Paradijs (1983) van Paradijs, J. 1983, in Accretion-Driven Stellar X-ray Sources, ed. Lewin, W. H. G., & van den Heuvel, E. P. J. (Cambridge: Cambridge Univ. Press), 189
- Veledina et al. (2013) Veledina, A., Poutanen, J., & Vurm, I. 2013, MNRAS, 430, 3196
- Veledina et al. (2015) Veledina, A., Revnivtsev, M. G., Durant, M., Gandhi, P. & Poutanen, J. 2015, MNRAS, 454, 2855
- Walton et al. (2012) Walton, D. J., Miller, J. M., Reis, R. C., & Fabian, A. C. 2012, MNRAS, 426, 473
- Walton et al. (2013) Walton, D. J., Miller, J. M., Harrison, F. A., et al. 2013, ApJ, 773, L9
- Wilms et al. (2000) Wilms, J., Allen, A., & McCray, R. 2000, ApJ, 542, 914
- Woods et al. (1996) Woods, D. T., Klein, R. I., Castor, J. I., McKee, C. F., & Bell, J. B. 1996, ApJ, 461, 767
- Yamada et al. (2013) Yamada, S., Makishima, K., Done, S., et al. 2013, PASJ, 65,80
- Yamaoka et al. (2001) Yamaoka, K., Ueda, Y., Inoue, H., et al. 2001, PASJ, 53, 179
- Zdziarski & Gierliński (2004) Zdziarski, A. A., & Gierliński, M. 2004, 4, Prog. Theor. Phys. Suppl., 155, 99
- Zdziarski et al. (2010) Zdziarski, A. A., Misra, R., & Gierliński, M. 2010, MNRAS, 402, 767