Theory of intraband plasmons in doped carbon nanotubes:
rolled surface-plasmons of graphene
Abstract
A single-wall carbon nanotube possesses two different types of plasmons specified by the wavenumbers in the azimuthal and axial directions. The azimuthal plasmon that is caused by interband transitions has been studied, while the effect of charge doping is unknown. In this paper, we show that when nanotubes are heavily doped, intraband transitions cause the azimuthal plasmons to appear as a plasmon resonance in the near-infrared region of the absorption spectra, which is absent for light doping due to the screening effect. The axial plasmons that are inherent in the cylindrical waveguide structures of nanotubes, account for the absorption peak of the metallic nanotube observed in the terahertz region. The excitation of axial (azimuthal) plasmons requires a linearly polarized light parallel (perpendicular) to the tube’s axis.
pacs:
78.67.Ch, 73.63.fg, 73.20.MfA carbon nanotube (CNT) has a notable optical property. Iijima (1991); Saito et al. (1992) Namely, a CNT exhibits the absorption peaks of light with linear polarization parallel to the tube’s axis, but not for the linear polarization perpendicular to it. Ichida et al. (2004) This optical anisotropy of a CNT is essential for characterizing a sample using Raman spectroscopy and for realizing polarized optical devices. Dresselhaus et al. (2010) In this paper we show that when a CNT is heavily doped, many of the absorption peaks of parallel polarized light disappear due to the Pauli exclusion principle, and this causes an absorption peak of a perpendicularly polarized light to appear in the near-infrared region. This peak is a plasmon resonance that corresponds to the surface plasmon of graphene with the wavelength on the order of nanometer. Stern (1967); Wunsch et al. (2006); Hwang and Das Sarma (2007); Jablan et al. (2009)
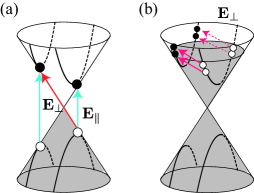
The light polarization dependence of an undoped CNT is explained in terms of the optical selection rule and screening effect. Ajiki and Ando (1994) The selection rule states that a parallel (perpendicularly) polarized light induces direct (indirect) interband transitions, see Fig. 1(a). Sasaki et al. (2011) Although indirect transition of perpendicularly polarized light is allowed by the selection rule, it is suppressed by the screening effect by a plasma mode whose frequency is much larger than that of the excitation of an indirect transition (i.e., ). Namely, the external electric field () is screened to give a small total electric field ():
| (1) |
By assuming that of is approximately 5 eV for -plasmon in an undoped CNT, Stéphan et al. (2002); García de Abajo (2010) is strongly suppressed and there is almost no absorption of near-infrared light.
The heavy doping into a CNT changes the situation: doping can activate intraband transitions between two energy sub-bands (with different orbital angular momentums around the tubule axis) by a weak perturbation at low energy (see Fig. 1(b)). We find that the azimuthal motion of the electrons due to these intraband transitions causes a plasma mode to appear in a heavily doped CNT. This plasma mode originates from the surface plasmons in graphene studied in Ref. Stern, 1967; Wunsch et al., 2006; Hwang and Das Sarma, 2007; Jablan et al., 2009. The angular frequency of the surface plasmons in graphene is given by
| (2) |
where is the permittivity of the surrounding material, is the relaxation time, is the static conductivity, and is a two-dimensional wavevector. Stern (1967); Wunsch et al. (2006); Hwang and Das Sarma (2007); Jablan et al. (2009) Considering a CNT instead of graphene, we see that there are two distinct plasmon modes, depending on the orientations of the wavevector ; one mode with in the azimuthal direction of a cylinder is called azimuthal plasmon mode, and the other with parallel to the axial direction is an axial plasmon mode (see the top panels of Fig. 2). In the cylindrical coordinates , they have the form of the plane waves and , respectively. The azimuthal mode shown in Fig. 2(a) has only three components of the electromagnetic (EM) fields (). The unique nonzero magnetic field is perpendicular to the azimuthal direction. Similarly, the axial mode shown in Fig. 2(b) has a unique nonzero magnetic field that is perpendicular to the axial direction. These two modes are transverse magnetic (TM) modes.
The theoretical results presented in this paper were obtained analytically by solving Maxwell equations with Ohm’s law, i.e. for the azimuthal mode, and for the axial mode. Nakayama (1974) Let us mention here that the Drude model is used to specify the dynamical conductivity as , where the frequency dependence is controlled by the electronic relaxation times , and reduces to the static conductivities in the zero-frequency limit. The application of Drude model to a heavily doped CNT is partly justified by the polarization function. 111See supplemental material at [URL will be inserted by AIP] for details.
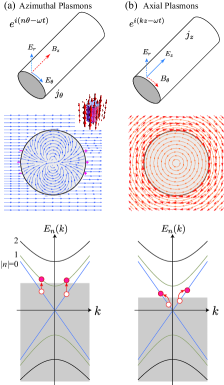
We now describe properties of azimuthal plasmons shown in Fig. 2(a). The calculated angular frequencies are
| (3) |
where is the wavenumber ( is a nonzero integer and is the radius of the CNT). Here, for the sake of clarity, the same materials with the permittivity are assumed to occupy the inner and outer spaces of the CNT. When different materials occupy the inner and outer spaces of the CNT, Eq. (3) can be generalized by replacing with , where () is the permittivity of the outer (inner) space. We note that Eq. (3) is identical to Eq. (2), if is replaced with .
Despite the similarity between the dispersion relations of a CNT and graphene, their EM fields exhibit different asymptotic behavior. Namely, the amplitude of the azimuthal TM mode in a CNT behaves as (extended) and this mode is not a localized surface plasmon, while the surface plasmon of graphene is exponentially localized in the direction normal to the layer. Nakayama (1974) The configuration of the electric field near a CNT is illustrated in Fig. 2(a,middle). We choose the fundamental mode with for the plot, because it is the principal state excited by a perpendicular polarization light. 222The excitation of the fundamental mode by perpendicular polarization matches the selection rule for the optical transitions in CNTs. Ajiki and Ando (1994) Some microscopic processes that contribute to the azimuthal TM mode () are shown in Fig. 2(a,bottom) and Fig. 1(b). These intraband optical transitions are properly described by the Drude model, and they arise only for heavy doping. Figure 2(a,middle) shows that an electric dipole forms in the inner space of a CNT, which can screen an external electric field with perpendicular polarization. Indeed, the amplitude of the TM mode in the presence of an external electric field, , is given by
| (4) |
Thus, the induced and external fields have a phase difference of at low frequencies (), and the total electric field (that the electrons in a CNT actually experience), defined by , is suppressed, as a result of the screening. On the other hand, is suppressed at high frequencies () and the CNTs can absorb the polarized light. When , the plasmons are resonantly excited and form a peak structure in the absorption spectrum.
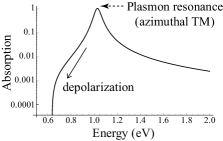
Plasmon excitation by near-infrared light requires a heavily doped CNT in which more than two energy sub-bands cross the Fermi energy, as shown in Fig. 2(a,bottom). Because a charge-density fluctuation that causes the plasmon excitation requires (almost) forward scatterings, Sasaki et al. (2012) that is, an intraband (vertical) transition between the electronic states with similar velocities, the Fermi energy should be located (at least) at higher than the bottom of the first sub-band. Such heavily doped CNTs are already available Kalbac et al. (2009); Hartleb et al. (2015) and absorption spectra have been obtained for them. Kazaoui et al. (1999); Igarashi et al. (2015) The authors of Refs. Kazaoui et al., 1999 and Igarashi et al., 2015 observed an unidentified absorption peak at approximately 1 eV. We attribute it to the azimuthal TM mode, because Eq. (3) satisfactorily reproduces the peak position, eV, when we use the values reported in Ref. Igarashi et al., 2015 ( fs, 333 The electron-phonon interaction of radial breathing modes may contribute to the lifetime , besides the electron-electron interaction. There is a strong similarity between the electron-phonon interaction for radial breathing modes and electron-electron interaction: both interactions are proportional to the identity matrix in the massless Dirac equation. Sasaki et al. (2008) As a result, the generation of a charge-density fluctuation that consists of a pair of electron and hole with different pseudospin orientations, such as in the backward scattering, is suppressed. To open the forward scattering channels, the Fermi energy should be located at higher than the bottom of the first sub-band. , and nm) with a realistic assumption , where is the conductance quantum. The factor 4 accounts for two azimuthal channels in each valley. 444The number of effective transport channels in a graphene is given by , where denotes the Fermi energy. When eV and fs, the value is approximately 10, which is comparable to the factor 4. The absorption spectrum is obtained by multiplying the total field with the dynamical conductivity as
| (5) |
We plot in Fig. 3. The calculated peak structure is consistent with the observation. Igarashi et al. (2015)
The azimuthal plasmon has an oscillating magnetic field that is parallel to the tube’s axis, , as shown in the inset of Fig. 2(a,middle). Since is a periodic function of (), the total magnetic flux inside the cylinder vanishes at any moment in time. As a result, the Aharonov-Bohm effect does not appear, Zaric (2004); Minot et al. (2004) and there is no notable change in the electric band structure of a CNT due to the azimuthal plasmons.
Next, we examine the axial plasmon shown in Fig. 2(b). The axial TM mode oscillates with an angular frequency,
| (6) |
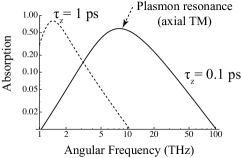
The dispersion is basically linear in (apart from the small dependence of the logarithm) and the waves are localized, which contrasts with the properties of the azimuthal TM mode. The existence of this massless propagating mode can be understood by regarding a metallic CNT as the small waveguide. Slepyan et al. (1999); Akima et al. (2006); Nakanishi and Ando (2009); Zhang et al. (2013) The group velocity can exceed the electron Fermi velocity for a metallic CNT with nm, ps, and , and the frequencies appear in the terahertz (THz) region. In Fig. 4, we show calculated THz absorption spectra that take account of the screening effect in the axial direction. The peak structure is consistent with several experiments. Akima et al. (2006); Zhang et al. (2013) Some microscopic processes in a metallic CNT that contribute to the axial current of the TM mode are shown in Fig. 2(b,bottom).
The parallel external electric field is screened by the axial TM mode. Note, however, that since the frequency of the axial TM mode is in the THz region, the screening is poor when is in the near-infrared region. As a result, a metallic CNT exhibits the absorption peaks of interband direct transitions such as M11.
Plasmons are generally sensitive to the environment. For example, the plasmonic property of a CNT changes when a metal is present near the CNT. Furthermore, since the azimuthal (axial) TM mode is an extended (localized) EM field, the absorption by the azimuthal mode is more sensitive to the environment than that by the axial mode. This might be relevant to the fact that the maximum absorbance of the unidentified peak (N-band) observed in Ref. Igarashi et al., 2015 for a doped case is smaller than that of the prominent peaks of the direct transitions for an undoped case. Contrastingly, the maximum attenuation of the broad peak in the THz region observed in Ref. Zhang et al., 2013 is similar to that of the prominent peaks of the direct transitions that appear in the near-infrared region.
In summary, we have theoretically shown that a heavily doped CNT absorbs a perpendicularly polarized light in the near-infrared region, in contrast to an undoped CNT where such an absorption is prohibited by the screening effect caused by a high-frequency plasmon. The change in the optical property is because a heavily doped CNT can support a low-frequency plasmon (azimuthal TM mode). On the other hand, when a parallel polarization light is used to excite a metallic CNT, the plasmon resonance of an axial TM mode propagating along the tube appears in the absorption spectrum in the terahertz region. These two plasmon modes correspond to the surface plasmon of graphene rolled up into a cylinder. Particularly, the azimuthal TM modes in ordinary CNTs with a diameter of close to 1 nanometer have an advantage over graphene in terms of wavelength down-conversion from visible light to nanoscale plasmons.
Acknowledgments
K. S. is indebted to R. Saito and H. Kataura.
References
- Iijima (1991) S. Iijima, Nature, 354, 56 (1991).
- Saito et al. (1992) R. Saito, M. Fujita, G. Dresselhaus, and M. S. Dresselhaus, Appl. Phys. Lett., 60, 2204 (1992).
- Ichida et al. (2004) M. Ichida, S. Mizuno, H. Kataura, Y. Achiba, and A. Nakamura, Applied Physics A, 78, 1117 (2004).
- Dresselhaus et al. (2010) M. S. Dresselhaus, A. Jorio, M. Hofmann, G. Dresselhaus, and R. Saito, Nano letters, 10, 751 (2010), ISSN 1530-6992.
- Stern (1967) F. Stern, Physical Review Letters, 18, 546 (1967), ISSN 0031-9007.
- Wunsch et al. (2006) B. Wunsch, T. Stauber, F. Sols, and F. Guinea, New Journal of Physics, 8, 318 (2006), ISSN 1367-2630.
- Hwang and Das Sarma (2007) E. H. Hwang and S. Das Sarma, Physical Review B, 75, 205418 (2007), ISSN 1098-0121.
- Jablan et al. (2009) M. Jablan, H. Buljan, and M. Soljačić, Physical Review B, 80, 245435 (2009), ISSN 1098-0121.
- Ajiki and Ando (1994) H. Ajiki and T. Ando, Physica B: Condensed Matter, 201, 349 (1994), ISSN 09214526.
- Sasaki et al. (2011) K.-i. Sasaki, K. Kato, Y. Tokura, K. Oguri, and T. Sogawa, Physical Review B, 84, 085458 (2011), ISSN 1098-0121.
- Stéphan et al. (2002) O. Stéphan, D. Taverna, M. Kociak, K. Suenaga, L. Henrard, and C. Colliex, Physical Review B, 66, 155422 (2002), ISSN 0163-1829.
- García de Abajo (2010) F. J. García de Abajo, Reviews of Modern Physics, 82, 209 (2010), ISSN 0034-6861.
- Nakayama (1974) M. Nakayama, J. Phys. Soc. Jpn., 36, 393 (1974).
- Sasaki et al. (2016) K.-i. Sasaki, S. Murakami, Y. Tokura, and H. Yamamoto, Physical Review B, 93, 125402 (2016), ISSN 2469-9950.
- Sasaki et al. (2012) K.-i. Sasaki, K. Kato, Y. Tokura, S. Suzuki, and T. Sogawa, Physical Review B, 86, 201403 (2012), ISSN 1098-0121.
- Kalbac et al. (2009) M. Kalbac, H. Farhat, L. Kavan, J. Kong, K.-i. Sasaki, R. Saito, and M. S. Dresselhaus, ACS Nano, 3, 2320 (2009), ISSN 1936-0851.
- Hartleb et al. (2015) H. Hartleb, F. Späth, and T. Hertel, ACS nano, 9, 10461 (2015), ISSN 1936-086X.
- Kazaoui et al. (1999) S. Kazaoui, N. Minami, R. Jacquemin, H. Kataura, and Y. Achiba, Physical Review B, 60, 13339 (1999), ISSN 0163-1829.
- Igarashi et al. (2015) T. Igarashi, H. Kawai, K. Yanagi, N. T. Cuong, S. Okada, and T. Pichler, Physical Review Letters, 114, 176807 (2015), ISSN 0031-9007.
- Zaric (2004) S. Zaric, Science, 304, 1129 (2004), ISSN 0036-8075.
- Minot et al. (2004) E. D. Minot, Y. Yaish, V. Sazonova, and P. L. McEuen, Nature, 428, 536 (2004), ISSN 1476-4687.
- Slepyan et al. (1999) G. Y. Slepyan, S. A. Maksimenko, A. Lakhtakia, O. Yevtushenko, and A. V. Gusakov, Physical Review B, 60, 17136 (1999), ISSN 0163-1829.
- Akima et al. (2006) N. Akima, Y. Iwasa, S. Brown, A. M. Barbour, J. Cao, J. L. Musfeldt, H. Matsui, N. Toyota, M. Shiraishi, H. Shimoda, and O. Zhou, Advanced Materials, 18, 1166 (2006), ISSN 0935-9648.
- Nakanishi and Ando (2009) T. Nakanishi and T. Ando, Journal of the Physical Society of Japan, 78, 114708 (2009), ISSN 0031-9015.
- Zhang et al. (2013) Q. Zhang, E. H. Hároz, Z. Jin, L. Ren, X. Wang, R. S. Arvidson, A. Lüttge, and J. Kono, Nano letters, 13, 5991 (2013), ISSN 1530-6992.
- Jishi et al. (1993) R. A. Jishi, M. S. Dresselhaus, and G. Dresselhaus, Physical Review B, 48, 11385 (1993), ISSN 0163-1829.
- Sasaki et al. (2008) K.-i. Sasaki, R. Saito, G. Dresselhaus, M. S. Dresselhaus, H. Farhat, and J. Kong, Physical Review B, 78, 235405 (2008), ISSN 1098-0121.