NGC6362: the least massive globular cluster with chemically distinct multiple populations 111Based on data obtained at the Very Large Telescope under the programs 073.D-0211 and 093.D-0618.
Abstract
We present the first measure of Fe and Na abundances in NGC 6362, a low-mass globular cluster where first and second generation stars are fully spatially mixed. A total of 160 member stars (along the red giant branch and the red horizontal branch) have been observed with the multi-object spectrograph FLAMES at the Very Large Telescope. We find that the cluster has an iron abundance of [Fe/H]=–1.090.01 dex, without evidence of intrinsic dispersion. On the other hand, the [Na/Fe] distribution turns out to be intrinsically broad and bimodal. The Na-poor and Na-rich stars populate, respectively, the bluest and the reddest red giant branches detected in the color-magnitude diagrams including the U filter. The red giant branch is composed of a mixture of first and second generation stars in a similar proportion, while almost all the red horizontal branch stars belong to the first cluster generation. Until now, NGC 6362 is the least massive globular cluster where both the photometric and spectroscopic signatures of multiple populations have been detected.
1 Introduction
Globular clusters (GCs) have long been considered the best example of a Simple Stellar Population, i.e., stellar systems formed of stars with the same age and initial chemical composition (Renzini & Buzzoni 1986). This traditional paradigm remains still valid to a certain extent, although a wealth of recent photometric and spectroscopic results have shown that GCs are not as simple as previously thought, harboring multiple stellar populations (MPs) that differ in terms of chemical abundances.
Star-to-star differences in the C and N abundances have been known for decades in GCs (see e.g. Osborn, 1971; Norris, 1981; Martell & Smith, 2009; Pancino et al., 2010), with the detection of CN-weak and CN-strong stars. In the last years the use of high-resolution spectroscopy coupled with large samples of GC stars has established that old, massive GCs, both in our Galaxy (Carretta et al., 2009; Gratton, Carretta & Bragaglia, 2012) and in the Local Group satellites (Mucciarelli et al., 2009) show star-to-star variations in some light elements: intrinsic scatters of Na and O abundances have been observed in all the GCs, variations of Al abundances in most of them, while star-to-star scatters in Mg abundances only in some peculiar clusters.
MPs in GCs manifest themselves also with different features in the color-magnitude diagrams (CMDs) when appropriate bands (or filter combinations) are used: main sequence splittings, as those observed in Centauri (Bedin et al., 2004), NGC 2808 (Piotto et al., 2007) and NGC 6752 (Milone et al., 2010), sub-giant branch (SGB) splittings (see e.g. Milone et al., 2008; Piotto et al., 2012) and, in the majority of the cases, multimodal red giant branches (RGBs, see Piotto et al., 2015, for a recent review).
The most commonly accepted idea about MP formation is that secondary generations are formed from the ejecta of first generation stars (polluters) along with pristine material (i.e. material with the same abundances as the first generation). Within this general framework, four main scenarios have been proposed differing mainly for the nature of the polluters: i) asymptotic giant branch stars (D’Ercole et al., 2008), ii) fast-rotating massive stars (Decressin et al., 2007), iii) interacting massive binary stars (De Mink et al., 2009), and (iv) super-massive stars (Denissenkov & Hartwick, 2014; Denissenkov et al., 2015). An alternative scenario that does not require an age difference between first and second generation stars is the so-called early disk accretion scenario (Bastian et al., 2013). This model suggests that interacting massive stars and binaries can shed enriched material into the cluster, and low-mass pre-main sequence stars (of the same generation), which are fully convective and have proto-planetary disks, are able to sweep up the enriched material and eventually accrete it. However, all the proposed scenarios present some shortcomings and they are not able to reproduce simultaneously all the observational pieces of evidence (see e.g. Bastian, 2015; Bastian & Lardo, 2015).
By using a proper combination of archival Hubble Space Telescope (HST) and WFI@MPG/ESO data, Dalessandro et al. (2014, hereafter PaperI) found that in all CMDs involving the U band or the F336W HST filter, the RGB and SGB of the GC NGC 6362 split in two distinct sequences. On the contrary, in the (V, V-I) CMD the average color spread of RGB and SGB stars is fully compatible with the photometric errors. Theoretical models demonstrate (Sbordone et al., 2011) that this behavior is the photometric signature of the CNONa chemical anomalies. The RGB and the SGB split in the (U, U-V) CMD because of star-to-star variations in C and N abundances which are detectable by the U band (through the NH and CN bands present in this spectral range), while pure optical filters are insensitive to such variations. Nowadays, this behavior of the evolutionary sequences of GCs in U and optical filters is a common feature of GCs (see e.g Lardo et al., 2011).
As discussed in PaperI, NGC 6362 appears to be peculiar in many respects. With an estimated mass of , NGC 6362 is the least massive GC with detected photometric MPs. These observational findings put strong constraints to the mass threshold enabling the formation of MPs. In addition we have found that NGC6362 is the first cluster where the radial distributions of its MPs show no significant radial difference up to its tidal radius. We interpreted such an unexpected evidence as the result of a very advanced dynamical evolution and possibly of a significant mass-loss due to interactions with the Galactic disk and potential well (see Dalessandro et al., 2015).
However, while the presence of the RGB photometric split indicates the presence of MPs in this cluster, only a dedicated spectroscopic investigation can reveal the specific chemical patterns associated to each sub-population needed for a proper comparison with other systems. Therefore, in order to fully characterize the MPs of NGC 6362, we have collected high-resolution spectra for a large number of member stars. In this paper we present the first derivation of the Fe and Na abundances ever obtained for this cluster, and we discuss these results in light of those provided in PaperI.
The paper is structured as follows: in Section 2 the data-set is presented, in Section 3 we describe the details of the adopted data-analysis procedures, in Section 4 we present the derived abundances of Na and Fe for the stars in our sample, in Section 5 we discuss these results and in Section 6 we compare them to what observed in M4, which shares a similar metallicity. The main results are then summarized in Section 7.
2 Observations
The observations have been performed with the multiplex facility FLAMES@ESO-VLT (Pasquini et al., 2000) in the UVES+GIRAFFE combined mode (Prop ID: 093.D-0618, PI: Dalessandro). This mode allows the simultaneous allocation of 8 UVES high-resolution fibers and 132 mid-resolution GIRAFFE-MEDUSA fibers. The employed gratings are the UVES Red Arm CD#3 580, that covers the spectral range between 4800 and 6800 Å with a spectral resolution of 45000, and the GIRAFFE setups HR11 (5597-5840 Å and R24000) and HR13 (6120-6405 Å and R22000). All the employed setups allow to derive abundances of Fe (thanks to several available lines) and Na (sampling the two Na doublets at 5682-5688 Å and 6154-6160 Å ). Unfortunately, oxygen abundances cannot be derived because of the close-to-zero radial velocity of the cluster leading to a blending between the forbidden oxygen line at 6300.3 Å and the sky emission line at the same wavelength.
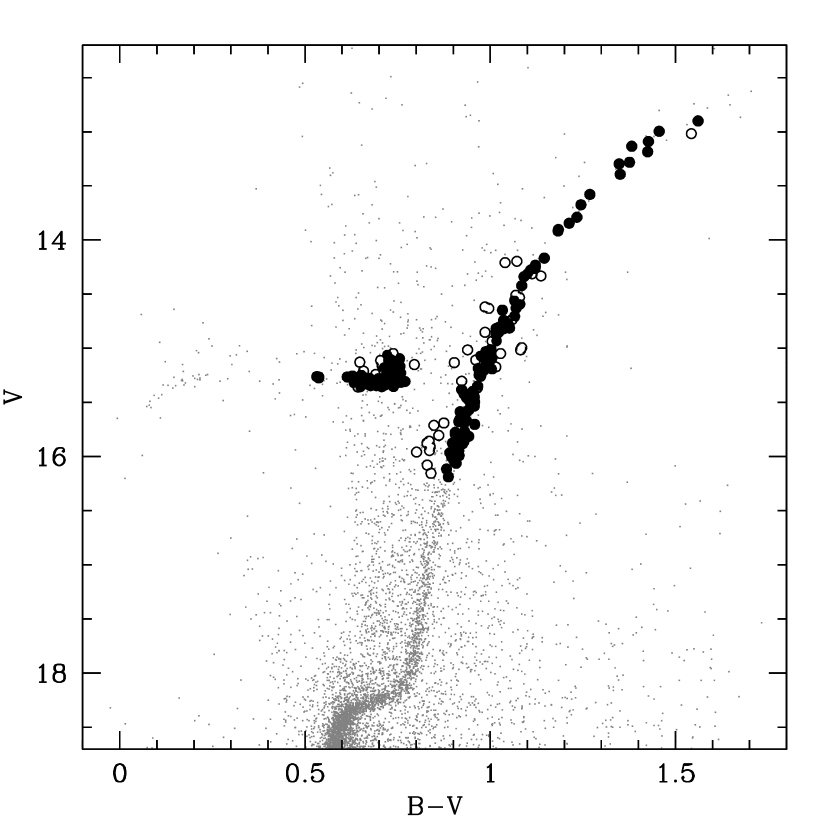
A total of 2 exposures of 45 min each for two different star configurations has been secured for the grating HR11 and 2 exposures of 32 min each have been performed with the grating HR13. The UVES targets have been kept fixed on the same targets in both star configurations in order to increase the S/N ratio. A total of 219 stars have been selected along the RGB and the red Horizontal Branch (RHB) from the ACS@HST and WFI@2.2m-ESO catalogues presented in PaperI. These stars are (i) brighter than V=16.2, thus reaching at least S/N ratio of about 30 per pixel; (ii) isolated, i.e. stars without a companion brighter than V1.0 within 2”; and, for RGB targets only, (iii) along the two RGBs observed in the (U, U-V) plane, thus to properly sample the two observed sub-populations detected in PaperI. The position of the spectroscopic targets in the (V, B-V) CMD is shown in Fig. 1. Table 1 lists the coordinates and the U, B, V magnitudes for all the member stars.
The spectra have been reduced with the dedicated ESO pipelines222http://www.eso.org/sci//software/pipelines/, including bias-subtraction, flat-fielding, wavelength calibration with a standard Th-Ar lamp, spectral extraction and (only for the UVES spectra) order merging. The contribution of the sky has been subtracted from each spectrum by using a median sky spectrum obtained combining 15-20 (for GIRAFFE) and 2 (for UVES) spectra of sky regions secured within each exposure.
3 Analysis
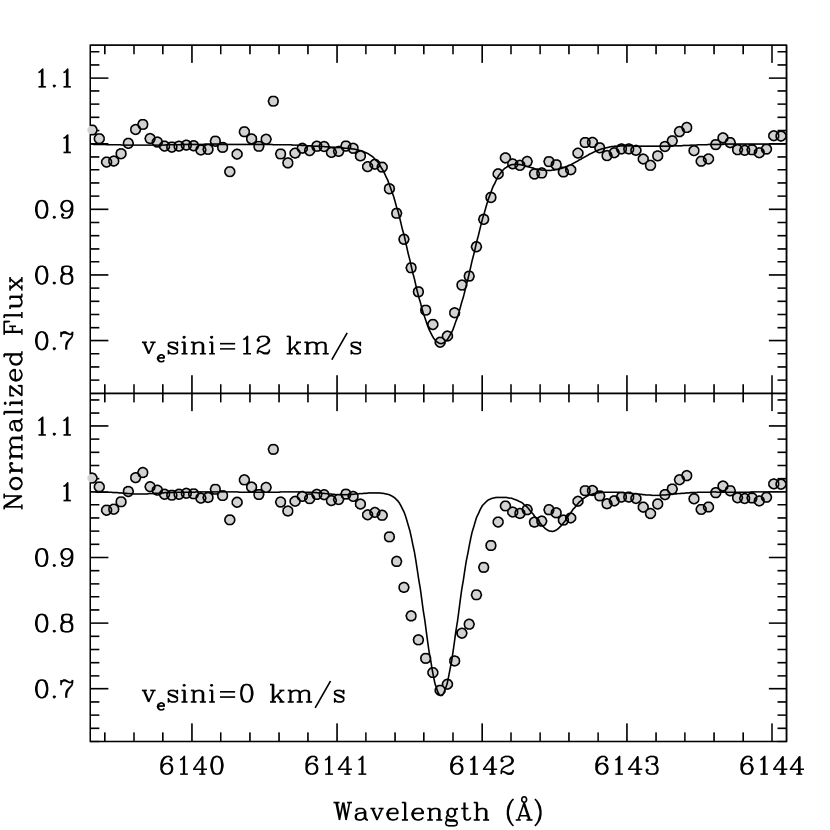
The chemical abundances of Fe and Na have been derived with the package GALA (Mucciarelli et al., 2013a) by matching measured and theoretical equivalent widths (EWs) of a set of unblended lines. EWs and radial velocities (RVs) have been measured with the code DAOSPEC (Stetson & Pancino, 2008), automatically launched by using the package 4DAO (Mucciarelli, 2013), that allows a visual inspection of all the performed Gaussian fits. We started by adopting as input value the nominal full width at half-maximum (FWHM) of the gratings, leaving DAOSPEC free to re-adjust the FWHM in order to minimize the median value of the residuals distribution (see Stetson & Pancino, 2008). For some RHB stars the final FWHM is larger than those found for the RGB stars, indicating the presence of a rotational broadening in addition to the instrumental profile. The projected rotational velocities () have been measured by comparing the line profiles of the RHB stars with grids of suitable synthetic spectra calculated with the code SYNTHE (Sbordone et al., 2004) and convolved with the nominal spectral resolution of the used gratings333These values are confirmed also by the measure of the FWHM of bright unsaturated lines in the reference Th-Ar calibration lamp, following the method described by Behr, Cohen & McCarthy (2000). and with a rotational profile, varying the value of . All the observed RHB stars have between 0 and 12 km/s. The observed distribution of rotational velocities is compatible with those measured for RHB stars in other GCs (Gratton et al., 2011, 2013). On the other hand, all the RGB stars are compatible with zero rotation. Fig. 2 shows, as example, the spectral region around the Ba II line at 6141 Å for the RHB star #604095, with superimposed two synthetic spectra calculated with different rotation velocities. In the upper panel the observed spectrum is compared with a synthetic spectrum calculated with the best-fit rotational velocity (= 12 km/s), while the lower panel shows the comparison with a synthetic spectrum without rotation (=0 km/s), not able to properly reproduce the line broadening.
First, we measured RV in each individual exposure. The spectra of each exposure have been corrected for their own heliocentric RV, then those corresponding to the same target have been co-added together. Finally the averaged spectra have been analyzed to obtain the EWs to be used for the chemical analysis.
Oscillator strengths for the used Fe I lines are from the critical compilation by Fuhr & Wiese (2006), while those for the two Na doublets are from the NIST database 444http://physics.nist.gov/PhysRefData/ASD/lines_form.html. Na abundances have been corrected for non-local thermodynamic equilibrium effects adopting the grid of corrections calculated by Gratton et al. (1999). Model atmospheres have been calculated with the last version of the ATLAS9 code555http://wwwuser.oats.inaf.it/castelli/sources/atlas9codes.html. Solar reference abundances are from Grevesse & Sauval (1998).
Guess values for the effective temperatures () and surface gravities (log g) have been derived from the photometry (PaperI). In particular, have been estimated by means of the relation by Alonso et al. (1999), adopting the extinction law by Cardelli, Clayton & Mathis (1989) and a color excess E(B-V)= 0.09 mag (Harris, 1996, 2010 edition). Gravities have been computed through the Stefan-Boltzmann equation, adopting the photometric , the bolometric corrections by Alonso et al. (1999), a distance modulus mag (Harris, 1996, 2010 edition) and an evolutive mass of 0.75, according to a 12 Gyr BaSTI isochrone with Z=0.004 and -enhanced chemical mixture (Pietrinferni et al., 2006).
Only for the UVES targets can be derived spectroscopically, thanks to the large number of available iron lines distributed over a large range of excitation potentials, while this approach is not possible for the GIRAFFE targets because of the low number of Fe I lines with low excitation potential. For the UVES targets have been derived by imposing the excitation equilibrium, i.e. the best is that which erases all trends between Fe I abundances and excitation potential. The photometric of the UVES targets are slightly higher than those derived spectroscopically and they need to be lowered by 80 K to match the spectroscopic ones. This offset has been applied to all the targets, including those belonging to the GIRAFFE sample, in order to use a self-consistent scale. Final values of log g have been computed with the new .
Microturbulent velocities () for RGB stars have been derived spectroscopically by erasing all trends between abundances from Fe I lines and the measured EWs. For the RHB targets, the small number of available Fe I lines (less than 25) prevents a robust determination of . According to the analyses of RHB stars in GCs performed by Gratton et al. (2011, 2012, 2013), a unique value of can be used for all the RHB stars of a given cluster. Thus, we assumed for all the RHB stars of the sample = 1.5 km/s, since this value provides an average [Fe/H] abundance for the RHB stars that matches well that obtained for RGB stars.
The abundance uncertainties have been computed by adding in quadrature two main sources: (i) uncertainties arising from the EW measurements, that are estimated as the dispersion of the mean normalized to the root mean square of the number of used lines. They are of the order of 0.01-0.03 dex for Fe and smaller than 0.05-0.06 dex for Na; (ii) uncertainties arising from the atmospheric parameters. Errors in have been estimated taking into account for the photometric uncertainties and the uncertainty in the color excess, and they are of about 80-100 K. Those in log g have been estimated by taking into account the photometric errors and the uncertainties in , distance modulus and mass; they are of the order of 0.05 dex. A conservative uncertainty of 0.2 km/s has been adopted for the microturbulent velocities.
4 Fe and Na abundance in NGC 6362
Within the entire sample of observed stars, we identified a total of 160 bona fide cluster members (105 RGB and 55 RHB stars), according to their radial velocity and metallicity. Fig. 3 shows the distribution of the observed targets in the RV–[Fe/H] plane, together with the histograms of the RV and [Fe/H] distributions. Stars belonging to NGC 6362 are easily identified in this plane, since they cluster around RV–15 km/s and [Fe/H]–1.1 dex and they are easily distinguishable from field stars because the latter have metallicities peaked at [Fe/H]–0.6 dex. We selected as cluster members the stars in the range –25RV-3 km/s and –1.3[Fe/H]-0.9 dex (filled circles in Fig. 3), excluding, among them, 3 stars with significant RV variations among the individual exposures, thus likely being binary systems. The position in the CMD of the member stars is shown in Fig. 1 as filled circles, while the discarded stars are marked as empty circles. Table 1 lists the derived [Fe/H] and [Na/Fe] abundance ratios and the corresponding uncertainties for each cluster member.

Mean abundances, intrinsic scatters and their uncertainties have been calculated with the Maximum Likelihood (ML) algorithm described in Mucciarelli et al. (2012). The average iron abundance is [Fe/H]=–1.090.01 dex with an observed scatter of 0.06 dex and an intrinsic scatter of 0.000.01 dex, demonstrating the high degree of iron abundance homogeneity of NGC 6362. This is the first determination of the iron content of NGC 6362 based on high-resolution spectra. Note that the only previous measure of its metallicity has been provided by Geisler, Claria & Minniti (1997) by using Washington photometry, finding [Fe/H]=–0.740.05 dex.
The [Na/Fe] distribution of the sample of member stars is shown in panel a) of Fig. 4 as a generalized histogram. The ML algorithm provides an average value of +0.130.01 dex with an intrinsic dispersion of 0.160.01 dex, indicating a significant star-to-star scatter. The [Na/Fe] distributions for the samples of RGB and RHB stars considered separately are shown in panels b) and c) of Fig. 4, respectively. The two distributions appear quite different from each other: that of RGB stars is about 0.8 dex wide, with a main peak at [Na/Fe]0.0 dex, a secondary peak close to [Na/Fe]+0.3 dex and an extended tail up to [Na/Fe]+0.6 dex. On the other hand, the distribution of RHB stars is narrower than that of RGB stars, with a Gaussian shape and a peak at [Na/Fe]0.0 dex, nicely matching the main peak of the RGB distribution.
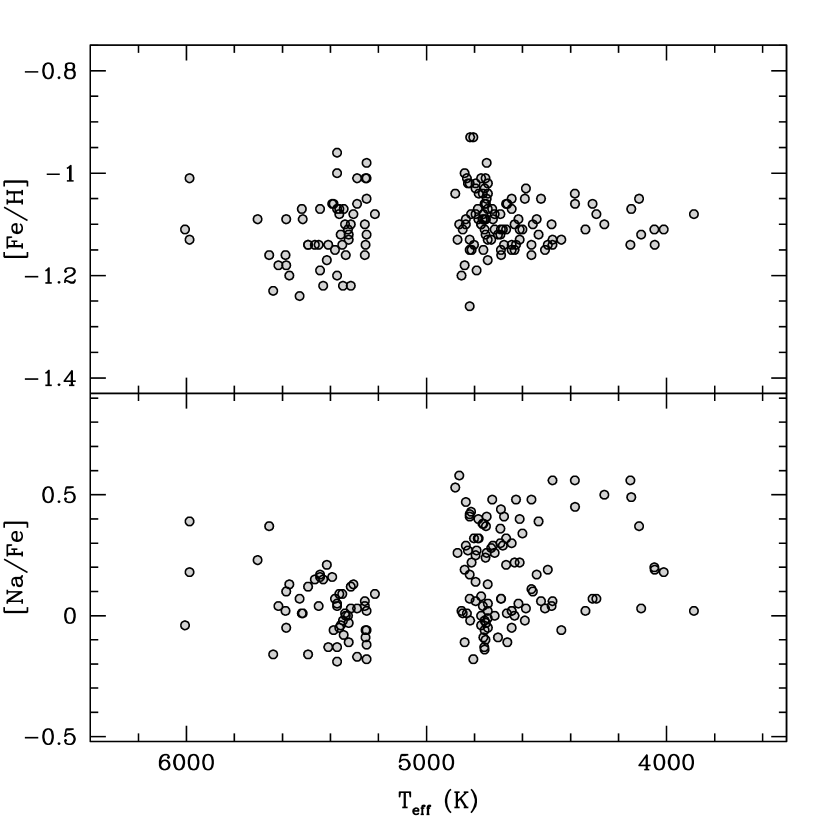
Fig. 5 shows the behavior of [Fe/H] (upper panel) and [Na/Fe] (lower panel) as a function of for all the member stars of the cluster: no significant trend between abundance ratios and is found.

5 Na abundance in NGC 6362 and multiple populations
5.1 RGB stars
The bimodality of the [Na/Fe] distribution of the RGB stars has been statistically analyzed by means of the Gaussian mixture modeling algorithm described by Muratov & Gnedin (2010). We found that the hypothesis of unimodal distribution can be rejected with a probability : the observed distribution can be reproduced with two Gaussian components, one peaked at [Na/Fe] dex and with dex, the other peaked at [Na/Fe] dex and with dex.
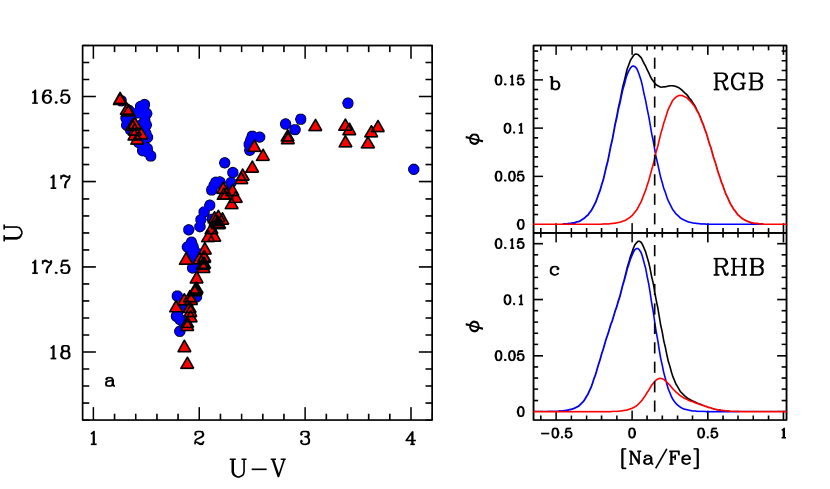
Usually, the Na abundance is used to discriminate between first generation (FG) and second generation (SG) stars, being Na-poor and Na-rich, respectively. According to the [Na/Fe] distribution shown in the panel b) of Fig. 6, we therefore adopted [Na/Fe] dex as the boundary to separate FG and SG populations in NGC 6362 and, following the approach already adopted in other works about multiple populations of GCs (see e.g. Marino et al., 2008), we investigated the connection between the two Na-selected samples and the two RGBs observed in the CMD when the U filter is used. Such a RGB splitting is thought to be driven by variations of strength of the CN and NH molecular bands that dominate the spectral region sampled by the U filter (Sbordone et al., 2011), and should therefore be directly ascribable to multiple populations.
As clearly shown in panel a) of Fig. 4, and as expected, the Na-poor stars reside on the bluest RGB, while the Na-rich stars populate the reddest RGB. The same result is found if we consider the () plane. We also found that the fractions of (Na-selected) FG and SG stars in NGC 6362 are basically the same ( and , respectively), corresponding to a ratio . This value agrees well with the second-to-first generation ratio estimated photometrically in PaperI () according to the star number counts along the two RGBs666 We checked that the use of different prescriptions for the NLTE corrections for Na abundances does not change these results. [Na/Fe] abundance ratios have been re-calculated adopting the NLTE corrections by Lind et al. (2011) that provide abundances lower than about 0.15-0.2 dex, while the overall [Na/Fe] distribution, the ratio and the photometric distribution of Na-rich and Na-poor stars remain the same..
5.2 HB stars
As appreciable in panels c) of Fig. 4 and 6, the [Na/Fe] distribution of the RHB stars appears to be quite different from that of RGB stars: about 82% of the RHB stars are Na-poor ([Na/Fe]0.15 dex), leading to a second-to-first generation ratio =0.220.08. Hence, most of the stars populating the RHB of NGC 6362 belong to the first generation. This finding confirms previous analyses of HB stars in other GCs (see e.g. Marino et al., 2011; Gratton et al., 2011, 2012, 2013), where the red part of the HB is preferentially populated by FG stars.
The natural explanation is that most of the RHB stars that we observe are the progeny of stars previously located along the bluest RGB detected in the CMDs including the U filter. In this view, the Na-rich RGB stars populating the bluest RGB of Fig. 6 (and accounting for 50% of the total RGB stars) will populate the blue part of the HB of the cluster. Note that HB stars bluest than the instability strip have not been observed in this program.
Both the number counts of the two RGBs (Paper I) and the ratio between Na-poor and Na-rich RGB stars point out a similar population of FG and SG stars, while the RHB stars are mainly FG stars. We calculated the number of Na-rich stars expected to populate the blue HB in order to obtain a second-to-first generation ratio of 1.10 along the entire HB. The stars have been selected from the WFI catalog within 850” from the cluster center (corresponding to the FLAMES field of view) and adopting (B-V)= 0.4 mag as boundary between red and blue HB stars. A total of 130 and 80 red and blue HB, respectively, have been counted. The RHB is located in a region of the CMD contaminated by main sequence field stars (see Fig. 1), at variance with the blue portion of the HB. For this reason the number counts of the RHB have been corrected for the field star contamination considering a percentage of field stars of 19% (according to the fraction of field stars detected among the RHB spectroscopic targets). Finally, we expect to find 79 (out 80) Na-rich blue HB stars. Hence, in order to have the same second-to-first generation ratio that we observe among the RGB stars, the blue HB should be populated only by Na-rich stars, in agreement with the analysis of blue HB stars in GCs performed by Gratton et al. (2011, 2012, 2013).
6 Comparison with M4
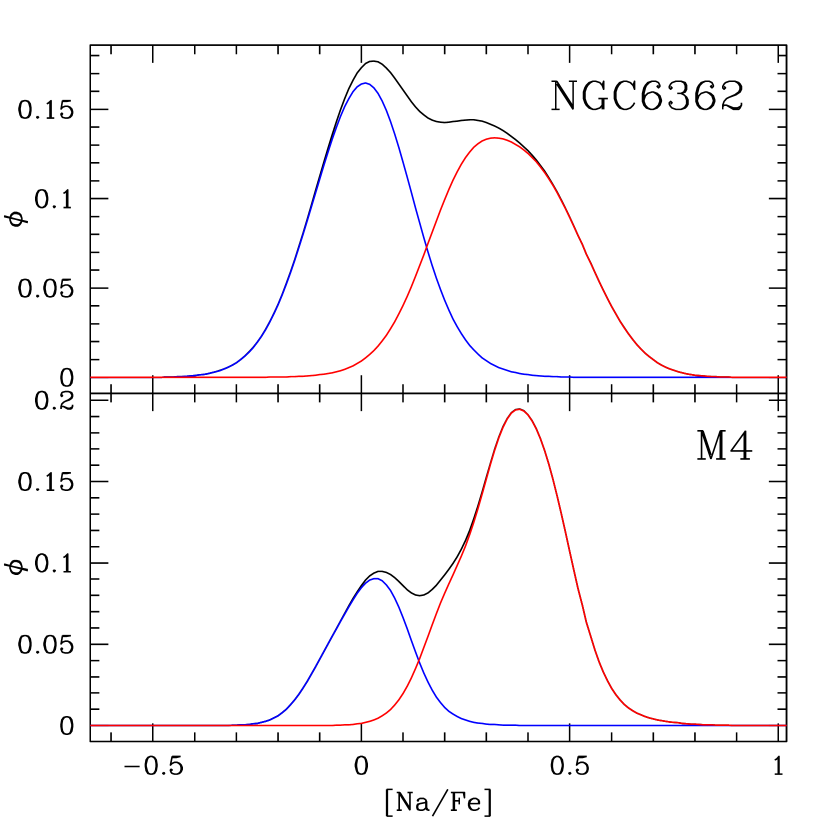
Among all the other Galactic GCs with secure evidence of multiple stellar populations, M4 is the least massive one with a metallicity comparable to that of NGC 6362 (Harris, 1996, 2010 edition; Marino et al., 2008; Carretta et al., 2009; Villanova & Geisler, 2011). Hence, a comparison between these two clusters could bring particularly interesting information, and, by following the same approach described in Mucciarelli et al. (2013b), we therefore adopted the same technique described above to perform the chemical analysis of a sample of stars in M4. In this way, the derived [Fe/H] and [Na/Fe] abundance ratios for the two GCs are from any possible systematics arising from the adopted model atmospheres, linelists, method to measure EWs, code to derive the abundances, solar reference abundances and NLTE corrections. This kind of comparative analysis is much more robust than a simple comparison with literature abundances.
We retrieved, from the ESO Archive777http://archive.eso.org/cms/eso-data.html, UVES and GIRAFFE spectra of 93 stars along the RGB of M4, acquired with the same setups used for NGC 6362 and with comparable spectral quality (Prop ID: 072.D-0570, PI: Carretta). The atmospheric parameters have been computed following the same procedure described above. have been derived from B and V photometry (taken from Carretta et al., 2009), adopting E(B-V)=0.35 mag (Harris, 1996, 2010 edition) and applying suitable corrections for differential reddening computed according to the procedure described in Massari et al. (2012). Surface gravities have been computed assuming a distance modulus of = 12.82 mag (Harris, 1996, 2010 edition). We restrict the analysis only to the stars considered as cluster members by Carretta et al. (2009). The average [Fe/H] of the sample is [Fe/H]=–1.140.01 dex with an observed scatter =0.06 dex and an intrinsic scatter =0.000.02 dex, in nice agreement with the previous determinations (see e.g. Marino et al., 2008; Carretta et al., 2009; Mucciarelli et al., 2011) and confirming that M4 and NGC 6362 have very similar metallicities.
The distribution of [Na/Fe] of M4 stars spans about 0.7 dex, with an average value of +0.270.01 and an intrinsic spread of 0.160.01. The comparison between the [Na/Fe] distributions of NGC 6362 and M4 is shown in Fig. 7. The two distributions are similar in terms of the covered abundance range and the position of the two main peaks at [Na/Fe]0.0 and +0.3 dex. However we note that they show a remarkably different number ratio of the two populations, with the Na-rich population dominating in the case of M4. In fact, assuming the same boundary adopted for NGC 6362, the ratio between Na-rich and Na-poor stars in M4 is = 2.760.70, corresponding to a fraction of FG stars of 27%. This is in agreement with what found by Marino et al. (2008) and Carretta et al. (2009) for M4, and to that usually found in all GCs (Bastian & Lardo (2015) estimated an average ratio between Na-rich and Na-poor stars of 0.680.07%).
7 Summary and conclusions
The main results obtained from the spectroscopic analysis presented in this paper are:
(i) the iron content of NGC 6362 is [Fe/H]=–1.090.01, without evidence of
intrinsic spread. This is the first determination of its iron abundance based on high-resolution spectra;
(ii) the [Na/Fe] distribution of the cluster shows a clearly bimodal distribution, revealing
the presence of two well distinct stellar populations.
We find a clearcut correspondence between the Na abundances and the
two RGBs detected in the CMDs including the U or the F336W HST filters (PaperI),
with the Na-poor stars populating the bluest RGB and the Na-rich stars the reddest RGB, as theoretically
expected;
(iii) among the RGB stars, the two populations, selected according to their [Na/Fe] abundance,
are equally populated, at variance with the other GCs where the stellar content is dominated by the Na-rich population.
The results of this paper confirm that NGC 6362 is the least massive cluster where MPs have been observed, as discussed in PaperI on a pure photometric basis. The other two GCs with comparable masses and evidence of chemical anomalies, namely NGC 288 and M4, are 2 and 3 times more massive than NGC 6362, respectively, when masses are estimated in a homogeneous way (see PaperI), by using the best-fit King model reproducing their density profiles and the velocity dispersion data by Pryor & Meylan (1993). On the other hand, old open clusters slightly less massive (by a factor of 3-5) than NGC 6362 do not exhibit intrinsic scatters in the light elements, see the case of Berkeley 39 (Bragaglia et al., 2012) and NGC 6791, though this latter case is still matter of debate since different groups find opposite results (Geisler et al., 2012; Bragaglia et al., 2014; Cunha et al., 2015). Whatever the true nature of the polluters is, this finding about NGC 6362 can provide crucial constraints to the minimum cluster mass necessary to retain the low-energy ejecta and to undergo self-enrichment processes.
The differential comparison with M 4 clearly reveals that these two clusters share the same chemical patterns, with broad and bimodal [Na/Fe] distributions. However we observe that in NGC 6362 FG and SG are equally populated at variance with what observed in M 4, where SG stars represent the of the total. Indeed, the analysis of 19 GCs discussed by Carretta et al. (2009) provides a typical fraction of 30% for the first generation and of 70% for the polluted stars. The only GC in the Carretta et al. (2009) sample with a comparable first generation fraction is NGC 2808 (50%). NGC 2808 is however very different from NGC 6362 and most GCs, in terms of anti-correlation extension (Carretta et al., 2009), fraction of the extreme generation ([O/Na/–0.9 dex), horizontal branch morphology (Dalessandro et al., 2011) and mass (NGC 2808 is more massive by a factor of 8, according to McLaughlin & van der Marel, 2005).
The fact that SG stars typically outnumber FGs is usually explained by invoking a relevant and preferential loss of FG stars during the early stages of the GC life. In fact, it is expected (D’Ercole, D’Antona & Vesperini, 2011; Bekki, 2011) that FG are initially less segregated than SG stars. As a consequence, they reach the conditions to escape the cluster during the early expansion of the system taking place during the first Gyr of the cluster, which is dominated by stellar evolution and SNe explosions.
In the case of NGC 6362, the present-day number ratio between FG and SG stars is representative of the one shown by the cluster at the time when FG and SG stars have reached fully spatial mixing, as shown by Vesperini et al. (2013) and Miholics, Webb & Sills (2015). In fact, after mixing is reached, different sub-populations are expected to lose stars at similar rates. How the present-day ratio is related to the primordial one depends on the fraction of mass lost. Both Vesperini et al. (2013) and Miholics, Webb & Sills (2015) find that in order to reach a completely spatially mixed configuration, NGC6362 should have lost a significant fraction of mass during the long-term dynamical evolution. Indeed Miholics, Webb & Sills (2015) have estimated that, given its orbit, NGC6362 has been tidally filled for most of its life, independently on its initial conditions, and therefore it likely lost a large fraction of stars because of tidal stripping. If this is the case, NGC6362 is expected to be born with a very small and highly concentrated SG sub-population.
We can conclude that, putting together the number of peculiar properties observed in this cluster, NGC 6362 results to be an unique case among the Galactic GCs. Any theory aimed at explaining the formation and evolution of GCs (from initial, more massive clusters to those that we currently observe) must account also for the peculiar case of NGC 6362.
References
- Alonso et al. (1999) Alonso, A., Arribas, S., & Martinez-Roger, C., 1999, A&As, 140, 261
- Bastian et al. (2013) Bastian, N., Lamers, H. J. G. L. M., de Mink, S. E., Longmore, S. E., Goodwin, S. P., & Gieles, M., 2013, MNRAS, 436, 2398
- Bastian (2015) Bastian, N., 2015, arXiv:1510.01330
- Bastian & Lardo (2015) Bastian, N., & Lardo, C., 2015, MNRAS, 453, 357
- Beccari et al. (2013) Beccari, G., Bellazzini, M., Lardo, C., Bragaglia, A., Carretta, E., Dalessandro, E., Mucciarelli, A., & Pancino, E., 2013, MNRAS, 431, 1995
- Bedin et al. (2004) Bedin, L. R., Piotto, G., Anderson, J., Cassisi, S., King, I. R., Momany, T., & Carraro, G., 2004, ApJ, 605L, 125
- Behr, Cohen & McCarthy (2000) Behr, B. B., Cohen, J. G., & McCarthy, J. K., 2000, ApJ, 531L, 37
- Bekki (2011) Bekki, K., 2011, MNRAS, 413, 2241
- Bragaglia et al. (2012) Bragaglia, A., Gratton, R. G., Carretta, E., D’Orazi, V., Sneden, C., & Lucatello, S., 2012, A&A, 548, 122
- Bragaglia et al. (2014) Bragaglia, A., Sneden, C., Carretta, E., Gratton, R. G., Lucatello, S., Bernath, P. F., Brooke, J. S. A., & Ram, Ram S., 2014, ApJ, 796, 68
- Cardelli, Clayton & Mathis (1989) Cardelli, J. A., Clayton, G. C., & Mathis, J. S., 1989, ApJ, 345, 245
- Carretta et al. (2009) Carretta, E., Bragaglia, A., Gratton, R. G., D’Orazi, V. & Lucatello, S., 2009, A&A, 508, 695
- Cunha et al. (2015) Cunha, K et al., 2015, ApJ, 798L, 41
- Dalessandro et al. (2011) Dalessandro, E., Salaris, M., Ferraro, F. R., et al. 2011, MNRAS, 410, 694
- Dalessandro et al. (2014) Dalessandro, E., Massari, D., Bellazzini, M., Miocchi, P., Mucciarelli, A., Salaris, M., Cassisi, S., Ferraro, F. R., & Lanzoni, B., 2014, ApJ, 791L, 4
- Dalessandro et al. (2015) Dalessandro, E., Miocchi, P., Carraro, G., Jílková, L., & Moitinho, A. 2015, MNRAS, 449, 1811
- Decressin et al. (2007) Decressin, T., Meynet, G., Charbonell, C., Prantzos, N., & Ekstrom, S., 2007, A&A, 464, 1029
- De Mink et al. (2009) De Mink, S. E., Pols, O. R., Langer, N., & Izzard, R. G., 2009, A&A, 507L, 1
- Denissenkov & Hartwick (2014) Denissonkov, P. A., & Hartwick, F. D. A., 2014, MNRAS, 437, 21
- Denissenkov et al. (2015) Denissenkov, P. A., VandenBerg, D. A., Hartwick, F. D. A., Herwig, F., Weiss, A., & Paxton, B., 2015, MNRAS, 448, 3314
- D’Ercole et al. (2008) D’Ercole, A., Vesperini, E., D’Antona, F., McMillan, S. L. W., & Recchi, S., 2008, MNRAS, 391, 825
- D’Ercole, D’Antona & Vesperini (2011) D’Ercole, A., D’Antona, F., & Vesperini, E., 2011, MNRAS, 415, 1304
- Fuhr & Wiese (2006) Fuhr, J. R., & Wiese, W. L., 2006, JPCRD, 35, 1669
- Geisler, Claria & Minniti (1997) Geisler, D., Claria, J. J., & Minniti, D., PASP, 109, 799
- Geisler et al. (2012) Geisler, D., Villanova S., Carraro, G., Pilachowski, C., Cummings, J., Johnson, C. I., & Bresolin, F., 2012, 756L, 40
- Gratton et al. (1999) Gratton, R. G., Carretta, E., Eriksson, K. & Gustafsson, B., 1999, A&A, 350, 955
- Gratton et al. (2011) Gratton, R. G., Lucatello, S., Carretta, E., Bragaglia, A., D’Orazi, V., & Momany, Y., 2011, A&A, 534, 123
- Gratton et al. (2012) Gratton, R. G., Lucatello, S., Carretta, E., Bragaglia, A., D’Orazi, V., Momany, Y., Sollima, A., Salaris, M., & Cassisi, S., 2012, A&A, 539, 19
- Gratton, Carretta & Bragaglia (2012) Gratton, R. G., Carretta, E. & Bragaglia, A., 2012, A&ARv, 20, 50
- Gratton et al. (2013) Gratton, R. G., Lucatello, Sollima, A., Carretta, E., Bragaglia, A., Momany, Y., D’Orazi, V., Cassisi, S., Pietrinferni, A. & Salaris, M., 2013, A&A, 549, 41
- Grevesse & Sauval (1998) Grevesse, N., & Sauval, A. J., 1998, SSRv, 85, 161
- Harris (1996, 2010 edition) Harris, W. E. 1996, AJ, 112, 1487
- Lardo et al. (2011) Lardo, C., Bellazzini, M., Pancino, E., Carretta, E., Bragaglia, A., & Dalessandro, E., 2011, A&A, 525, 114
- Lind et al. (2011) Lind, K., Asplund, M., Barklem, P. S., & Belyaev, A. K., 2011, A&A, 528, 103
- Marino et al. (2008) Marino, A. F., Villanova, S., Piotto, G., Milone, A. P., Momany, Y., Bedin, L. R., & Medling, A. M., 2008, A&A, 490, 625
- Marino et al. (2011) Marino, A. F., Villanova, S., Milone, A. P., Piotto, G., Lind, K., Geisler, D. & Stetson, P. B., 2011, ApJ, 730L, 16
- Martell & Smith (2009) Martell, S. L., & Smith, G. H., 2009, PASP, 121, 577
- Massari et al. (2012) Massari, D., Mucciarelli, A., Dalessandro, E., Ferraro, F. R., Origlia, L., Lanzoni, B., Beccari, G., Rich, R. M., Valenti, E., & Ransom, S. M., 2012, ApJ, 755L, 32
- McLaughlin & van der Marel (2005) McLaughlin, D. E. & van der Marel, R. P., 2005, ApJS, 161, 304
- Miholics, Webb & Sills (2015) Miholics, M., Webb, J. J., & Sills, A., 2015, arXiv150902428
- Milone et al. (2008) Milone, A. P. et al., 2008, ApJ, 673, 241
- Milone et al. (2010) Milone, A. P., Piotto, G., King, I. R., Bedin, L. R., Anderson, J., Marino, A. F., Momany, Y., Malavolta, L., & Villanova, S., 2010, ApJ, 709, 1183
- Mucciarelli et al. (2009) Mucciarelli, A., Origlia, L., Ferraro, F. R., & Pancino, E., 2009, ApJ, 695, L134
- Mucciarelli et al. (2011) Mucciarelli, A., Salaris, M., Lovisi, L., Ferraro, F. R., Lanzoni, B., Lucatello, S., & Gratton, R. G., 2011, MNRAS, 412, 81
- Mucciarelli et al. (2012) Mucciarelli, A., Bellazzini, M., Ibata, R., Merle, T., Chapman, S. C., Dalessandro, E., & Sollima, A., 2012, MNRAS, 426, 2889
- Mucciarelli et al. (2013a) Mucciarelli, A., Pancino, E., Lovisi, L., Ferraro, F. R., & Lapenna, E., 2013, ApJ, 766, 78
- Mucciarelli et al. (2013b) Mucciarelli, A., Bellazzini, M., Catelan, M., Dalessandro, E., Amigo, P., Correnti, M., Cortés, C., D’Orazi, V., 2013, MNRAS, 435, 3667
- Mucciarelli (2013) Mucciarelli, A., 2013, arXiv1311.1403
- Muratov & Gnedin (2010) Muratov, A. L., & Gnedin, O., Y., 2010, ApJ, 718, 1266
- Norris (1981) Norris, 1981, ApJ, 248, 177
- Osborn (1971) Osborn, W., 1971, Obs, 91, 223
- Pancino et al. (2010) Pancino, E., Rejkuba, M., Zoccali, M. & Carrera, R., 2010, A&A, 524, 44
- Pasquini et al. (2000) Pasquini, L., et al., 2000, SPIE, 4008, 129
- Pietrinferni et al. (2006) Pietrinferni, A., Cassisi, S., Salaris, M., & Castelli, F., 2006, ApJ, 642, 797
- Piotto et al. (2007) Piotto, G., Bedin, L. R., Anderson, J., King, I. R., Cassisi, S., Milone, A. P., Villanova, S., Pietrinferni, A., & Renzini, A., 2007, ApJ, 661L, 53
- Piotto et al. (2012) Piotto, G., Milone, A. P., Anderson, J., Bedin, L. R., Bellini, A., Cassisi, S., Marino, A. F., Aparicio, A., & Nascimbeni, V., 2012, ApJ, 760, 39
- Piotto et al. (2015) Piotto, G., et al., 2015, AJ, 149, 91
- Pryor & Meylan (1993) Pryor, C., & Meylan, G., 1993, ASPC, 50, 357
- Sbordone et al. (2004) Sbordone, L., Bonifacio, P., Castelli, F., & Kurucz, R. L. 2004, Mem. Soc. Astron. Ital., 75, 396
- Sbordone et al. (2011) Sbordone, L., Salaris, M., Weiss, A., & Cassisi, S., 2011, A&A, 534, A9
- Stetson & Pancino (2008) Stetson, P. & Pancino, E., 2008, PASP, 120, 1332
- Vesperini et al. (2013) Vesperini, E., McMillan, S. L. W., D’Antona, F., & D’Ercole, A. 2013, MNRAS, 429, 1913
- Villanova & Geisler (2011) Villanova, S. & Geisler, D. 2011, A&A, 535, 31
| Star | RA | Dec | U | B | V | logg | [Fe/H] | [Na/Fe] | ||
|---|---|---|---|---|---|---|---|---|---|---|
| (J2000) | (J2000) | (K) | (km/s) | (dex) | (dex) | |||||
| 201343 | 263.0750664 | -66.8997455 | 17.220 | 16.048 | 15.074 | 4716 | 2.08 | 1.40 | -1.110.10 | 0.260.08 |
| 500473 | 262.4560855 | -67.0569192 | 17.383 | 16.451 | 15.494 | 4745 | 2.27 | 1.60 | -1.130.10 | 0.020.16 |
| 600257 | 262.8930198 | -66.9839966 | 17.059 | 15.817 | 14.768 | 4590 | 1.89 | 1.40 | -1.050.08 | -0.020.11 |
| 600352 | 262.8912788 | -66.9723982 | 16.799 | 15.387 | 14.278 | 4495 | 1.64 | 1.50 | -1.140.08 | 0.190.09 |
| 600496 | 262.8879197 | -67.0502011 | 16.628 | 15.944 | 15.296 | 5587 | 2.55 | 1.50 | -1.160.10 | 0.020.08 |
| 600530 | 262.8872475 | -67.1038652 | 17.852 | 16.855 | 15.964 | 4863 | 2.51 | 1.40 | -1.100.10 | 0.580.10 |
| 600607 | 262.8857838 | -66.9837179 | 16.733 | 15.354 | 14.232 | 4475 | 1.61 | 1.40 | -1.130.09 | 0.060.11 |
| 600850 | 262.8802788 | -67.0446788 | 16.591 | 15.885 | 15.257 | 5655 | 2.56 | 1.50 | -1.160.12 | 0.370.10 |
| 601019 | 262.8762369 | -67.0575666 | 17.227 | 16.010 | 15.008 | 4668 | 2.03 | 1.40 | -1.110.09 | 0.320.10 |
| 601528 | 262.8658176 | -67.0464912 | 16.667 | 15.922 | 15.166 | 5254 | 2.37 | 1.50 | -1.140.15 | -0.090.07 |
| 601632 | 262.8636925 | -66.9832167 | 17.418 | 16.418 | 15.476 | 4772 | 2.27 | 1.30 | -1.100.10 | 0.000.11 |
| 601756 | 262.8604542 | -67.0578518 | 16.781 | 15.411 | 14.309 | 4506 | 1.66 | 1.50 | -1.150.08 | 0.030.09 |
| 602034 | 262.8537861 | -67.0442901 | 16.525 | 15.793 | 15.261 | 6006 | 2.68 | 1.50 | -1.110.09 | -0.040.09 |
| 602223 | 262.8486807 | -67.1455510 | 16.657 | 15.906 | 15.181 | 5345 | 2.41 | 1.50 | -1.070.12 | -0.080.12 |
| 602471 | 262.8423465 | -67.0321127 | 16.755 | 16.025 | 15.306 | 5363 | 2.47 | 1.50 | -1.070.13 | -0.050.08 |
| 602685 | 262.8375124 | -66.9349993 | 16.815 | 15.429 | 14.338 | 4523 | 1.68 | 1.40 | -1.050.08 | 0.060.10 |
| 602803 | 262.8337385 | -67.0625221 | 17.698 | 16.681 | 15.775 | 4836 | 2.42 | 1.40 | -1.100.10 | 0.290.11 |
Note. — Coordinates, magnitudes, atmospheric parameters, [Fe/H] and [Na/Fe] abundance ratios for the target member stars. Identification numbers are from PaperI. The entire table is available in the electronic version of the journal.