A simple numeric algorithm for ancient coin dies identification
Luca Lista1
1 Senior Researcher at Istituto Nazionale di Fisica Nucleare (INFN), Sezione di Napoli (Italy)
Dated: March 7, 2024
Abstract
A simple computer-based algorithm has been developed to identify pre-modern coins
minted from the same dies, intending mainly coins minted by hand-made dies
designed to be applicable to images taken from auction websites or catalogs.
Though the method is not intended to perform a complete automatic classification,
which would require more complex and intensive algorithms accessible to experts of computer vision
its simplicity of use and lack of specific requirement about the quality of pictures can provide
help and complementary information to the visual inspection, adding quantitative measurements
of the “distance” between pairs of different coins. The distance metric is
based on a number of pre-defined reference points that mark key features of the coin to identify the set of coins they have been minted from.
1 Introduction
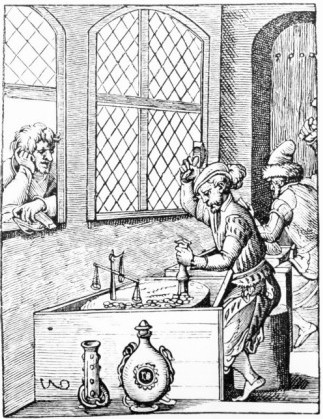
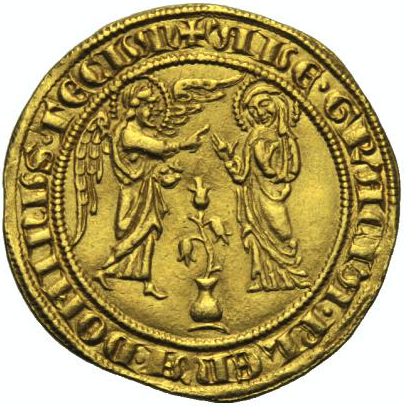
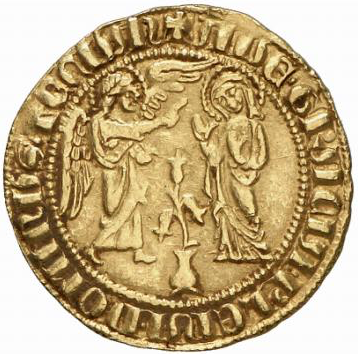
Before the advent of machine mints, coins were minted by manually hammering a metallic flan between two dies (Fig. 1). Dies were replaced with relatively high frequency due to damages and wear induced by the heavy mechanical stress. For this reason, ancient and medieval coins of the same type often exhibit visible differences, because they have been most likely minted using different dies. Dies were manually engraved, hence they were different from each other.
The identification of coins hammered from the same dies (not necessarily the same pair of dies, in several cases, because not both dies were replaced simultaneously) is of interest for numismatic studies. Fist attempts to realize die identification using an algorithm date back at least several decades [1], and the application of computer-vision techniques to numismatics provides valuable help to the field (see Ref. [2] and references therein for a review of the main recent applications). The full power of computer-based algorithms aims at studying even the most difficult cases, e.g.: identifying coins in bad conditions or spotting subtle feature of the coins. But for those purposes, often good quality pictures (special illumination, high resolution, etc.) or even 3D scans are required. Sometimes complex algorithms may require large CPU time to analyze coins, which in some cases may turn out to be a drawback [3].
We present here a simple and very fast algorithm based on the manual identification of a small number of reference points on coin images that turn out to be sufficient to provide quantitative information about die identification in order to complement the observations performed with a visual inspection. For the presented application, the choice of reference points may be crucial, and it will depend on the specific identification performed by the analyst of key features of the image.
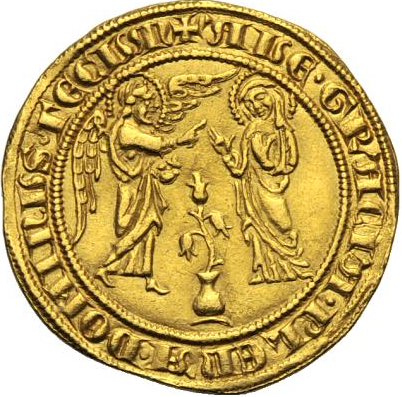
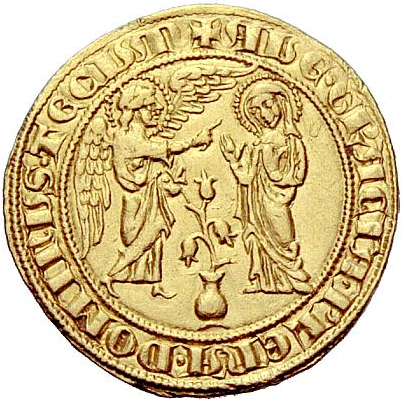
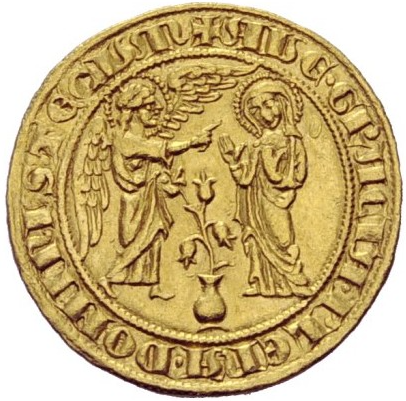
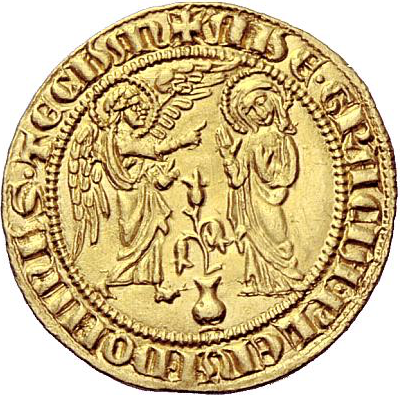
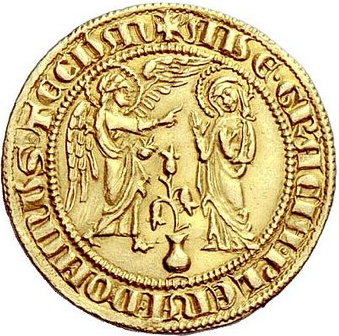
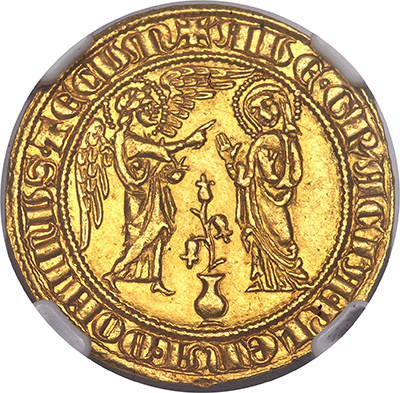
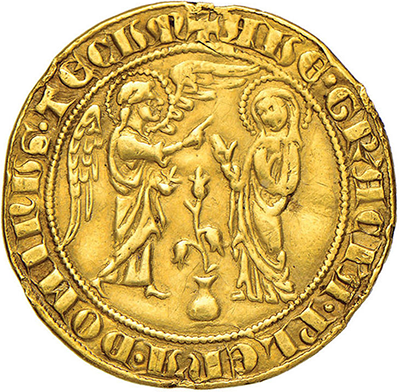
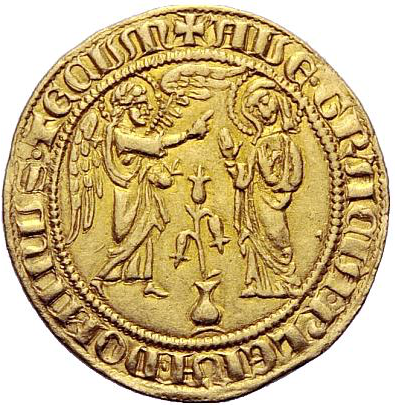
The method has been applied to a set of medieval coins, namely the golden saluto, minted under Charles I d’Anjou (king of Sicily and then king of Naples from 1266 to 1285) [4] and Charles II d’Anjou (king of Naples from 1285 to 1309) [5], based on a set of images retrieved from public online auctions, catalogs and other websites.
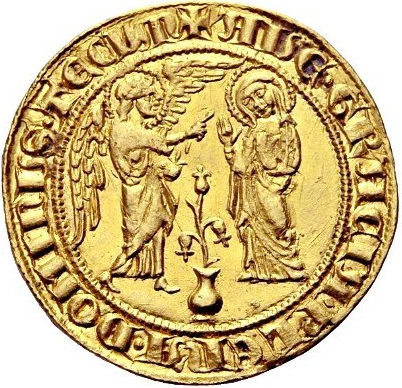
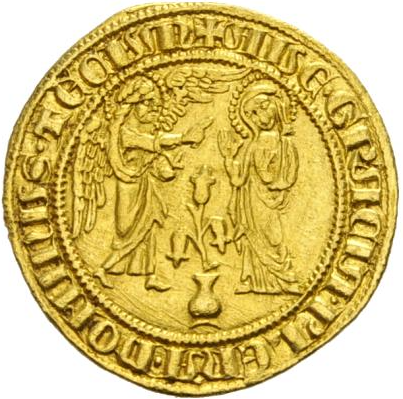
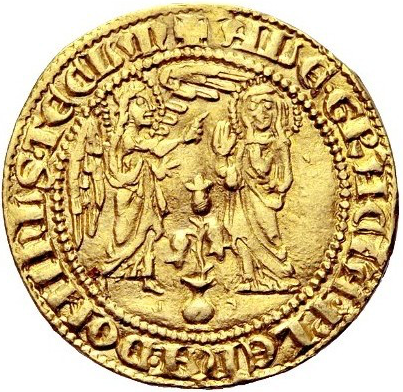
The production of the coin saluto, later renamed as carlino, after the name of king Charles I d’Anjou, was established on 18 of April 1278. It was the first golden coin produced in the mint of Naples. The name saluto reflects the scene of the Annunciation of the Virgin, where the angel Gabriel gives his salute to Mary [6]. The production of this coin continued under Charles II who ordered in 1295 to replicate the same image commissioned by his father and predecessor, Charles I:
Volentes indempnitati dicte Curie precavere hoc tibi oretenus et expresse commisso tenore presentium tue fidelitati mandamus quatenus circa id diligenti consideratione prohabita diligentia et cautela que honori nostro et comodo videris convenire intendas et intendi facias per viros idoneos et fideles ac expertos intalibus ad cudi faciendam karolenos aureos et argenti qui sint illins tenute ac forme sicut erant illi qui cudebantur tempore clare memorie domini patris nostri et laborandum in sicla predicta eo modo et forma quibus habes ut predicitur oretenus in mandatis circa predicta operosus et sollers existens cum consilio magistrorum rationalium. [7]
2 Input images
Fifty four images of coins from online auction sites and other websites have been considered. The image resolution ranges from to pixels, most of the images being in the range to pixels. The list of images and their provenance is reported in the Appendix A.
Some of the images have been found to belong to the same coin proposed under multiple auctions. Those duplicates have not been discarded and have been used, a posteriori, to study the ability of the method to identify multiple images of the same coin.
3 Analysis method
The analysis method is based on the identification of a number of reference points whose positions on the images are measured and stored to disk. After this first phase, a numerical analysis is performed to determine coin metrics.
3.1 Reference points
Twelve reference points are identified on the obverse side of each coin, which has been chosen because of its distinctive features. The coin obverse represents the Virgin Mary and the angel Gabriel in the Annunciation scene (Fig. 2). The points have been sampled manually for all coins using the open-source application GIMP [8] and the corresponding array of points is saved to disk in Scalable Vector Graphics (svg) format [9], which contains, encoded in an xml/ascii document, the coordinates of each point. The svg files have been later parsed using a C++ code in order to extract the coordinates and analyze them.
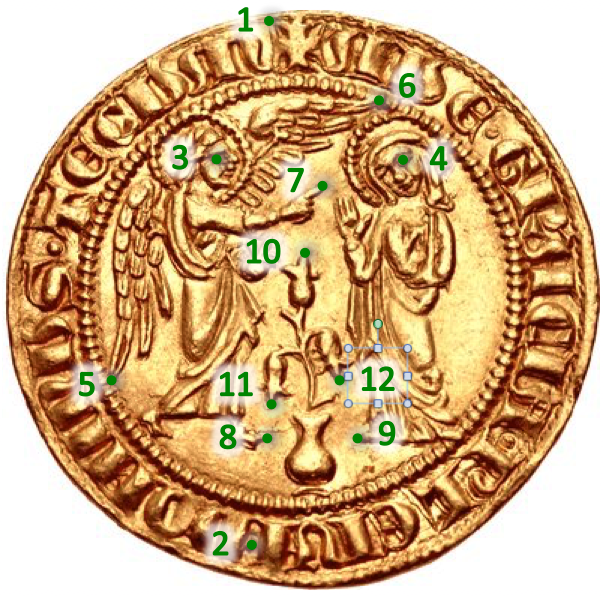
The points represent a number of features of the obverse coin side, namely:
-
1
upper corner of left arm of the cross in the top part of the inscription
-
2
dot in the bottom part of the inscription between the words “\textgothPLENA” and “\textgothDOMINUS”
-
3, 4
right eye of the angel, left eye of the Virgin
-
5, 6
extreme points of the angel’s wings feathers
-
7
angel index finger extreme point
-
8, 9
angel and Virgin’s feet extremes
-
10–12
flowers pistils extremes
In most of the cases, except for the lowest resolution files, the pixel sampling is finer than the uncertainty due to the manual identification of the points, which could also be affected, apart from subjective effects, by picture lightening, shadows, etc.
The reference points are defined in each image by a set of coordinate pairs identified as:
| (1) |
with being the number of sampled points.
The choice of reference points is clearly a crucial task of this method, and depends on the choice of the analyst. Points should be easy to determine unambiguously, so vertices of figures should be preferred, and points along curves (e.g.: along a face profile) should be avoided. Moreover, choosing too many points that are very close each other may reduce the discrimination power of the method, due to the finite precision of the image sampling.
The manual identification of reference points is clearly a somewhat time-consuming task, and could not scale for studies involving large numbers of coins. This may be addressed with automated feature identification, typical of computer-vision algorithms. Anyway, this would limit the usability of the method to expert of computer vision.
3.2 Relative point distances
Before attempting any complex algorithm implementation, one may argue whether a sufficient discrimination of coins minted using different dies could be achieved inspecting the relative distances of individual pairs of points. In order to take into account the different magnification of each photo, distances should be normalized to a reference unit, which may be conveniently taken as .
If the measured values of:
| (2) |
given , , , are determined with sufficient accuracy, coins minted from the same die should have values of very close each other, while coins from different dies would have values of very different from each other.
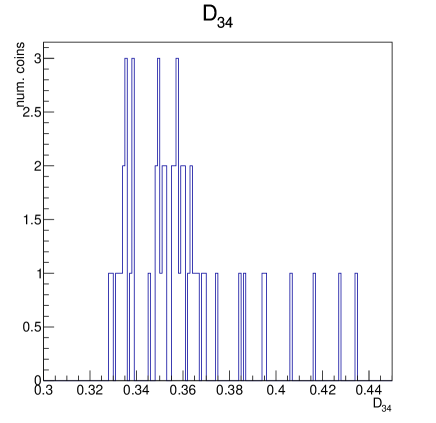
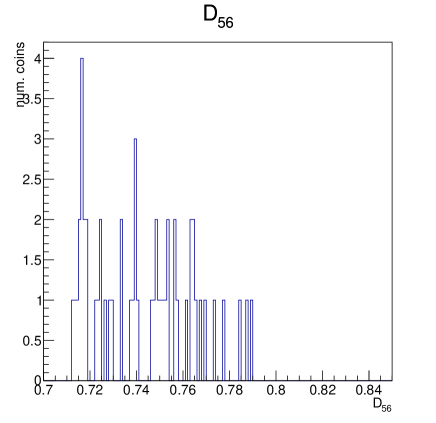
Figure 3 shows the distribution of and for the 54 analyzed coin images. A bin width of 0.001 has been chosen for the histograms in order to possibly identify narrow peaks in the distributions.
Though some clusters of coins accumulate near some particular values of or , most of the measured values appear very sparse in the plot, showing that a single measurement doesn’t provide a convincing indication that allows to unambiguously determine groups of coins belonging to the same die.
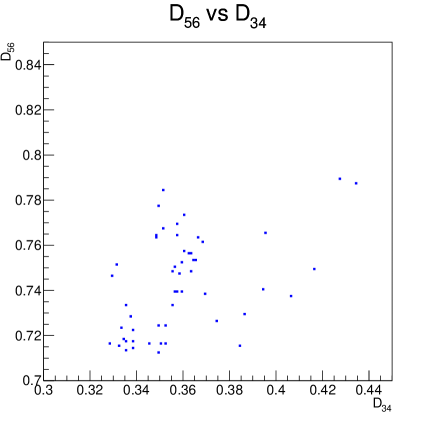
No particular feature can also be spotted in the two-dimensional plot of vs (Fig. 4), though the plot shows some indication of accumulation areas where clusters of coins are present.
The distribution of the relative distances of other coin image pairs, other than the ones shown in Figs. 3 and 4, and not reported here, don’t show evident features in this sense either.
This motivates the use of a metric which exploits the entire set of points, as discussed in the following section.
3.3 Distance metric
Pictures are taken with different magnification and image resolution, and a possible tilt of the coin. Those effects are corrected for by using the transformations described below. Other possible distortions, like perspective effects due to the camera lens axis not being perfectly aligned with the axis orthogonal to the coin’s plane have been neglected, being second order effect with respect to the misalignment angle.
The applied correction consists of a proper translation, rotation and rescaling such that for all coins the first two points and are transformed into the conventional positions and . This is achieved with the following sequence of transformations of all points :
-
1.
Translation to the common origin :
(3) After this translation, the point is be transformed into .
-
2.
Rescaling of all points using the length as unit:
(4) After this rescaling, the transformed length is equal to unity.
-
3.
Rotation:
(5) (6) where and . After this rotation, the point is equal to .
In order to compare two coin images, say and , after the aforementioned set of transformations has been applied, the following metric is defined to quantify the “distance” of the two coin images:
| (7) |
In the sum, the first two terms could be omitted, the difference between first and second points of and being zero, given the application of the above transformation.
The choice of the points 1 and 2 on the coin is motivated by the fact that the two points are approximately extreme points on the coin and their relative determination suffers in this way from a small relative uncertainty compared to other nearer points.
Notice that if only four points are identified (), then , according to Eq. (2).
The idea behind the definition of is that it is equal to a variable, up to a multiplicative factor :
| (8) |
where are the uncertainties in the determination of each coordinate of the coin or , assumed that all individual coordinates determinations within each coin image have the same uncertainty.
For the present study a detailed analysis of the uncertainties has not been performed. A possible extension of the method to properly take into account measurement uncertainties in order to use a variable instead of the variable is discussed in Sec. 6.
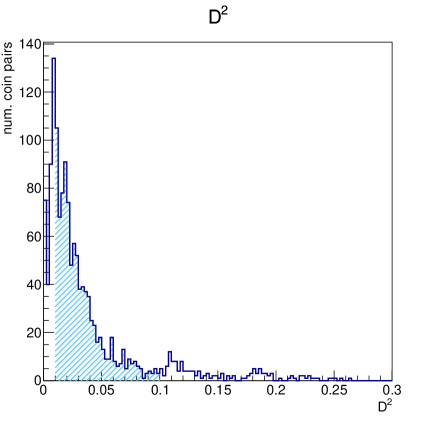
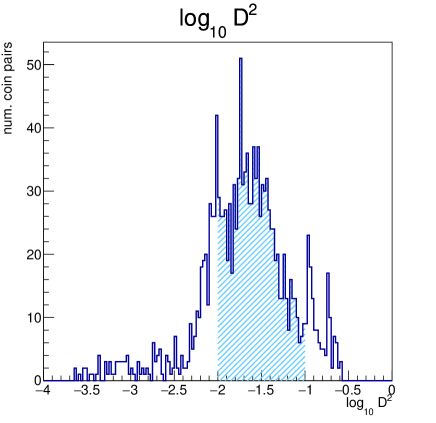
The distribution of for all pairs of the 54 analyzed coin images is shown in Fig. 5 (left). In order to expand the leftmost part of the distribution, where many coin pairs accumulate, the distribution of is also shown in Fig. 5 (right).
4 Identification of coin dies
Coin pairs are sorted by increasing value of . Setting a proper threshold on a maximum value of allows to define pairs of “compatible” coins which could most likely belong to the same die. Hence groups of coins all minted from the same die can be determined accordingly. This procedure was applied together with a visual inspection of the coin pairs in order to validate the method’s results.
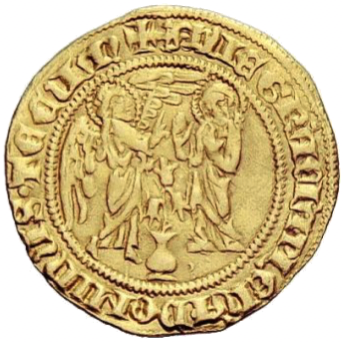
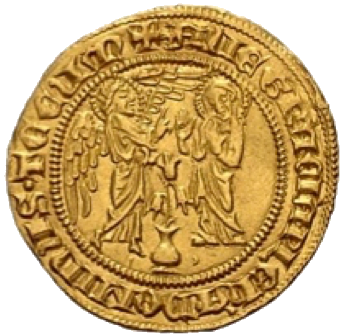
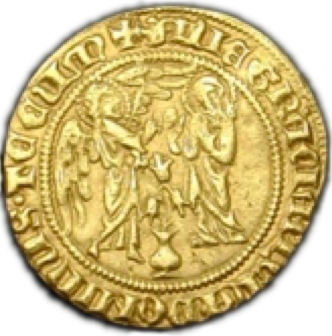
Image pairs corresponding to the very lowest values of , have been found to represent the same coin proposed in different auctions. This validates the power of the method to identify multiple images of the same coin. Figures 6 and 7 show example of image pairs with increasing values of . Images from Fig. 6 show coin pairs which can be visually assigned to the same die (the first pair indeed shows two pictures of the same coin), while Fig. 7 show coin pairs that exhibit significant differences at a visual inspection.
-
•
: ArsCoin Roma auct. 7, lot 1016 (left); ArsCoin Roma auct. 9, lot 1062 (right); two images of the same coin.
-
•
: Hess divo auct. 001, lot 620 (left); Hess divo auct. 326, lot 442 (right).
-
•
: Hess divo auct. 003, lot 764 (left); Hess divo auct. 315, 1203 (right)
-
•
: Heritage auct. 3037, lot 31214 (left); Nomisma auct. 52, lot 864 (right).
-
•
: Ranieri auct. 3, lot 156 (left); Ranieri auct. 8, lot 284 (right).
-
•
: Hess divo auct. 325, lot 468 (left); Ranieri auct. 8, 284 (right). The left coin is from Charles I, the right coin is from Charles II.
All coin pairs having values of lower than appear at a visual inspection to be minted from the same die. For values of above that threshold, coin pairs apparently belonging to different dies are found, according to a visual inspection.
The successful die assignment of the metric is confirmed by other coin features that could not be identified by the simple sampling of the 12 reference points, as seen in Fig. 8, with coins from Charles I.
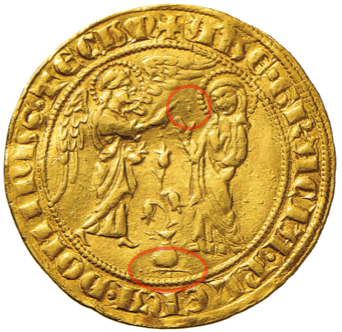
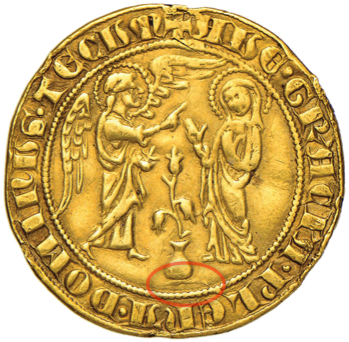
The coins are from Hess divo auct. 305, lot 189 (also proposed as NAC, auct. 68, lot 240), Inasta auct. 49 lot 1156 (also proposed as Nomisma, auct. 52, lot 863) and Nomisma auct. 11 online, lot 3331 (also proposed as Nomisma auct. 52, lot 864 and Nomisma auct 53, lot 1142), respectively. Another example is shown in Fig. 9, again coins from Charles I.

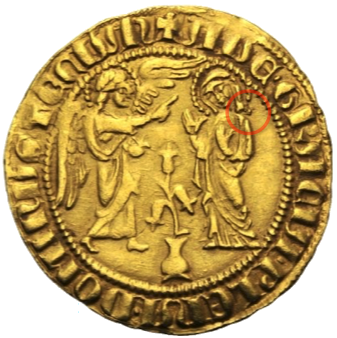
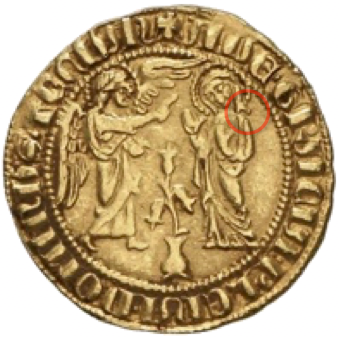
The coins are from ArsCoin Roma auct. 16, lot 935, ArsCoin Roma auct. 12, lot 1092 (also proposed as ArsCoin Roma auct. 16 lot 935), Hess divo auction 311, lot 778 and Varesina sale, code 9082, respectively. A third example of coins from the same die from Charles II is shown in Fig. 10.
The coins are from NAC auct. 56, lot 937, NAC auct. 35, lot 153 and Tkalec, auct. AG, sept. 2008, lot 811, respectively.
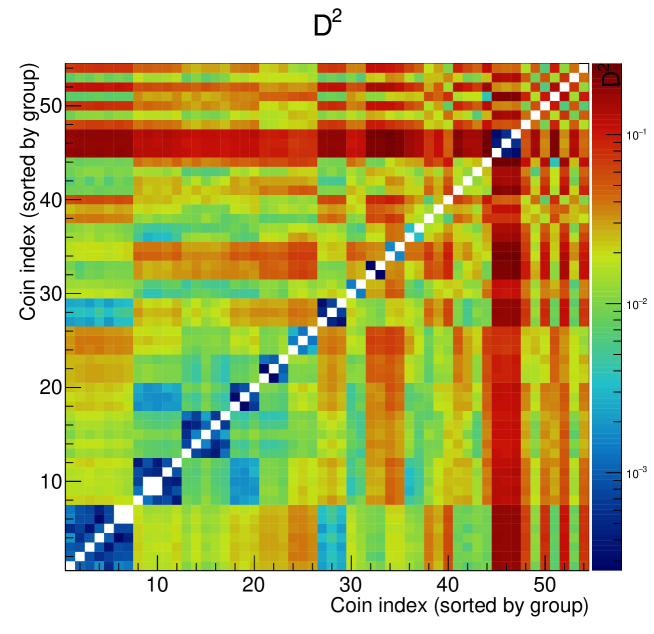
Figure 11 shows the distribution of , represented as color code, for all coin image pairs. Each image pair is represented as a square dot in the two-dimensional plane whose coordinates are the progressive indices of two images. Images have been reordered by groups of pairs all having , such that coins belonging to the same group have adjacent indices. The plot is symmetric around the diagonal because the pairs and have the same value of , for all indices pairs. The bluish square boxes around the white diagonal allow to visually identify the different groups. Coins from Charles I are put first in the scale (index from 1 to 44), while coins minted under Charles II have been put last in the scale (45 to 54). A large difference of Charles II coins with respect to Charles I coins is visible as large bands/areas with red/orange color, which correspond to around times the applied threshold. This reflects the style changes in the coins from one king to his successor.
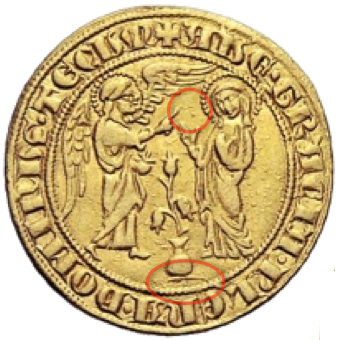
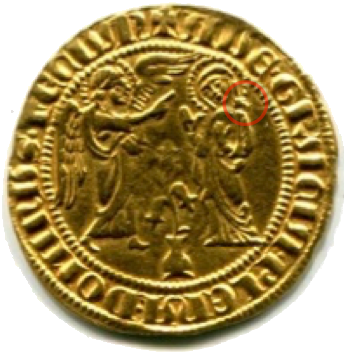
The plot also shows similarity in the dies of the second and fourth coin groups, which anyway can be differentiated by visual inspection by details that are not sampled by the 12 chosen reference points. The first pair with a value above threshold, equal to 0.00178, consists of two coins (Hess divo, auction 311, lot 778 and Hess divo, auction 325, lot 468) belonging to those two groups. Those images show very similar features, but also differences are evident at visual inspection, as visible in Fig. 12:

the angel’s right wing (engraved on the left side of the coin) has the two longest feathers evidently different in the two coins; the inner feather of the left wing are different, and the dotted Virgin’s nimbus seems to be different as well. This feature could have been spotted adding extra points on the wings’ feathers, but those points have not been added a posteriori in order not to bias the method. Apart from those differences, anyway, the relative position of the inscription compared to the inner Annunciation image seems very similar in the two pictures. Possibly, the die has been engraved again after it was worn after frequent usage or otherwise damaged. But this hypothesis has not been investigated any further (it would require a more careful analysis), and the two coin sets have been considered as minted by different dies. With the exception of the two groups of coins related to those two dies (or possibly two modified “versions” of the same die). The similarity between the two dies (or possibly the two versions of the same die) are visible in Fig. 11 as the light blue rectangle between the second group of five coins and fourth group of three coins. Apart for those two groups, all other cases show exhibit significant visual differences and the assignment to different groups seems to been confirmed at a visual inspection.
5 Results
Nineteen groups of coins have been identified to be minted by different dies, for what concerns the coin images from Charles I. Ten groups contain multiple images, they have 7, 5, 5, 3, 3, 3, 3, 2, 2, 2 images respectively, a number of which have been identified as the same coin being proposed in different auctions. The multiple images of the same coin reduce the number of different coins in the identified groups to 5, 4, 3, 3, 3, 3, 2, 2, 2, 2 respectively. The remaining nine coins can be considered each belonging to a different die.
For what concerns the coins from Charles II, three coins have been identified as being minted from the same die, the remaining seven all belong to different dies. No multiple images of the same coin have been found.
All coins have been inspected visually, and the die assignment found by the ordering, provided the assigned threshold of 0.0017, appears to be correct.
6 Uncertainty analysis and other possible improvements
A proper analysis of uncertainties would improve the definition of the metric, possibly allowing the use of a properly defined variable, whose statistical properties would allow to assign a probability value (-value) to each coin pair, and, as consequence, a better interpretation of the definition of a “distance” between two coin images. Indeed, the definition should take into account the considered transformation (translation, rotation and scale) in the error definition and in the computation of the number of degrees of freedom, given the applied constraint on the position of the first two points, and .
For low-resolution images, an uncertainty contribution due to the pixel sampling of times the pixel size should be assigned to the individual measurements of and coordinates of each point. While this contribution could be negligible for images with high resolution, the present analysis shows that the metric appears to increase for the lowest-resolution images, indicating that this contribution should not be neglected in case of poorly sampled images, which may be a common problem for images taken from websites.
For higher resolution images, a way to estimate the uncertainty due to the manual identification of the reference points could be done by sampling multiple images of coins known to be minted from the same die having an image complexity similar to the one under study. This has not been done in the present study due to lack of time and lack of image samples, but could be addressed in the future.
The use of reference points that are determined “by hand” can’t be accurately adopted for curves present on the coins’ images. Those are the cases with profile faces, which are frequently displayed on coins. In those cases, reference points can be found (e.g.: eyes, lips, hairs), but can’t exploit the entire information of the image. Interceptions between such curves and lines joining reference points can be adopted, but this makes the method less immediate to apply.
The present study assumes two “privileged” reference points, numbered as 1 and 2, which are used to calibrate scale, rotation and translation correction of the images. In case of incorrect sampling of those two points, uncertainty on the remaining points is introduced indirectly due to the applied transformations. In order to avoid this possible effect, the scale, rotation and translation correction could be performed by applying a best fit to the transformation parameters minimizing the corresponding as a function of those parameters. This has not been done in the present case, mainly to keep the algorithm simple, and the implementation easy to reproduce. Such a minimization could anyway be easily implemented using the ROOT framework [10]. The determination of the -value from the minimized should properly take into account the total number of degrees of freedom of the fit. In case of some missing reference points, due to poor condition of some of the coins, this could also be treated in the definition with a proper accounting of the number of degrees of freedom. Perspective effects due to misalignment between the camera lens and axes orthogonal to the coin plane could also in principle be take into account in the fit, but, as said before, those effects are expected to be small.
The present method is intended to be simple to use, without requiring too much technological setup or CPU processing time. Anyway, the power of the method could be improved by the addition of more than 12 points, at the cost of more manual per-coin intervention.
The use of computer-based image analysis to identify reference points and other image features would be of great benefit to the application of the method. Anyway this approach is beyond the scope of the present study, which is intended to be easily applicable with a small amount of code development and relatively low effort. On the other hand, the manual detection of reference points avoids possible failures of automated algorithm in identifying reference points, at the cost of a longer manual coin inspection time.
7 Conclusions
A simple numerical algorithm to identify coins minted using the same die has been applied on a sample of golden saluto, a medieval coin minted under the kings of Naples Charles I and Charles II d’Anjou. The algorithm provides a measurement of the “distance” of two coin images which provides a quantitative information that is complementary to the visual inspection of the coins.
The results of the proposed algorithm were consistent with visual inspection: groups of coins identified as having “distance” values below a given threshold appeared, at visual inspection, to be indeed minted from the same die.
8 Acknowledgments
I’m very grateful to Luciano Giannoni for the many e-mail discussions and for triggering the initiative of the study of Charles I coins. I’m also grateful to Francesco Di Rauso and Pietro Magliocca for suggesting documentation and providing me with many hints about the study of numismatics, in particular about the coinage of Naples kingdom.
Appendix A Appendix
The complete list of images analyzed in this study is reported below. Most of the images are taken from auction websites, where the action number and lot number are reported. Few more images have been taken from websites, whose URL is reported. Images are grouped according to the algorithm described in the text. This grouping was also used in Fig. 11.
Charles I
- 1.
-
2.
group:
-
(a)
ArsCoin Roma 12, 1092
-
(b)
ArsCoin Roma 12, 1093
-
(c)
Hess divo 311, 778
-
(d)
Varesina cod. 9082-d
-
(b′)
ArsCoin Roma 16, 935
(same coin as 2b)
-
(a)
- 3.
-
4.
group:
-
(a)
Hess divo 003, 765
-
(b)
Hess divo 325, 468
-
(c)
Ranieri 4, 316
-
(a)
-
5.
group:
-
(a)
Artemide XLIII, 610
-
(b)
Heritage 3037, 31214
-
(c)
Hess divo 321, 1316
-
(a)
-
6.
group:
-
(a)
ArsCoin Roma 5, 901
-
(b)
Artemide XXXIV, 256
-
(c)
CNG 100-1, 788
-
(a)
-
7.
group:
-
(a)
Hess divo 001, 620
-
(b)
Hess divo 326, 442
-
(b′)
NAC 50, 331
(same coin as 7a)
-
(a)
-
8.
group:
-
(a)
ArsCoin Roma 7, 1016
-
(b)
ArsCoin Roma 9, 1052
-
(a)
-
9.
group:
-
(a)
Ranieri 3, 156
-
(b)
Roma 6, 40
-
(a)
-
10.
group:
-
(a)
Il portale del Sud,
http://www.ilportaledelsud.org/ monete.htm -
(b)
Moneta messinese,
http://monetamessinese.altervista.org/ index.php/storia/13-la-monetazione-di-messina-brevi-cenni
-
(a)
-
11.
Hess divo 323, 489
-
12.
Nomisma 50, 151111The resolution of the available image, , doesn’t provide sufficient information for a certain identification. By visual inspection, it could be possibly considered compatible with Hess divo 323, 489, but a better image would be needed inorder to ascertain this statement.
-
13.
Bolaffi 21, 311
-
14.
Bolaffi 23, 353
-
15.
Hess divo 328, 1125
-
16.
NAC 53, 104
-
17.
NAC 76, 140
-
18.
NAC 81, 74
-
19.
Ranieri 8, 283
Charles II
-
1.
group:
-
(a)
NAC 35, 153
-
(b)
NAC 56, 937
-
(c)
Tkalec AG Sep. 2008, 811
-
(a)
-
2.
NAC 57, 206
-
3.
Bolaffi 21, 312
-
4.
CNG 72, 2372
-
5.
Hess divo 001, 621
-
6.
NAC 76, 139
-
7.
Ranieri 8, 284
-
8.
Varesi 67, 265
References
- [1] C. De Beaulieu, “Traité de numismatique celtique i, méthodologie des ensembles,” 1973.
- [2] S. Zambanini, M. Kampel, and M. Schlapke, “On the Use of Computer Vision for Numismatic Research,” in VAST: International Symposium on Virtual Reality, Archaeology and Intelligent Cultural Heritage (M. Ashley, S. Hermon, A. Proenca, and K. Rodriguez-Echavarria, eds.), The Eurographics Association, 2008.
- [3] M. Kampel and M. Zaharieva, “Recognizing ancient coins based on local features,” Advances in Visual Computing, 4th International Symposium, ISVC 2008, Las Vegas, NV, USA, December 1-3, 2008. Proceedings, Part I, pp. 11–22, 2008.
- [4] M. Pannuti and V. Riccio, Le monete di Napoli dalla caduta dell’Impero Romano alla Chiusura della zecca. Lugano: Nummorum Auctiones S.A, 1984. Carlo I d’Angió, n. 1.
- [5] M. Pannuti and V. Riccio, Le monete di Napoli dalla caduta dell’Impero Romano alla Chiusura della zecca. Lugano: Nummorum Auctiones S.A, 1984. Carlo II d’Angió, n. 1.
- [6] A. Giuliani and D. Fabrizi, Le monete degli Angioini in Italia Meridionale. Ariccia (RM): Ed. D’Andrea, 2014.
- [7] Archivio di Stato di Napoli, Archivio Angioino ricostruito, reg. 73, c. 254r, from C. Minieri Ricccio, Genealogia di Carlo II d’Angiò re di Napoli, in “Archivio storico per le provincie napoletane”, 1882–1883, vol. I, pp. 94–95.
- [8] J. Smith and R. Joost, GIMP for Absolute Beginners. Apress, 2012. ISBN13: 978-1-4302-3168-4.
- [9] “Scalable vector graphics (svg).” http://www.w3.org/Graphics/SVG/.
- [10] R. Brun and F. Rademakers, “Root - an object oriented data analysis framework,” Proceedings AIHENP’96 Workshop, Lausanne, Sep. 1996, Nucl. Inst. Meth., vol. A389, pp. 81–86, 1997. See also http://root.cern.ch/.