Present address: ]Hefei National Laboratory for Physical Sciences at the Microscale, University of Science and Technology of China (USTC), Anhui, Hefei 230026, P. R. China. Present address: ]Physikalisches Institut und Röntgen Center for Complex Materials Systems, Universität Würzburg, 97074 Würzburg, Germany.
63Cu-NMR study of oxygen disorder in ortho-II YBa2Cu3Oy
Abstract
We show that 63Cu NMR spectra place strong constraints on both the nature and the concentration of oxygen defects in ortho-II YBa2Cu3Oy. Systematic deviation from ideal ortho-II order is revealed by the presence of inequivalent Cu sites in either full or empty chains. The results can be explained by two kinds of defects: oxygen clustering into additional chains, or fragments thereof, most likely present at all concentrations () and oxygen vacancies randomly distributed in the full chains for only. Furthermore, the remarkable reproducibility of the spectra in different samples with optimal ortho-II order () shows that chain-oxygen disorder, known to limit electronic coherence, is ineluctable because it is inherent to these compounds.
pacs:
74.25.nj, 74.72.Gh, 61.05.Qr, 61.50.Nw, 61.72.jdI Introduction
Dopants play a pivotal role in many correlated electron systems. Their concentration determines the electronic density, the small changes of which can dramatically modify the ground state and the physical properties. Dagotto05 ; Morosan12 At the same time, dopants may impact on electronic properties via lattice strain or electrostatic effects. For instance, the random distribution of dopants produces nanoscale electronic inhomogeneity in some of the high cuprates Cren01 ; McElroy05 ; Singer02 ; Hofman13 , chemical ordering of Pr suppresses large-scale electronic phase separation in maganites Zhu16 or charge ordering in CoO2 layers intertwines with ordering of the mobile Na+ ions in NaxCoO2. Julien08 ; Alloul09a ; Young13
In the high temperature superconductor YBa2Cu3Oy with , O dopants can be made to order into different sequences of oxygen-full and oxygen-empty chains. This makes YBa2Cu3Oy by far the cleanest family of high- cuprates and thus a model system. The so-called ortho-II order in which each full chain is adjacent to two empty chains (Fig. 1a) is of considerable interest because it is the simplest and the best-ordered structure. Andersen99 ; Zimmermann03 ; Casalta96 ; Liang00 ; Liang06 ; Liang12 The particularly low level of disorder that can be achieved in the ortho-II phase has played a pivotal role in the discoveries of Fermi-surface reconstruction Doiron07 and charge order Wu11 .
This, however, does not render the question of the concentration and the nature of the oxygen defects illegitimate: first, since variations of in the oxygen concentration may produce substantial changes in the electronic properties, needs to be accurately measured and controlled, especially when comparing measurements performed on crystals from different groups or from different batches. Second, reducing below the theoretically-ideal ortho-II composition not only changes the hole doping but also inevitably introduces oxygen vacancies, thus disorder. Disentangling these two effects is likely to be important. This is particularly true near where sudden changes in the electronic properties LeBoeuf11 ; Sun04 ; Vignolle12 ; Sebastian10 ; Rullier08 ; Li08 ; Grissonanche14 give clues on the interplay between different electronic orders Hinkov08 ; Haug09 ; Haug10 ; muSR ; Baek12 ; Blanco14 ; Hucker14 ; Wu13a ; Wu13b ; Hirata14 ; Baledent11 . Finally, there is also evidence that oxygen disorder has an impact on the phenomenology of charge ordering Wu14 ; LeTacon14 and more broadly on quasiparticle scattering Bobowski10 , even in the best ortho-II samples. Therefore, clarifying the concentration and type of oxygen defects in the chain layer remains an important task, even (and perhaps especially) in clean YBa2Cu3Oy samples.
In this article, we use NMR spectroscopy to study the different Cu sites in the ortho-II structure of YBa2Cu3Oy: Cu(1F) sites in the oxygen-full chains, Cu(1E) sites in the empty chains (see Fig 1a) as well as planar Cu(2F) and Cu(2E) sites, which are connected to Cu(1F) and Cu(1E), respectively, via an apical oxygen. The observation that the NMR signal associated with each of these crystallographic sites actually consists of several inequivalent sites provides us with microscopic information on the concentration and the spatial distribution of oxygen defects in the chain layer.
II NMR methods
II.1 Experimental details
The main characteristics of the high quality, untwinned, single crystals studied here are summarized in table I.
63Cu NMR spectra were obtained by sweeping the frequency at a fixed magnetic field value ( T, aligned along the crystalline -axis) and by adding the Fourier transforms of the spin-echo signal recorded for regularly-spaced frequency values. Measurement of the spin-echo decay as a function of the time between and pulses showed a Gaussian-type decay for all Cu(1E) peaks, with values ranging from 900 s (left peak in Fig. 2b) to 650 s (right peak). Therefore, for Cu(1E) spectra measured with s, the correction to the intensity is entirely negligible. For Cu(1F), on the other hand, corrections are necessary (see later).
II.2 Background
Any local change in the spatial configuration of oxygen ions in the chain layer is susceptible to affect the NMR resonance frequency of the nearby sites. This site differentiation may arise from two channels: the magnetic hyperfine interaction and the electric quadrupole interaction.
The magnetic hyperfine interaction (between nuclear and electronic spins) is responsible for a shift of the three lines for each 63Cu site. Recall that because 63Cu has a nuclear spin , the NMR spectra consist of a central line (=-1/2 to 1/2 transition) and two ”quadrupole” satellites (=-3/2 to -1/2 and =+1/2 to +3/2 transitions). See Refs. Wu11 ; Wu13b for examples of full 63Cu NMR spectra. In the cuprates, is determined by the spin susceptibility on a given nuclear site as well as on its nearest neighbors (dipolar coupling to more distant sites is negligible).
The electric quadrupole interaction is the interaction between the (quadrupole moment of the) nucleus and the electric-field-gradient (EFG). When it is a perturbation with respect to the Zeeman interaction (which is the case here at 15 T), any EFG change at a given site modifies the position of the central line of this site (only to second order) as well as the separation () between its quadrupole satellites (first-order correction):
| (1) |
where is the electric quadrupole moment of the nucleus, is the largest component of the electric-field-gradient (EFG) tensor ( is the electrostatic potential), and are the polar and azimuthal angles of the applied magnetic field with respect to the principal axes of the EFG tensor and is the asymmetry parameter of the EFG tensor EFG .
II.3 Expected oxygen defects
We expect that the main source of defects in our samples lies in the deviation from the theoretically-ideal ortho-II concentration . On general grounds, the same interactions that favor oxygen order should work against having lone, random, defects. Some indication of oxygen clustering has indeed been obtained in ortho-I samples. cluster1 For , clustering of the extra oxygens into full chains (or fragments thereof) is to be expected from the manifest propensity to systematically order at higher oxygen concentrations. Indeed, new ordered structures (of period-8, 5 or 3) are stabilized for Liang12 .
For , on the other hand, clustering of the vacancies into empty chains may not be significant since ortho-II order never transforms into another ordered phase on decreasing . Lone, random, vacancies may thus be dominant for .
Note that the interstitial position in-between chains is unoccupied and that phase separation, while possible in principle, will be shown to be inconsistent with our results. In all cases, O vacancies should affect the EFG at both Cu(1E) and Cu(1F) sites nearby and thus have signatures in the NMR spectra.
III Results
III.1 Overview of the results
The main results of this study are shown in Figs. 2-4. Basically, we find that the ideal ortho-II structure (namely, single Cu(1E), Cu(1F), Cu(2E) and Cu(2F) sites) is observed in none of our samples. Specifically:
All samples, both and , show several Cu(1F) sites (Fig. 1) that might be related to the existence of (fragments of) extra full chains.
For , the deviations from ideal ortho-II order turn out to be extremely reproducible from one sample to another (Fig. 2).
Crystals with show several inequivalent Cu(1E) sites (Fig. 3), which can be explained by the presence of lone oxygen vacancies in filled chains.
In the following, we discuss these results in more detail.
III.2 Extra full-chain fragments for all concentrations

Let us first consider the concentration for which a non-zero NMR intensity is visible on the low-frequency side of the regular Cu(1F) central line (Fig. 1 and 2b,e). The main difference between these additional sites and the main line resides in their Knight shift value CommentCu(1F) .
In a previous study, similar Cu(1F) NMR signal was initially ascribed to sites near the chain ends Yamani06 . Indeed, because oxygen vacancies break up full chains into fragments, chain ends are expected to experience charge (Friedel) and spin-density oscillations that decay away from a vacancy, along the chain Alloul09 . However, a subsequent theoretical work Chen09 ruled out this interpretation (such oscillations do exist but they only contribute to the symmetric broadening of the main line) and instead proposed that the additional signal actually corresponds to a different valence state, namely Cu+ ions. However, our spectra in Fig. 1 show that this anomalous intensity consists of not one but at least three different peaks in addition to the main line. Furthermore, all these peaks broaden and shift on cooling (not shown), indicating that none of them can be ascribed to a non-magnetic valence configuration.

In principle, insight into the origin of the different peaks can be gained from their relative areas. Here, however, we cannot reliably estimate the relative abundance of the different sites as a fraction of the Cu(1F) sites appears not to be observed, even in the sample. This can be seen from Fig. 1 that shows small Cu(1F) peaks at the very same positions in the and 6.45 samples as in the 6.55 sample. It is clear that the main peak almost entirely looses its intensity upon decreasing . This is because some of the sites have values shorter than the spectrometer dead time. The loss of intensity is clear for the 6.45 and 6.47 samples by comparison with the 6.55 sample, but it is also present, to a lesser extent, in the 6.55 sample itself. Therefore, the relative abundance of the different Cu(1F) sites cannot be reliably extracted, even in the sample.
Nevertheless, it should be clear that the additional Cu(1F) lines cannot correspond to sites near lone vacancies in full-chains or near lone extra oxygen in empty chains. First, the relative intensities of the side peaks (which all have similar values longer than of the main peak) do not match the calculated number of Cu(1F) sites having random vacancies as nearest neighbors (Fig. 6). Second, such lone defects should be visible in Cu(1E) NMR, which is not the case in the 6.55 sample to within our detection limit of 1% (see Fig. 3). The only anomalous signal found in the Cu(1E) spectra of the 6.55 sample is a small peak (asterisk in Fig. 2a) that amounts to 4% of the main peak intensity. Its origin is undetermined yet; it could be related to the anomalous Cu(1F) peaks.
A natural candidate to explain extra Cu(1F) peaks is oxygen ”over-stoichiometry”. Indeed, diffraction studies have demonstrated that ortho-II order is actually strongest (i.e. has largest amplitude and longest correlation length) for rather than for the theoretically optimal value . Zimmermann03 ; Casalta96 ; Blanco14 ; Pekker91 We know that our crystal has optimal ortho-II order, and therefore has this particular concentration, for several reasons: 1) it shows the narrowest NMR line widths of all the samples we have investigated, 2) analysis of the signal intensity is consistent with (ref. intensityratio ), 3) crystals from the same batch show particularly strong quantum oscillations as well as particularly sharp transitions in sound-velocity measurements privatecomm , and 4) these features are perfectly reproducible in several crystals with (we shall return to this point below).
We conclude that the additional Cu(1F) sites most likely reside in extra full chains (which makes them essentially invisible from Cu(1E) NMR), even though we neither have a clear picture nor an unambiguous site assignment. We speculate that the different NMR sites could correspond to fragments of different lengths. In the sample, these extra full-chains naturally account for the extra 0.05 oxygen needed to achieve optimal ordering with respect to the ideal 6.50 concentration. Nonetheless, these extra fragments of full chains turn out to be present in samples with as well. We shall show below that Cu(1E) NMR data also (indirectly) support the hypothesis of extra full chains.
III.3 Inherent oxygen disorder
The crystal was grown in Vancouver while the crystal was grown in Stuttgart. Nonetheless, as Fig. 2 shows, all deviations of the lineshapes from a simple Gaussian or Lorentzian, even the subtlest ones, are identical in the two samples. This is equally true for Cu(1E) and Cu(1F) as well as for Cu(2E) and Cu(2F) signals. This observation is perfectly consistent with the idea of well-defined, systematic, thus ”intrinsic”, oxygen disorder near .
Actually, this particular oxygen disorder is very likely to be present throughout the phase diagram of underdoped YBa2Cu3Oy, whatever the ordered phase: it is known that ortho-VIII and ortho-III orders are stabilized for and , respectively, rather than for the expected values and 6.67. This again suggests the presence of ”extra” 0.05-0.08 oxygen in the chains.
This result implies that oxygen disorder will always limit the CDW correlation length or the electronic mean free path, whatever the quality of the samples.
III.4 Lone oxygen vacancies for
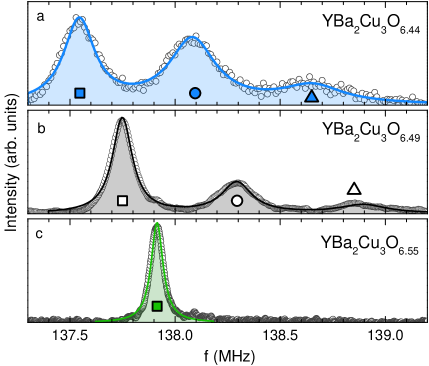
For crystals with , different Cu(1E) sites are observed on the quadrupole satellites (Fig. 3), not on the central lines. This indicates that these sites mostly differ by their quadrupolar parameters (quadrupole frequency and/or to asymmetry parameter ) rather than by their Knight shifts. Given that the positions of the additional Cu(1E) satellites correspond to relatively minor changes of with respect to the main line (representing Cu(1E) far from any defect), we assume that the principal axis of their EFG tensor lies along the -axis, as for the main site, namely in Eqn. 1. Therefore, the differentiation seen here arises from distinct values of and no information regarding possible differences of values can be gained from the spectra.
As mentioned above, vacancies in the ortho-II pattern are to be expected for . Fig. 4 shows the calculated probabilities for a Cu(1E) site to have to 3 randomly-distributed vacancies (V) among its four nearest neighbors as a function of vacancy concentration per total formula unit (that is, per total number of chain-Cu site). A good matching between this calculation and the relative areas of the Cu(1E) peaks is unequivocally obtained if the vacancy concentration is for the sample (nominally 6.45) and for (nominally 6.47).
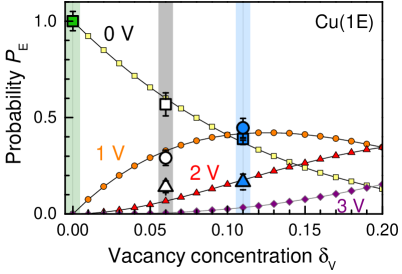
If we assume that the same extra 0.05 oxygen present for are also present at lower doping (see above), the above-determined vacancy concentrations lead to the actual formulas (): YBa2Cu3O6.49 for and YBa2Cu3O6.44 for . These oxygen contents are consistent with expectations from the values of the samples and from their nominal oxygen content, to within an uncertainty of about . Using , on the other hand, leads to less consistent numbers.
It should be noted that there exist different configurations producing Cu(1E) sites with two nearest-neighbor vacancies (see Fig. 1b) and that there is no a priori reason for the modifications of the EFG tensor to be identical for these different Cu(1E)2V sites (Cu(1E) sites with two nearest-neighbor vacancies). Nonetheless, we observe that the change in is a relatively small effect ( % between the first () and second () peaks), and is twice larger between the first and third () peaks (see appendix). This suggests that the changes in are, to first approximation, proportional to the number of nearest-neighbor vacancies, regardless of their location.
Previous NMR studies for reported very similar Cu(1E) NMR spectra (Lutgemeier92 ; Poulakis00 and references therein). However, the vacancies were assumed to order and to create additional empty chains. Accordingly, the different Cu(1E) sites were assigned to the three following configurations: empty chains surrounded by two full chains (pristine ortho-II), pairs of adjacent empty chains and sets of three adjacent empty chains. However, the Cu(1E) and Cu(2) line intensities (Fig. 4) calculated in such an hypothesis would require a significantly lower oxygen content to be consistent with the data. Therefore, generalized clustering into very long chains appears to be inconsistent with the quantitative success of the model of random vacancies. Furthermore, the values of the linewidth and of the NMR relaxation times and of Cu(1F) sites in the sample are notably different from those in the two samples with more vacancies Wu14b . This is consistent with random vacancies significantly reducing the average length of the full-chain fragments. Some oxygen clustering may be present but this is not what differentiates the Cu(1E) sites in NMR and it is not crucial for determining the vacancy concentration in the full chains.
Our data in the doping range also appear inconsistent with the disordered oxygen-poor domains proposed to be intertwined with ortho-II ”puddles” in YBa2Cu3O6.33 Campi13 : if significant parts of the sample had no oxygen order, the random-distribution model would not be quantitatively consistent with the data and the sites from disordered regions should be detected in NMR, which is not the case.
In conclusion, the consistency between modeling and experimental results leads us to conclude that the different Cu(1E) sites observed in the NMR spectra of ortho-II YBa2Cu3Oy with correspond to different positions with respect to randomly-distributed oxygen vacancies in the full chains. In appendix, we show that the hierarchy of values for the different sites are consistent with this assignment (Fig. 5) and that the random distribution of lone vacancies is also consistent with data from the planar Cu(2) sites (Fig. 6).
IV Perspectives and conclusions
Chain-Cu NMR constitutes an interesting, non-destructive, method to probe oxygen defects in ortho-II YBa2Cu3Oy. In the future, it would be interesting to study ordering/disordering of the chains Achkar14 by monitoring the Cu(1E/F) NMR spectrum as a function of pressure and/or annealing time. It would also be interesting to search for similar site differentiation in 17O NMR.
Studying other ordered phases, such as ortho-VIII and ortho-III, could provide valuable information but is likely to be more challenging because their shorter-ranged oxygen order leads to broader lines and their more complex oxygen patterns generate a larger number of inequivalent NMR sites.
To summarize, our NMR spectra provide direct evidence that chain-oxygen disorder is both ineluctable and intrinsic in single crystals of ortho-II YBa2Cu3Oy. A fraction of the oxygens likely clusters into full-chain fragments at all concentrations () while oxygen vacancies randomly distributed in the full chains are identified only for . For optimal ortho-II order (), the reproducibility of the spectra shows that chain-oxygen disorder is ineluctable because it is inherent to these compounds.
Acknowledgments
We are indebted to M. Horvatić and F. Laliberté for comments on the manuscript and to J. Baglo, W. Chen, P. Hirschfeld, C. Proust, D. Le Boeuf for discussions. This work was supported by Pôle SMIng - Université J. Fourier - Grenoble and by the French Agence Nationale de la Recherche (ANR) under reference AF-12-BS04-0012-01 (Superfield). Part of this work was performed at the LNCMI, member of the European Magnetic Field Laboratory (EMFL). Work in Vancouver was supported by the Canadian Institute for Advanced Research and the Natural Science and Engineering Research Council.
Appendix A: and width values for the different lines

Experimental values of the quadrupole frequency for the different lines are shown in Fig. 5a at three different oxygen concentrations, as a function of the number of nearest-neighbor vacancies. Exact values of in increasing order of nearest-neighbor-vacancy number are 31.05, 30.48 and 29.94 MHz for the sample, 31.34, 30.79 and 30.19 MHz for and 31.55 MHz for . Note that Yamani et al. found a larger value of 32.1 MHz consistent with a higher and an actual oxygen content , in spite of the the nominal . Yamani04 The decrease of with increasing vacancy number is consistent with the decrease of of Cu(1E) as the oxygen content is decreased from pure ortho-II order (0 nearest-neighbor vacancies) to the undoped material (, 4 nearest-neighbor vacancies).
Width data in Fig. 5b show that more underdoped samples are more inhomogeneous, presumably due to stronger chemical inhomogeneity.
Appendix B: Cu(1F), Cu(2) and Cu(2F) intensities for random vacancies
Fig. 6a shows the probability for a Cu(1F) site to have vacancies among its two nearest-neighbors. The numbers are clearly inconsistent with the relative intensities of the different Cu(1F) lines in Fig. 1 (even considering uncertainties related to the partial wipeout of the main peak), showing that these lines cannot be attributed to the sites neighboring lone, random oxygen vacancies.

Fig. 6b shows the predicted ratio of the integrated intensities of the ”Cu(2E)” and ”Cu(2F)” NMR lines, under the assumption that of each of the two Cu(2F) which are nearest-neighbors to (at least) one vacancy (Fig. 1b) is closer to of Cu(2E) sites than to of Cu(2F) sites of the pristine ortho-II structure. Hence, these particular Cu(2F) nuclei actually resonate in the ”Cu(2E)” NMR line (Fig. 2f shows the composite nature of the Cu(2E) and Cu(2F) lines). The number of such sites is readily calculated since it is equal to the number of Cu(1F) neighboring one, or more, vacancy (panel (a)). The random distribution model, with the above assumption, predicts a growth of the intensity ratio of the Cu(2E)-like NMR line at the expense of the Cu(2F)-like line with increasing number of vacancies which is again in quantitative agreement with the experimental values (uncorrected for possible differences). In contrast, the calculated ratio under the assumption that all of the vacancies form empty chains is twice smaller.
References
- (1) E. Dagotto, Science 309, 257 (2005).
- (2) E. Morosan, D. Natelson, A.H. Nevidomskyy, and Q. Si, Adv. Mater. 24, 4896 (2012).
- (3) T. Cren, D. Roditchev, W. Sacks and J. Klein, Europhys. Lett. 54, 84 (2001).
- (4) K. McElroy, Jinho Lee, J. A. Slezak, D.-H. Lee, H. Eisaki, S. Uchida, and J. C. Davis, Science 309, 1048 (2005).
- (5) P.M. Singer, A.W. Hunt, and T. Imai, Phys. Rev. Lett. 88, 047602 (2002).
- (6) I. Zeljkovic and J. E. Hoffman, Phys. Chem. Chem. Phys., 15, 13462 (2013).
- (7) Y. Zhu et al., Nat. Commun. 7, 11260 (2016).
- (8) M.-H. Julien, C. de Vaulx, H. Mayaffre, C. Berthier, M. Horvatić, V. Simonet, J. Wooldridge, G. Balakrishnan, M.R. Lees, D.P. Chen, C.T. Lin, P. Lejay, Phys. Rev. Lett. 100, 096405 (2008).
- (9) H.Alloul, I.R.Mukhamedshin, T.A.Platova, A.V.Dooglav, Europhysics Letters 85, 47006 (2009).
- (10) B.-L. Young, P.-Y. Chu, J. Y. Juang, G. J. Shu, and F. C. Chou, Phys. Rev. B 88, 064418 (2013).
- (11) N.H. Andersen, M. von Zimmermann, T. Frello, M. Kall, D. Monster, P.A. Lindgard, J. Madsen, T. Niemoller, H.F. Poulsen, O. Schmidt, J.R. Schneider, T. Wolf, R. Liang, P. Dosanjh and W.N. Hardy, Physica C 318, 259 (1999).
- (12) M. von Zimmermann, J.R. Schneider, T. Frello, N.H. Andersen, J. Madsen, M. Kall, H.F. Poulsen, R. Liang, P. Dosanjh and W.N. Hardy, Phys. Rev. B 68, 104515 (2003).
- (13) H. Casalta, P. Schleger, P. Harris, B. Lebech, N.H. Andersen, R. Liang, P. Dosanjh, W.N. Hardy, Physica C 258, 321 (1996).
- (14) R. Liang, D.A. Bonn, and W.N. Hardy, Physica C 336, 57 (2000).
- (15) R. Liang, D.A. Bonn, and W.N. Hardy, Phys. Rev. B 73, 180505 (2006).
- (16) R. Liang, D.A. Bonn, and W.N. Hardy, Philosophical Magazine 92, 2563 (2012).
- (17) N. Doiron-Leyraud, C. Proust, D. LeBoeuf, J. Levallois, J.-B. Bonnemaison, R. Liang, D. A. Bonn, W. N. Hardy, and L. Taillefer, Nature (London) 447, 565 (2007).
- (18) T. Wu, H. Mayaffre, S. Krämer, M. Horvatić, C. Berthier, W.N. Hardy, R. Liang, D.A. Bonn, M.-H. Julien, Nature 477, 191 (2011).
- (19) T. Wu, H. Mayaffre, S. Krämer, M. Horvatić, C. Berthier, R. Liang,W. N. Hardy, D. A. Bonn, and M.-H. Julien, Nat. Commun. 6, 6438 (2015).
- (20) M. Le Tacon, A. Bosak, S. M. Souliou, G. Dellea, T. Loew, R. Heid, K.-P. Bohnen, G. Ghiringhelli, M. Krisch, and B. Keimer, Nat. Phys. 10, 52 (2014).
- (21) J. S. Bobowski, J. C. Baglo, J. Day, Lynne Semple, P. Dosanjh, P. J. Turner, R. Harris, Ruixing Liang, D. A. Bonn, and W. N. Hardy Phys. Rev. B 82, 134526 (2010).
- (22) X. F. Sun, K. Segawa, and Y. Ando, Phys. Rev. Lett. 93, 107001 (2004).
- (23) F. Rullier-Albenque, H. Alloul, F. Balakirev, and C. Proust, Europhys. Lett. 81, 37008 (2008).
- (24) B. Vignolle, B. J. Ramshaw, J. Day, D. LeBoeuf, S. Lepault, R. Liang, W. N. Hardy, D. A. Bonn, L. Taillefer, and C. Proust, Phys. Rev. B 85, 224524 (2012).
- (25) S. E. Sebastian, N. Harrison, M. M. Altarawneh, C. H. Mielke, R. Liang, D. A. Bonn, W. N. Hardy, and G. G. Lonzarich, Proc. Natl. Acad. Sci. USA 107, 6175 (2010).
- (26) D. LeBoeuf, N. Doiron-Leyraud, B. Vignolle, M. Sutherland, B. J. Ramshaw, J. Levallois, R. Daou, F. Laliberté, O. Cyr-Choiniére, J. Chang, Y. J. Jo, L. Balicas, R. Liang, D. A. Bonn, W. N. Hardy, C. Proust, and L. Taillefer, Phys. Rev. B 83, 054506 (2011).
- (27) S. Li, Z. Yamani, H. J. Kang, K. Segawa, Y. Ando, X. Yao, H. A. Mook, and P. Dai, Phys. Rev. B 77, 014523 (2008).
- (28) G. Grissonnanche, O. Cyr-Choiniére, F. Laliberté, S. René de Cotret, A. Juneau-Fecteau, S. Dufour-Beauséjour, M. -E. Delage, D. LeBoeuf, J. Chang, B. J. Ramshaw, D. A. Bonn, W. N. Hardy, R. Liang, S. Adachi, N. E. Hussey, B. Vignolle, C. Proust, M. Sutherland, S. Krämer, J. -H. Park, D. Graf,N. Doiron-Leyraud, and L. Taillefer, Nature Commun. 5, 3280 (2014).
- (29) F. Coneri, S. Sanna, K. Zheng, J. Lord, and R. De Renzi, ibid. 81, 104507 (2010).
- (30) V. Hinkov, D. Haug, B. Fauqué, P. Bourges, Y. Sidis, A. Ivanov, C. Bernhard, C. T. Lin, and B. Keimer, Science 319, 597 (2008).
- (31) D. Haug, V. Hinkov, A. Suchaneck, D. S. Inosov, N. B. Christensen, C. Niedermayer, P. Bourges, Y. Sidis, J. T. Park, A. Ivanov, C. T. Lin, J. Mesot, and B. Keimer, Phys. Rev. Lett. 103, 017001 (2009).
- (32) D. Haug, V. Hinkov, Y. Sidis, P. Bourges, N. B. Christensen, A. Ivanov, T. Keller, C. T. Lin and B. Keimer, New J. Phys. 12, 105006 (2010).
- (33) S.-H. Baek, T. Loew, V. Hinkov, C. T. Lin, B. Keimer, B. Büchner, and H.-J. Grafe, Phys. Rev. B 86, 220504(R) (2012).
- (34) T. Wu, H. Mayaffre, S. Krämer, M. Horvatić, C. Berthier, P. L. Kuhns, A. P. Reyes, R. Liang,W. N. Hardy, D. A. Bonn, and M.-H. Julien, Nat. Commun. 4, 2113 (2013).
- (35) T. Wu, H. Mayaffre, S. Krämer, M. Horvatić, C. Berthier, C. T. Lin, D. Haug, T. Loew, V. Hinkov, B. Keimer, and M.-H. Julien, Phys. Rev. B 88, 014511 (2013).
- (36) S. Blanco-Canosa, A. Frano, E. Schierle, J. Porras, T. Loew, M. Minola, M. Bluschke, E. Weschke, B. Keimer, and M. Le Tacon, Phys. Rev. B 90, 054513 (2014).
- (37) M. Hücker, N. B. Christensen, A. T. Holmes, E. Blackburn, E. M. Forgan, R. Liang, D. A. Bonn, W. N. Hardy, O. Gutowski, M. v. Zimmermann, S. M. Hayden, and J. Chang, Phys. Rev. B 90, 054514 (2014).
- (38) M. Hirata et al., in preparation.
- (39) V. Balédent, D. Haug, Y. Sidis, V. Hinkov, C. T. Lin, and P. Bourges, Phys. Rev. B 83, 104504 (2011).
- (40) E. N. Kaufmann and R. J. Vianden, Rev. Mod. Phys. 51, 161 (1979).
- (41) Z. Yamani, W.A. MacFarlane, B.W. Statt, D. Bonn, R. Liang, W.N. Hardy, Physica C 405, 227 (2004).
- (42) A. Erb et al., Solid State Commun. 112, 245 (1999). T. Nishizaki, K. Shibata, M. Maki, and N. Kobayashi, J. Low Temp. Phys. 131, 931 (2003). O. M. Auslaender, L. Luan, E. W. J. Straver, J. E. Hoffman, N. C. Koshnick, E. Zeldov, D. A. Bonn, R. Liang, W. N. Hardy, and K. A. Moler, Nat. Phys. 5, 35 (2009).
- (43) We have checked this point by comparing central lines of 63Cu and 65Cu isotopes. Note that the quadrupole satellites are extremely broad and weak. They show some structure but no correspondance with the various central lines could be established.
- (44) Z. Yamani, B. W. Statt, W. A. MacFarlane, Ruixing Liang, D. A. Bonn, W. N. Hardy, Phys. Rev. B 73, 212506 (2006).
- (45) H. Alloul, J. Bobroff, M. Gabay, and P. J. Hirschfeld, Rev. Mod. Phys. 81, 45 (2009).
- (46) W. Chen and P.J. Hirschfeld, Phys. Rev. B 79, 064522 (2009).
- (47) S. Pekker, A. Jánossy and A. Rockenbauer, Physica C 181, 11 (1991).
- (48) After integration of the NMR signal of the central lines over frequency and correction for decay, we find that Cu(1F) is indeed more intense than Cu(1E). The intensity ratio translates into an actual oxygen content , which must be considered as a lower bound because a small part of the Cu(1F) intensity is most likely wiped out in this sample.
- (49) C. Proust and D. Le Boeuf, private communications.
- (50) H. Lütgemeier, I. Heinmaa, S. Pekker, G. Krabbes, and M. Buchgeister, Appl. Magn. Reson. 3, 689 (1992).
- (51) N. Poulakis, K. Conder, E. Kaldis and Y. Berthier, Physica C 341, 2001 (2000).
- (52) T. Wu et al., unpublished 63Cu NMR data.
- (53) G. Campi, A. Ricci, N. Poccia, L. Barba, G. Arrighetti, M. Burghammer, A.S. Caporale, and A. Bianconi, Phys. Rev. B 87, 014517 (2013).
- (54) A. J. Achkar, X. Mao, C. McMahon, R. Sutarto, F. He, Ruixing Liang, D. A. Bonn, W. N. Hardy, and D. G. Hawthorn, Phys. Rev. Lett. 113, 107002 (2014).
- (55) Only low-frequency satellites are shown since at 15 T the high-frequency satellites overlap with the planar Cu(2) satellites. An example of a full 63Cu spectrum is shown in Fig. 1 of Ref. Wu13b (note that the coarse frequency resolution of the Cu(1E) satellite in Ref. Wu13b results in a misrepresentation of the relative intensity ratio of the different Cu(1E) lines).
- (56) M. Mali, I. Mangelschots, H. Zimmermann, and D. Brinkmann, Physica C 175, 581 (1991).