An Ultra-Fast X-ray Disk Wind in the Neutron Star Binary GX 3400
Abstract
We present a spectral analysis of a brief Chandra/HETG observation of the neutron star low-mass X-ray binary GX 3400. The high-resolution spectrum reveals evidence of ionized absorption in the Fe K band. The strongest feature, an absorption line at approximately 6.9 keV, is required at the 5 level of confidence via an -test. Photoionization modeling with XSTAR grids suggests that the line is the most prominent part of a disk wind with an apparent outflow speed of . This interpretation is preferred at the level over a scenario in which the line is H-like Fe XXVI at a modest red-shift. The wind may achieve this speed owing to its relatively low ionization, enabling driving by radiation pressure on lines; in this sense, the wind in GX 3400 may be the stellar-mass equivalent of the flows in broad absorption line quasars (BALQSOs). If the gas has a unity volume filling factor, the mass ouflow rate in the wind is over , and the kinetic power is nearly (or, 5–6 times the radiative Eddington limit for a neutron star). However, geometrical considerations – including a small volume filling factor and low covering factor – likely greatly reduce these values.
Subject headings:
accretion disks – X-rays: binaries1. Introduction
Accretion onto neutron stars with low magnetic fields is expected to be similar to accretion onto black holes, or at least black holes with low spin parameters. Time scales and line shifts should simply scale with mass, and with the depth of the inner edge of the disk within the potential well. Observations appear to confirm this expectation: quasi-periodic oscillations scale in the expected manner (e.g., Wijnands & van der Klis 1999), and relativistic lines from neutron stars place interesting limits on stellar radii but are not as extreme as lines from spinning black holes (e.g. Cackett et al. 2008, 2010; Di Salvo et al. 2009; Papitto et al. 2009; Miller et al. 2013).
Accretion flows onto neutron stars and black holes might be even more similar, far from the compact object. X-ray disk winds from stellar-mass black holes are emerging as important facets of the accretion flow; in some cases, the mass loss rate can rival or exceed the accertion rate in the inner disk (e.g. King et al. 2012, 2015; Miller et al. 2015). Such winds appear to arise between from the black hole, depending on particulars. Ionized X-ray absorption is commonly observed in neutron star binaries, but evidence of outflowing gas has lagged the rapid progress being made in stellar-mass black holes. Nevertheless, evidence of disk winds in neutron star X-ray binaries is growing, with flows in GX 131 (e.g., Ueda et al. 2004) and IGR J174802446 (Miller et al. 2011) marking two prominent examples.
In some moderate-resolution spectra of active galactic nuclei (AGN) extremely fast outflows with very high mass fluxes have been observed (e.g., Tombesi et al. 2010). These winds may contribute significantly to feedback and the co-evolution of massive black holes and host galaxies. In stellar-mass black holes, outflow speeds of 0.01–0.05 are detected at gratings resolution (e.g., King et al. 2012, 2015, Miller et al. 2015). Such flows have not previously been reported in the steady emission of neutron star X-ray binaries (but see Pinto et al. 2014 for evidence of fast outflows during bursts).
GX 3400 is a neutron star X-ray binary, located close to the Galactic Plane. It is known to be a low-mass X-ray binary and a “Z” source based on its behavior in X-ray color-color diagrams (Hasinger & van der Klis 1999). Cackett et al. (2010) analyzed an XMM-Newton observation of GX 3400, and found evidence of a relativistic iron line from the inner disk, strongly impacted by X-ray absorption consistent with H-like Fe XXVI (also see D’Ai et al. 2009). Lavagetto et al. (2004) also found X-ray absorption in a BeppoSAX spectrum of GX 3400; this was modeled with a Gaussian at 6.8 keV. This energy lies between Fe XXV (6.70 keV) and Fe XXVI (6.97 keV), and would imply a large velocity shift. In order to better understand the nature of the ionized X-ray absorption in GX 3400 at high resolution, we have analyzed archival Chandra/HETG spectra of the source.
2. Observations and Reduction
Chandra has observed GX 3400 on four occasions, but only spectra from ObsID 1922 show evidence of a disk wind; it is the sole focus of this paper. Observation 1922 started on 2001-08-09 at 12:35:11 (UT). After our reduction, we find that a net exposure time of 5.8 ks was achieved.
The data were reduced using CIAO version 4.7 and the associated calibration files. We downloaded the full observation from the Chandra archive. The standard sequence of routines, tgdetect, tg_create_mask, tg_resolve_events, and tgextract were run to produce first-order spectral files. When executing tg_create_mask, we set the parameter “width_factor_hetg” to have a value of 17, rather than the default of 35. This reduces the width of the HEG extraction regions, with the effect of better selecting true first-order HEG photons and enabling the extraction of spectra that carry out to 10 keV. The tools mkgrmf and fullgarf tasks were run to create response files. Finally, add_grating_spectra was run to combine the first-order spectra and responses, and the FTOOL “grppha” was used to group the co-added first-order HEG spectrum to require at least 10 counts per bin.
3. Analysis and Results
The spectra were fit using XSPEC version 12.8.2 (Arnaud 1996). The “Churazov” weighting scheme was applied in minimizing the fitting statistic. All errors reported in this work reflect parameter values at the confidence limits.
Cackett et al. (2010) report an interstellar column density of along the line of sight to GX 3400. D’Ai et al. (2009) report similarly high values. This greatly diminishes the low energy flux from this source. Owing to the lack of sensitivity at low energy, and also owing to chip gaps creating calibration uncertainties in the 3–4 keV range, our analysis was restricted to the combined HEG spectrum and the 4–10 keV band.
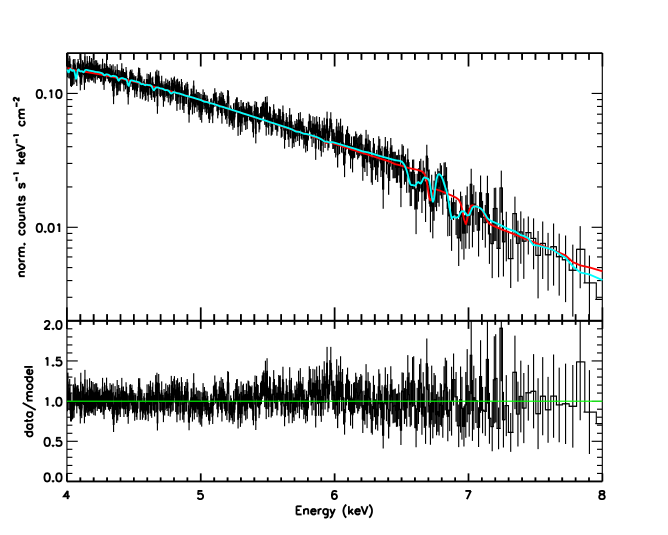
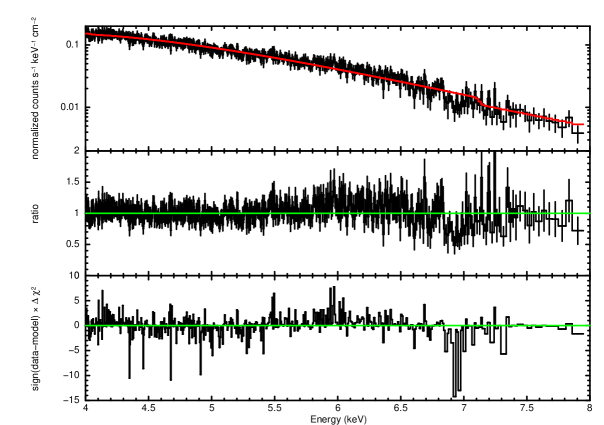
An initial fit to the spectrum with an absorbed disk blackbody model (; Wilms et al. 2000, Mitsuda et al. 1984) captures the continuum fairly well, but leaves strong residuals in the Fe K band. The resultant fit statistic is . The implied column density is , and the disk temperture is keV.
Figure 1 depicts this simple model for the spectrum, as well as the data/model ratio, and deviations from the continuum as measured in units of . There is a broad flux excess above the continuum in the 5.5–6.5 keV range; this is likely an Fe K emission blurred by effects in the inner accretion disk. D’Ai et al. (2009) and Cackett et al. (2010) both detected this disk line in independent analyses. The most striking and significant feature, however, is an apparent absorption line at 6.9 keV. The addition of a Gaussian model for this line improves the overall fit to .
We performed 2000 Monte Carlo simulations of an absorbed disk spectrum with no line features. We fitted and conducted error bar searches on the resulting spectra with a model including a Gaussian line (emission or absorption) anywhere in the 4–10 keV range. The detection of a line feature with equal or greater strength is 99.6% unlikely. This represents a conservative probability for a blind search; in contrast, our search focused on the Fe K band. The change in indicates a line significant at the level of confidence, as measured by an -test. Counting the number of resolution elements in the 6.7–7.3 keV band as independent trials, the significance is reduced to .
The best-fit line energy is keV. The rest-frame energy of the He-like Fe XXV resonance line is 6.700 keV, and the rest-frame energy of the H-like Fe XXVI resonance line is 6.970 keV (Verner et al. 1996). Thus, the line could represent absorption in a modest inflow, or in a strong outflow. There are weaker features in the 6.5–6.8 keV range and in the 7.0–7.5 keV range that may aid a self-consistent determination of whether the gas is an inflow or outflow.
To address this question, physical self-consistency is required; line-by-line fitting is not sufficient. We therefore constructed a grid of XSTAR photoionized absorption models (e.g., Kallman & Bautista 2001). A turbulent velocity of and solar abundances were assumed. A nominal gas density of was also assumed. A covering factor must also be specified; we selected based on examples of similar absorption in stellar-mass black holes (e.g., Miller et al. 2015). Based on the disk blackbody fit, an input spectrum with keV and a 2–30 keV luminosity of was assumed (based on the unabsorbed flux and an assumed distance of 8.5 kpc; see Penninx et al. 1993) . A grid of models spanning a broad range in column density and ionization was generated using the “xstar2xspec”, and included in our subsequent XSPEC fits as a multiplicative table model.
When the grid is allowed to act on the blackbody continuum, it is a improvement over a model without the absorption, giving . In this fit, and . Importantly, a blue-shift of is measured. A model wherein the flow is required to have either zero shift or a red-shift, is significantly worse: . This is true despite the fact that the ionization parameter moves up to , as expected if Fe XXVI must be very strong relative to Fe XXV. An F-test prefers the blue-shifted model over the zero-shift model at the level of confidence. This result does not depend on the interstellar column density; the same blue-shift results when a value of is enforced (though the overall fit is not as good).
This indicates that the absorption is best associated with an rapid outflow. However, it is possible that the overall spectral model is still too simple. Prior work has found evidence of a relativistic disk line in GX 3400, and the broad flux excess in Figure 1 appears to confirm this feature in the combined Chandra/HEG spectrum. We there added a simple relativistic line, “diskline” (Fabian et al. 1989), in the next model. “Diskline” is characterized in terms of a line energy (restricted to the 6.40–6.97 keV range for Fe I–XXVI in our fits), an disk emissivity index (, bounded to lie in the range), an inner disk radius (measured in units of ), an outer disk radius (fixed at ), the inner disk inclination (bounded between ) and a flux normalization.
A model consisting of improves the fit at the level of confidence, to . The absorption is not substantially changed, a blue-shift of is again measured (, ). The measured diskline parameters include keV, , , , and a normalization of (translating into an equivalent width of eV). This model is preferred over one including a disline but disallowing blue-shifts at the level of confidence ().
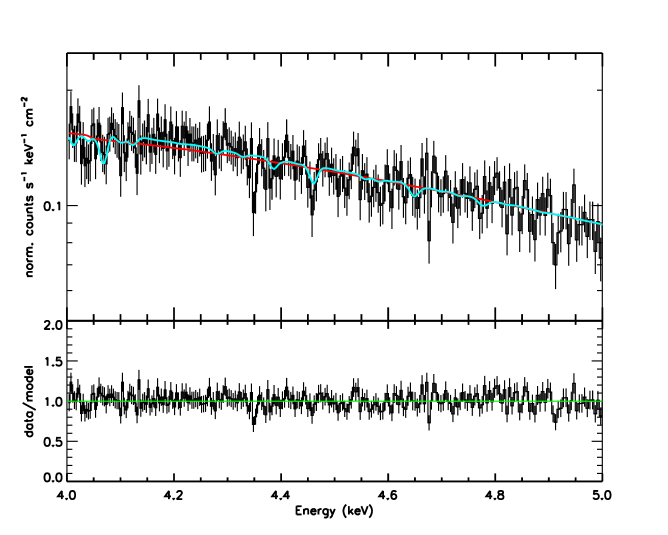
Weak residuals remain in the Fe K band, suggesting that the wind is more complex than our single-zone model. A model with three zones achieves only modest improvements in the fit statistic, giving . This fit accounts for weaker residuals in the Fe K band, but also fits some apparent lines in the 4–5 keV band that can be associated with He-like Ca XIX and H-like Ca XX (see Figures 2 and 3). We regard this model as our best-fit model; it is fully described in Table 1. The best model wherein all three components cannot be blue-shifted gives (a difference for a change of one free parameter); the best three-component model wherein only one component is disallowed a blue-shift gives (a difference for a change of one free parameter).
The data do not require re-emission from the wind; dynamical broadening of such emission can potentially give radius constraints (e.g. Miller et al. 2015, 2016). Winds do not have to be launched with the local escape speed; rather, they can be accelerated continually, or once certain conditions obtain. However, within this framework, an outflow velocity of corresponds to a launching radius of cm (assuming a neutron star of ).
The mass outflow rate in each component can be calculated by starting with the standard formula, . Adjusting for a non-spherical flow, and writing in terms of number density, the equation becomes (where is the covering factor, is the mean atomic weight, is the mass of the proton, and is the number density). Using the ionization parameter (recall, ), it is possible to write the mass outflow rate without assuming a density: . The kinetic power in the outflow is then just .
For the fast component detected in GX 3400, the mass outflow rate is , or . This is a very high mass flux; the implied inflow rate at the inner disk is just , assuming an efficiency of . The implied power in the fast component is even more extreme: . This implies that the mechanical power exceeds the radiative eddington limit by a factor of 5–6.
The estimates can be interpreted as the mass outflow rate and kinetic power divided by the filling factor. If the volume filling factor is, e.g., (commensurate with some AGN; see, e.g., Blustin et al. 2005), the actual outflow rate is sub-Eddington and the mass outflow rate is also reduced in direct proportion. If the launching radius derived by associating the observed wind speed with a local escape velocity is used, a very high density value results (), and implies . This would reduce the mass outflow rate and kinetic power in GX 3400 by four orders of magnitude. The mass outflow rate would then agree with the inferred mass accretion rate at the inner disk, to within a factor of a few. However, as noted above, there is no requirement that the observed wind speed is a local escape velocity. If the filling factor is not low, it may be the case that GX 3400 was observed in a super-Eddington phase.
4. Discussion and Conclusions
We have analyzed an archival Chandra/HETG spectrum of the neutron star low-mass X-ray binary GX 3400. The spectra reveal strong evidence of a single strong line close to 6.9 keV, and several weaker aborption lines. Self-consistent photoionization modeling establishes that the feature is most likely produced in a complex disk wind, with a component that is blue-shifted by . Even if the wind has a low volume filling factor, its mass outflow rate and kinetic power would still rank among the highest – or as the highest – yet detected from a neutron star or stellar-mass black hole. In this section, we discuss the physical processes by which the wind may be driven, and compare the outflow to extreme winds detected in other sources.
Disk winds detected in Chandra observations of V404 Cyg and IGR J170913634 may offer the best points of comparison for GX 3400. The 2015 outburst of V404 Cyg was particularly extreme, and it is possible that the mass accretion rate was highly super-Eddington in some phases. In spectra of V404 Cyg, the observed velocity shifts exceed and the implied mass outflow rate is approximately (assuming a unity filling factor; King et al. 2015). Spectra of IGR J170913624 reveal a wind with two components, with speeds of and . Here again, the total outflow rate would approach for a unity filling factor, but the filling factor may be of order (King et al. 2012).
If the filling factor of the wind in GX 3400 is not small, the outflow power may actually exceed the observed radiative luminosity. This would likely signal super-Eddington accretion in GX 3400. The wind would then be driven by electron scattering pressure. At least one ultra-luminous X-ray (ULX) source is powered by a neutron star (Bachetti et al. 2014), and population considerations suggest that a number of ULXs may harbor neutron stars (King & Lasota 2016). However, a super-Eddinton flow is difficult to reconcile with the detection of a relativistic disk line: the central engine should be blocked by a super-Eddington photosphere. Moreover, the observed column density in the outflow is well below (see Table 1).
Unlike the disk winds that are typically observed in stellar-mass black holes, the wind in GX 3400 has components with an ionization parameter below . Simulations have identified this as a threshold below which radiation pressure on lines can drive disk winds (e.g., Proga 2003). Directly tapping into the radiative luminosity may help to explain why the outflow in GX 3400 has a high speed. In this sense, the observed wind may be similar to the extreme outflows in BALQSOs (e.g., Arav et al. 2001).
In BALQSOs, however, geometric shielding is required to keep the gas from becoming over-ionized by X-rays. It is unclear how such shielding might be achieved in an X-ray binary, particularly when the relativistic emission line in this system indicates a clear view of the inner disk (e.g., D’Ai et al. 2009, Cackett et al. 2010). It may be the case that a combination of mechanisms, plausibly including radiative pressure, thermal driving (e.g. Begelman et al. 1983), and magnetic processes (e.g. Blandford & Payne 1982; Proga 2003) act to drive the wind in GX 3400. It is notable that the inclination angle of indicated by the relativistic line, is commensurate with the optimal angle for driving magnetocentrifugal winds (Blandford & Payne 1982).
Figure 4 shows the 1.5–12.0 keV RXTE/ASM light curve of GX 3400, spanning intervals near the observation in which we have detected a strong wind, and two subsequent Chandra observations that appear to lack strong absorption. The wind is detected in the observation with the lowest flux, though the level is only 10–20% below the observations lacking wind absorption. Hardness ratios might reveal more information, but the ASM ratios are insensitive owing to the very high column density along the line of sight to GX 3400. Triggered observations based on MAXI light curves and hardness ratios may be able to reveal links between the state of the disk and wind production in GX 3400.
References
- (1)
- (2) Arav, N., et al., 2001, ApJ, 561, 118
- (3)
- (4) Arnaud, K., 1996, Astronomical Data Analysis Software and Systems V, ASP Converence Series, eds. G. H. Jacoby and J. Barnes, 101, 17
- (5)
- (6) Bachetti, M., et al., 2014, Nature, 514, 202
- (7)
- (8) Begelman, M., McKee, C., Shields, G., 1983, ApJ, 271, 70
- (9)
- (10) Blandford, R., & Payne, D., 1982, MNRAS, 199, 883
- (11)
- (12) Blustin, A., Page, M., Fuerst, S., Branduardi-Raymont, G., Ashton, C., 2005, A&A, 431, 111
- (13)
- (14) Cackett, E., Miller J. M., Bhattacharyya, S., Grindlay, J. E., Homan, J., van der Klis, M., Miller, M. C., Strohmayer, T. E., Wijnands, R., 2008, ApJ, 674, 415
- (15)
- (16) Cackett, E., Miller, J. M., Ballantyne, D. R., Barret, D., Bhattacharyya, S., Boutelier, M., Miller, M. C., Strohmayer, T. E., Wijnands, R., 2010, ApJ, 720, 205
- (17)
- (18) Churazov, E., Gilfanov, M., Forman, W., Jones, C., 1996, ApJ, 471, 673
- (19)
- (20) D’Ai, A., Iaria, R., Di Salvo, T., Matt, G., Robba, N., 2009, ApJ, 693, L1
- (21)
- (22) Di Salvo, T., D’Ai, A., Iaria, R., Burderi, L., Dovciak, M., Karas, V., Matt, G., Papitto, A., Piraino, S., Riggio, A., Robba, N., Santangelo, A., 2009, MNRAS, 398, 2022
- (23)
- (24) Fabian, A. C., Rees, M. J., Stella, L., White, N. E., 1989, MNRAS, 238, 729
- (25)
- (26) Hasinger, G., & van der Klis, M., 1989, A&A, 225, 79
- (27)
- (28) Jonker, P., van der Klis, M., Wijnands, R., Homan, J., van Paradijs, J., Mendez, M., Ford, E., Kuulkers, E., Lamb, F., 2000, ApJ, 537, 374
- (29)
- (30) Kallman, T. R., & Bautista, M. A., 2001, ApJS, 133, 221
- (31)
- (32) King, A., & Lasota, J.-P., 2016, MNRAS, arxiv:1601.03738
- (33)
- (34) King, A. L., Miller, J. M., Raymond, J., Fabian, A. C., Reynolds, C. S., Kallman, T. R., Maitra, D., Cackett, E. M., Rupen, M. P., 2012, ApJ, 746, L20
- (35)
- (36) King, A. L., Miller, J. M., Raymond, J., Reynolds, M. T., Morningstar, W., 2015, ApJ, 813, L37
- (37)
- (38) Lavagetto, G., Iaria, R., Di Salvo, T., Burderi, L., Robba, N., Frontera, F., Stella, L., 2004, NuPhS, 132, 616
- (39)
- (40) Miller, J. M., Raymond, J., Fabian, A., Steeghs, D., Homan, J., Reynolds, C., van der Klis, M., Wijnands, R., 2006, Nature, 441, 953
- (41)
- (42) Miller, J. M., Raymond, J., Homan, J., Fabian, A. C., Steeghs, D., Wijnands, R., Rupen, M., Charles, P., van der Klis, M., Lewin, W. H. G., 2006b, ApJ, 646, 394
- (43)
- (44) Miller, J. M., Raymond, J., Reynolds, C. S., Fabian, A. C., Kallman, T. R., Homan, J., 2008, ApJ, 680, 1359
- (45)
- (46) Miller, J. M., Maitra, D., Cackett, E., Bhattacharyya, S., Strohmayer, T., 2011, ApJ, 731, L7
- (47)
- (48) Miller, J. M., et al., 2013, ApJ, 779, L2
- (49)
- (50) Miller, J. M., Fabian, A. C., Kaastra, J. S., Kallman, T., King, A. L., Proga, D., Raymond, J., Reynolds, C. S., 2015, ApJ, 814, 87
- (51)
- (52) Mitsuda, K., Inoue, H., Koyama, K., Makishima, K., Matsuoka, M., Ogawara, Y., Suzuki, K., Tanaka, Y., Shibazaki, N., Hirano, T., 1984, PASJ, 37, 741
- (53)
- (54) Papitto, A., Di Salovo, T., D’Ai, A., Iaria, R., Burderi, L., Riggio, A., Menna, M., Robba, N., 2009, A&A, 493, L39
- (55)
- (56) Penninx, W., Zwarthoed, G. A. A., van Paradijs, J., van der Klis, M., Lewin, W. H. G., Dotani, T., 1993, A&A, 267, 92
- (57)
- (58) Pinto, C., Costantini, E., Fabian, A. C., Kaastra, J., in’t Zand, J., 2014, A&A, 563, 115
- (59)
- (60) Ponti, G., Fender, R. P., Begelman, M. C., Dunn, R., Neilsen, J., Coriat, M., 2012, MNRAS, 442, L11
- (61)
- (62) Proga, D., 2003, ApJ, 585, 406
- (63)
- (64) Tombesi, F., Cappi, M., Reeves, J., Palumbo, G., Yaqoob, T., Braito, V., Dadina, M., 2010, A&A, 521, 57
- (65)
- (66) Ueda, Y., Murakami, H., Yamaoka, K., Dotani, T., Ebisawa, K., 2004, ApJ, 609, 325
- (67)
- (68) Verner, D. A., Verner, E. M., Ferland, G. J., 1996, ADNDT, 64, 1
- (69)
- (70) Wijnands, R., & van der Klis, M., 1999, ApJ, 514, 939
- (71)
- (72) Wilms, J., Allen, A., McCray, R., 2000, ApJ, 542, 914
- (73)
| Parameter | Zone 1 | Zone 2 | Zone 3 | Continuum |
| – | ||||
| log() | – | |||
| – | ||||
| – | – | – | ||
| kT (keV) | – | – | – | 0.86(1) |
| diskbb norm. | – | – | – | |
| (keV) | – | – | – | |
| – | – | – | ||
| – | – | – | – | |
| – | – | – | 35(1) | |
| – | – | – | – |