11email: ute@ugr.es 22institutetext: Observatoire de Bordeaux, UMR 5804, CNRS/INSU, B.P. 89, F-33270 Floirac, France 33institutetext: Laboratoire AIM, CEA/DSM - CNRS - Université Paris Diderot, DAPNIA/Service d Astrophysique, CEA-Saclay, F-91191 Gif-sur-Yvette Cedex, France 44institutetext: Institute of Astronomy, University of Cambridge, Madingley Road, Cambridge, CB3 0HA, UK 55institutetext: Unidad de Astronomía, Fac. Cs. Básicas, Universidad de Antofagasta, Avda. U. de Antofagasta 02800, Antofagasta, Chile 66institutetext: Centre for Astrophysics Research, University of Hertfordshire, Hatfield AL10 9AB, UK 77institutetext: Astronomy Department, Case Western Reserve University, 10900 Euclid Avenue, Cleveland, OH 44106 88institutetext: Institute for Astronomy, Astrophysics, Space Applications and Remote Sensing, National Observatory of Athens, GR-15236, Penteli, Greece 99institutetext: University of Crete, Department of Physics, Heraklion GR-71003, Greece
Molecular gas and star formation in the Tidal Dwarf Galaxy VCC~2062
The physical mechanisms driving star formation (SF) in galaxies are still not fully understood. Tidal dwarf galaxies (TDGs), made of gas ejected during galaxy interactions, seem to be devoid of dark matter and have a near-solar metallicity. The latter makes it possible to study molecular gas and its link to SF using standard tracers (CO, dust) in a peculiar environment. We present a detailed study of a nearby TDG in the Virgo Cluster, VCC 2062, using new high-resolution CO(1–0)††thanks: The reduced data cubes are available at the CDS via anonymous ftp to cdsarc.u-strasbg.fr (130.79.128.5) or via http://cdsweb.u-strasbg.fr/cgi-bin/qcat?J/A+A/ data from the Plateau de Bure, deep optical imaging from the Next Generation Virgo Cluster Survey (NGVS), and complementary multiwavelength data. Until now, there was some doubt whether VCC 2062 was a true TDG, but the new deep optical images from the NGVS reveal a stellar bridge between VCC 2062 and its parent galaxy, NGC 4694, which is clear proof of its tidal origin. Several high-resolution tracers (H, UV, 8 m, and 24 m) of the star formation rate (SFR) are compared to the molecular gas distribution as traced by the CO(1–0). Coupled with the SFR tracers, the NGVS data are used with the CIGALE code to model the stellar populations throughout VCC 2062, yielding a declining SFR in the recent past, consistent with the low H/UV ratio, and a high burst strength. HI emission covers VCC 2062, whereas the CO is concentrated near the HI maxima. The CO peaks correspond to two very distinct regions: one with moderate SF to the NE and one with only slightly weaker CO emission but with nearly no SF. Even where SF is clearly present, the SFR is below the value expected from the surface density of the molecular and the total gas as compared to spiral galaxies and other TDGs. After discussing different possible explanations, we conclude that the low surface brightness is a crucial parameter to understand the low SFR.
Key Words.:
Galaxies: interactions – Galaxies: ISM –Galaxies: star formation – Galaxies: dwarf – ISM: molecules1 Introduction
Tidal dwarf galaxies (TDGs) are self-gravitating entities formed from the tidal debris of interacting galaxies (see Duc 2012, and references therein). Their stellar and star formation (SF) properties are similar to those of dwarf irregulars or blue compact dwarfs, with the noticeable exception that their metallicity is higher (about 1/3 solar to 1/2 solar) because they are recycled objects, inheriting the metallicity of the outer regions of their parent galaxies. Another relevant difference compared to non-tidal dwarfs (called “classical” dwarf galaxies in the following) is their expected lack of non-baryonic dark matter (DM) if the standard Lambda cold dark matter (CDM) cosmological scenario is correct and DM is distributed in a large, pressure-supported halo. Since a typical tidal interaction between two galaxies mostly expels material from the disk, it is predicted that only a fraction of DM resides in TDGs. This characteristic is the strongest difference between TDGs and classical dwarfs, but it is difficult to test because the dynamical and the visible masses both need to be measured (see Duc 2012, for a review). A rough estimate of the dynamical mass from the CO(1-0) linewidth gave a low dark-to-visible mass ratio of the order 1 in 8 TDGs (Braine et al. 2001), considerably lower than the value typically found in classical dwarfs (baryon fraction of 30%, e.g. Lelli et al. 2014). In order to better determine the dynamical mass, high-quality, high-resolution spectral data are necessary to spatially resolve the gas kinematics. This has been done, so far, in three systems based on high-resolution HI data: NGC~5291, containing three TDGs (Bournaud et al. 2007, revised in Lelli et al. 2015); NGC~7252 containing two objects (Lelli et al. 2015); and VCC 2062 (Lelli et al. 2015). In all six TDGs, assuming dynamical equilibrium, the dark-to-visible mass ratio is consistent with 1 giving strong support to the tidal origin of the objects.
A major challenge in astrophysics is understanding the process of SF in galaxies and in particular how the star formation rate (SFR) is quantitatively related to the neutral gas (the SF law). A useful parameter for this kind of study is the star formation efficiency (SFE), which we define in this paper as the SFR per molecular gas mass, SFE = SFR/111 Whenever we refer to the SFE with respect to a different gas phase, we state this explicitly, for example SFE(gas) = SFR/, the SFE per total neutral gas. , the inverse of the molecular gas consumption time, . This parameter is relatively constant in nearby spiral galaxies with a median value of log(SFE) = -9.23 (Bigiel et al. 2011), suggesting that in these objects the SFR is simply determined by the amount of available molecular gas. Starburst galaxies, however, form their stars more efficiently with a SFE of about a factor of four to 10 higher (Genzel et al. 2010; Daddi et al. 2010). The SFE at the dim end of the luminosity range is much more difficult to measure because molecular gas is hard to detect and quantify. In dwarf galaxies, the low metallicity makes CO a poor tracer of the molecular gas (see Bolatto et al. 2013, for a review). This is partly due to a low molecular gas fraction, and partly due to a low metallicity since the CO-to-H2 conversion factor, , depends very sensitively on this latter parameter and also on the radiation field, making a quantitative measurement of the molecular gas mass difficult even if CO is detected. Only in nearby galaxies with high sensitivity and high-resolution CO data, allowing the study of individual Giant Molecular Clouds (GMCs), and with supplementary infrared (IR) dust emission data, an estimate of the molecular gas mass is possible without the need to know the CO-to-H2 conversion factor. In this way, in M33 (metallicity 0.5 solar) and NGC 6822 (metallcity 0.3 solar) increases of the SFE of a factor 2-4 (M33, Gratier et al. 2010b), and 5-10 (NGC 6822, Gratier et al. 2010a) have been found. A possible reason for this high SFE might be stronger stellar winds at low metallicities which clear out more efficiently the surroundings of newly formed stars from molecular gas (Dib et al. 2011). The lowest metallicity galaxies with CO detections are WLM and the SMC (10-15% of solar metallicity). In the two molecular clouds detected in WLM, the SFE, at a scale of 100 pc is very similar to spiral galaxies, but a factor of 10 lower than in the Orion Nebula (Elmegreen et al. 2013).
TDGs possess several differences compared to other galaxies and in particular classical dwarfs which make the study of their SF law highly interesting. First of all, due to the close-to-solar metallicity of TDGs the CO emission is a good tracer of the molecular gas and allows a reliable measure of the molecular gas mass. Thus, TDGs allow us to directly study the SF law based on the molecular gas which is difficult in other dwarf galaxies. The preliminary analysis of a small sample of TDGs with CO data and measurements of their SFR showed that these objects seem to follow the same relation as spiral galaxies (Lisenfeld et al. 2002b), with the exception of VCC 2062, which showed a low SFE. In order to study this low SFE in more detail, high angular resolution interferometric data are needed (Lisenfeld et al. 2009).
A second difference is the low DM content. Even though DM does not have a direct relation to SF, there are secondary effects, for example on the rotation curve, which has consequences for dynamically driven SF thresholds (e.g. Toomre 1964; Hunter et al. 1998) or SF laws that are based on the orbital timescales (Kennicutt 1998). Ploeckinger et al. (2014, 2015) simulated the evolution of SF and chemistry in TDGs and concluded that TDGs can survive starburst episodes without being disrupted in spite of their low DM content. In their models, even after an initial starburst, the SF becomes self-regulated and continuous after a dynamical time. Finally, in TDGs the environmental conditions are different among other things because of the presence of tidal forces. The simulations of Ploeckinger et al. (2015) predict that compressive tidal forces can enhance the SF in TDGs compared to classical dwarfs. Thus, given all these peculiarities, TDGs are unique objects to investigate the universality of the SF law in a different environment than that of spirals or classical dwarf galaxies.
VCC~2062 is a dwarf galaxy of extremely low surface brightness (central = 25.5 mag/″) in the outskirts of the Virgo Cluster. It is situated close to the perturbed, early-type galaxy NGC 4694 and is linked to it by a broad, long HI plume (see Fig. 1). It has been studied in detail by Duc et al. (2007) with the conclusion that VCC 2062 is most likely an old TDG and NGC~4694 a merger remnant. There are two main observational arguments that support this suggestion. Firstly, the oxygen abundance (12+log(O/H) = 8.6, Duc et al. 2007) is about a factor of 10 above the value expected from its blue magnitude ( mag) and makes VCC 2062 a clear outlier from the established magnitude-metallicity relation followed by classical dwarf galaxies (e.g. Lee et al. 2003). This discards the hypothesis that VCC 2062 is a preexisting dwarf galaxy and can be well explained by the fact that VCC 2062 is made of recycled gas from larger galaxies. The second evidence is the low dynamical mass and dark-to-visible mass ratio which can be derived from the atomic gas kinematics. Detailed modelling of the HI distribution and kinematics and a comparison to the stellar and gaseous mass by Lelli et al. (2015) yielded a dynamical-to-barionic mass ratio of , i.e. a value compatible with the absence of dark matter. The low dynamical mass discards the hypothesis that VCC 2062 is the remnant of a pre-existing Low Surface Brightness (LSB) galaxy, tidally disrupted by NGC 4694. Whereas gas and stellar material could have been lost in such a disruption, a considerable decrease of the non-barionic dynamical mass is much more difficult to envisage.
VCC 2062 is one of the closest known gas-rich TDG and an ideal object for a detailed study of the relation between molecular gas and SF in an extreme environment. In this paper we present interferometric, high-resolution CO(1-0) data (″, corresponding to a linear size of 330 pc at the distance of 17 Mpc) which we use to study the distribution and the kinematics of the molecular gas. The main goal is to study the SF law based on a comparison of the distribution of the molecular gas to the SFR measured with different tracers. Our rich multiwavelength data-set furthermore allows us to model the optical-to-infrared Spectral Energy Distribution (SED) to derive the present and past SFR and the stellar mass.
2 The data
This paper makes use of a wide set of data, partly form our own observations (CO(1-0)) and partly from the literature. The properties of the different data sets are summarized in Table 1.
| Telescope | Instrument/ | FWHM | a𝑎aa𝑎aThe calibration uncertainties are from Morrissey et al. (2007) (GALEX), Raichoor et al. (2011) (NGVS), Fazio et al. (2004) (IRAC) and Rieke et al. (2004); Engelbracht et al. (2007); Verley et al. (2009) (MIPS). We do not include calibration errors in the CO and HI data. | |
| Filter | [′′] | [%] | ||
| GALEX | FUX | 0.154 m | 4.2 | 4.7 |
| GALEX | NUV | 0.232 m | 5.3 | 2.8 |
| NGVS | 0.381 m | 1 | 4.7 | |
| NGVS | 0.487 m | 1 | 4.7 | |
| NGVS | 0.769 m | 0.6 | 4.7 | |
| NGVS | 0.887 m | 1 | 9.6 | |
| Spitzer | IRAC | 3.5 m | 1.6 | 10 |
| Spitzer | IRAC | 4.5 m | 1.7 | 10 |
| Spitzer | IRAC | 5.8 m | 1.9 | 10 |
| Spitzer | IRAC | 8.0 m | 2.0 | 10 |
| Spitzer | MIPS | 24 m | 6 | 10 |
| PdBI | 12CO(1-0) | 114.8 GHz | 4.3 4.1 b𝑏bb𝑏bBeam FWHM of the taper90 datacuabe. | - |
| VLA | HI | 1.45 GHz | 14.7 14.3 | - |
2.1 CO(1-0) from Plateau de Bure
The observations were carried out between November 2010 and June 2011 in C and D configuration with the Plateau de Bure Interferometer (PdBI) of the Institute de Radioastronomie Millimetrique (IRAM)333 IRAM is supported by INSU/CNRS (France), MPG (Germany) and IGN (Spain). . We observed two overlapping positions with a central position of RA 12:48:00.2, DEC 10:58:10 and offsets of (5″, 6″) and (-14″, 7″). We observed the CO(1-0) line at a central sky-frequency of 114.842 GHz corresponding to a recession velocity of 1120 km s-1. The November data suffered from cable phase inversion on antennas 5 and 6. The data were corrected a posteri for this problem. The observations were carried out under good weather conditions. 3C 273 was used as a phase and flux calibrator. We used the correlator in two settings, one providing a velocity resolution of 0.82 km s-1 and a bandwidth of 203 km s-1, and the other at a velocity resolution of 6.2 km s-1 and a bandwidth of 2130 km s-1. The data with the lower resolution and larger bandwidth were used to search for emission at high velocity offsets and as an attempt to detect the continuum emission. We did not find emission outside the velocity range explored with high-resolution data and neither did we detect any continuum emission. In the following we focus our analysis on the high-velocity resolution data.
We reduced the data following standard procedures using the GILDAS444 http://www.iram.fr/IRAMFR/GILDAS software. Since the emission in our maps was rather weak, we used natural weighting to maximize the sensitivity. The untapered map achieved an angular resolution of 32 24 but showed only weak emission. We therefore applied different tapers to the data producing maps at different angular resolutions (43 41 for a taper to 90m and 77 63 for a taper to 50m). We will call these datacubes taper50 and taper90 in the following. We used the Högbom cleaning procedure, and tried also the Clark procedure which gave no important differences. In the cleaning process we identified and marked in each channel the areas containing emission. We used a loop gain of 0.1 (we also tried a loop gain of 0.2 without noticing important differences). We cleaned down to 1.5% of the peak emission (which corresponds to about 0.5). We used the recommended truncation threshold of 0.2 of the primary beam sensitivity. We binned 2 channels of the high-velocity resolution data yielding a velocity resolution of 1.6 km s-1.
2.2 Multiwavelength data from Duc et al. (2007)
We made use of the large collection of data presented in Duc et al. (2007), in particular single-dish CO(1-0) and CO(2-1) data from the IRAM 30m telescope, HI data, UV data in the FUV ( = 151 nm) and NUV ( = 227 nm) band from GALEX and an H map. A detailed description of these observations and their data reduction are presented in Duc et al. (2007). Here we only summarise the most relevant aspects.
The HI data were retrieved from the VLA archive. They had originally been obtained as part of the VIVA project (project ID: AK563), a systematic survey of HI rich objects in VIRGO (Chung et al. 2009). The final, robustly weighted HI data cube that we use here has a beam of 147 143 and an rms noise of 0.6 mJy beam-1, corresponding to a detection threshold (assuming a 3 detection across 3 channels) of cm-2. The velocity resolution is 7.3 km s-1.
The CO spectra were observed with the IRAM 30m telescope. A map with a spacing between pointings of 7″ was obtained, covering roughly the extent of the HI cloud (see Fig. 2 of Duc et al. 2007). The velocity resolution is 2.6 km s-1 for the CO(1-0) spectra and 1.3 km s-1 for CO(2-1).
2.3 Spitzer data
We downloaded data obtained with the Spitzer telescope (Werner et al. 2004) from the Spitzer Heritage Archive. The field containing VCC 2062 was observed with the Infrared Array Camera (IRAC, Fazio et al. 2004) and with the Multiband Imaging Photometer (MIPS, Rieke et al. 2004). The images were processed with the Spitzer Super-Mosaic Pipeline and no further reduction was carried out. VCC 2062 was detected in all IRAC bands and in the 24 m MIPS band. It was not detected by MIPS at 70 m nor 160 m.
2.4 Deep optical data
The deep optical images used in this paper were obtained at the Canada-France-Hawaii Telescope as part of the Next Generation Virgo Cluster Survey (NGVS, Ferrarese et al. 2012). NGVS used an observing strategy and data reduction pipeline (ELIXIR-LSB, Cuillandre et al., in prep.; Duc et al. 2015) optimized for the detection of extended LSB objects. Images were obtained in the , , , and -bands. Thanks to the low limiting surface brightness achieved – about 29 mag arcsec-2 in the -band –, a wealth of so far unknown faint stellar structures could be detected around NGC 4694 and give new insight in the history of this galaxy and its relation to VCC 2062.
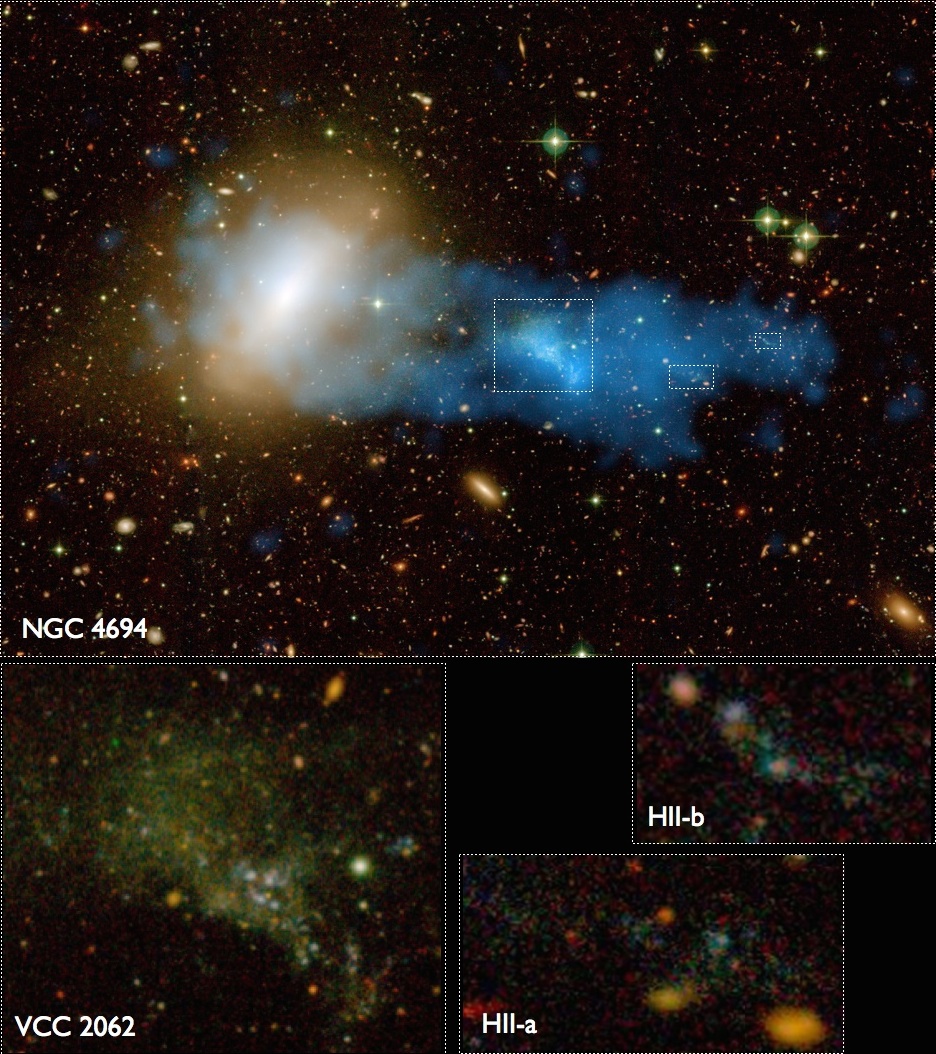
Fig. 1 shows a combined three-colour image of both objects in which the SF regions in VCC 2062 are clearly visible. Both galaxies are connected by a long and broad HI plume which extends to about twice the distance between them. Interestingly, towards the end of this HI plume, two further, much smaller, SF regions can be seen.
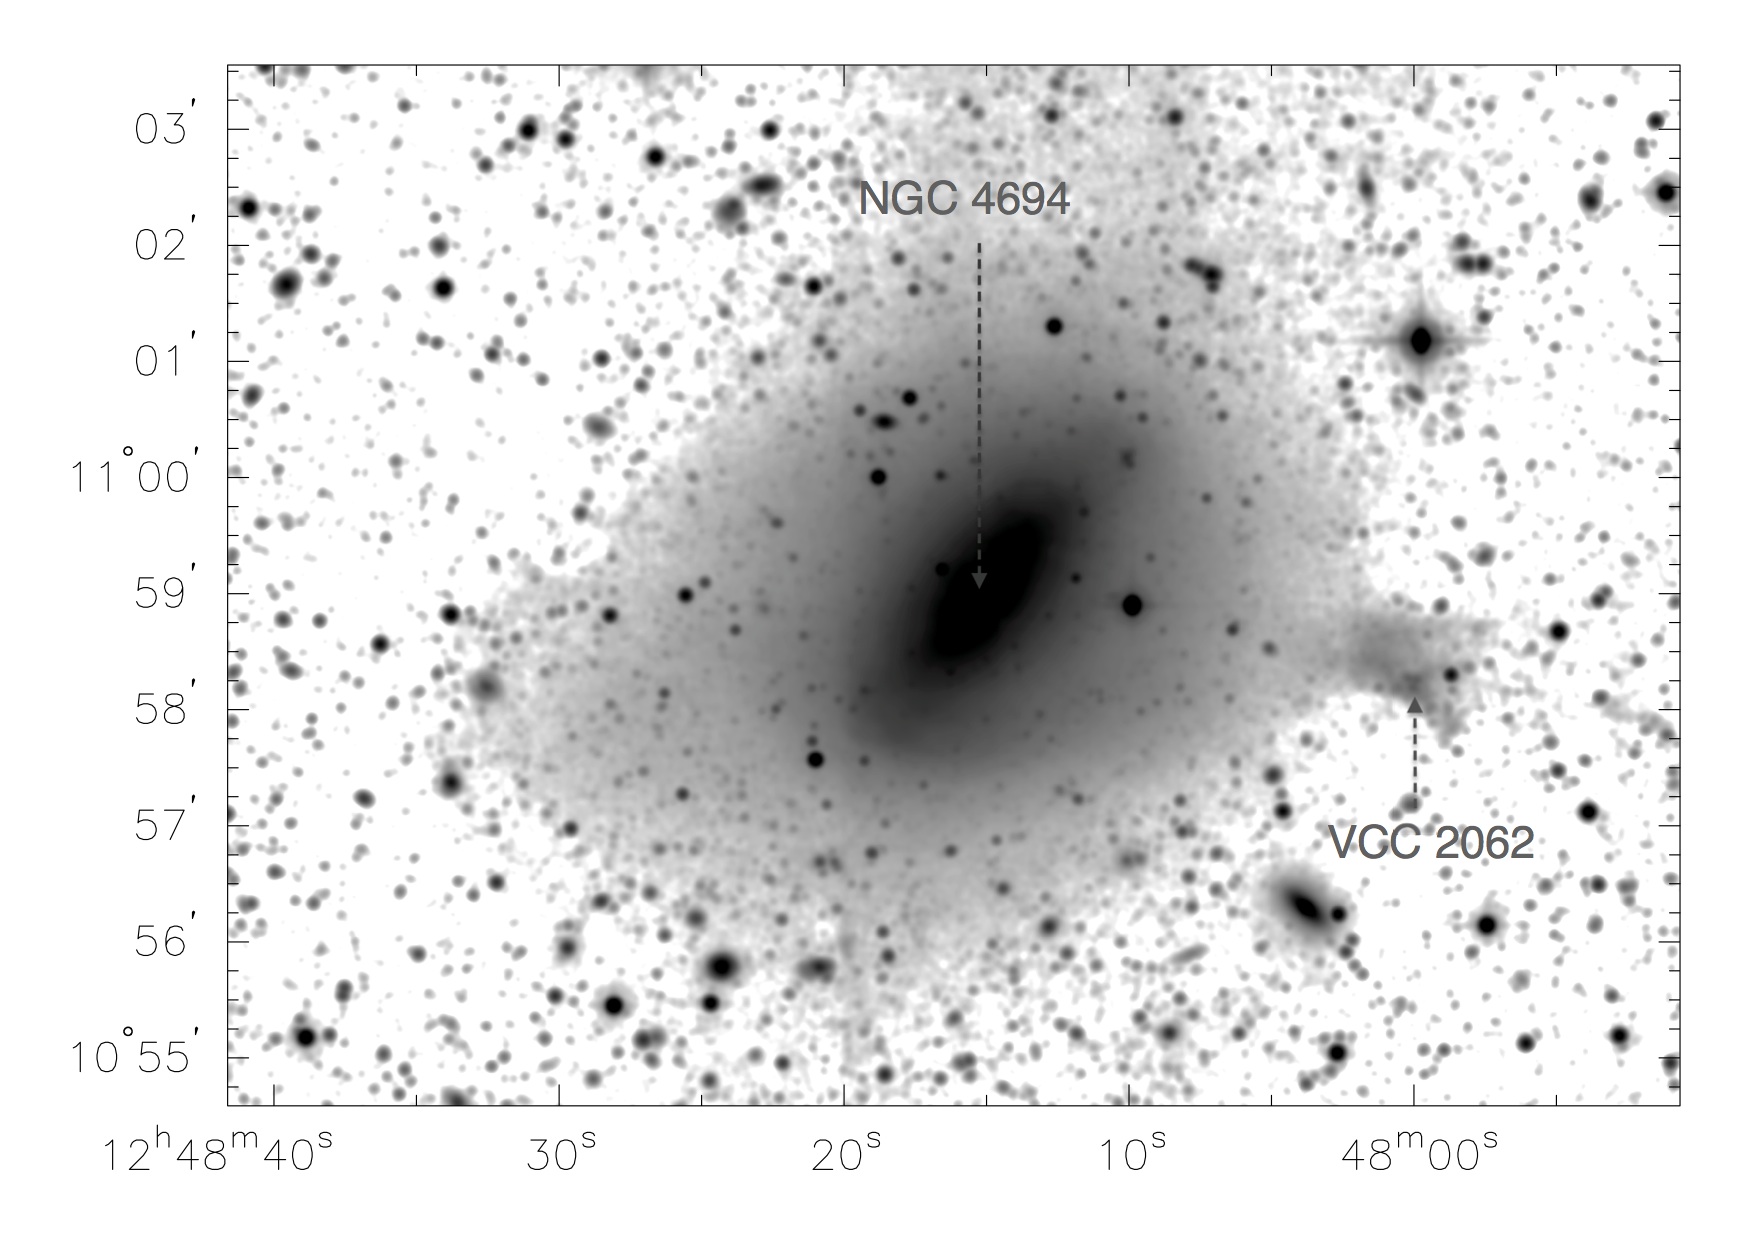
Fig. 2 shows an image in the -band, in which the low brightness structures are highlighted. The distorted and asymmetric appearance of NGC 4694 can be seen. Very noticeable is the broad stellar bridge from this galaxy to VCC 2062.
3 Properties of the molecular gas
3.1 Distribution and mass of the molecular gas
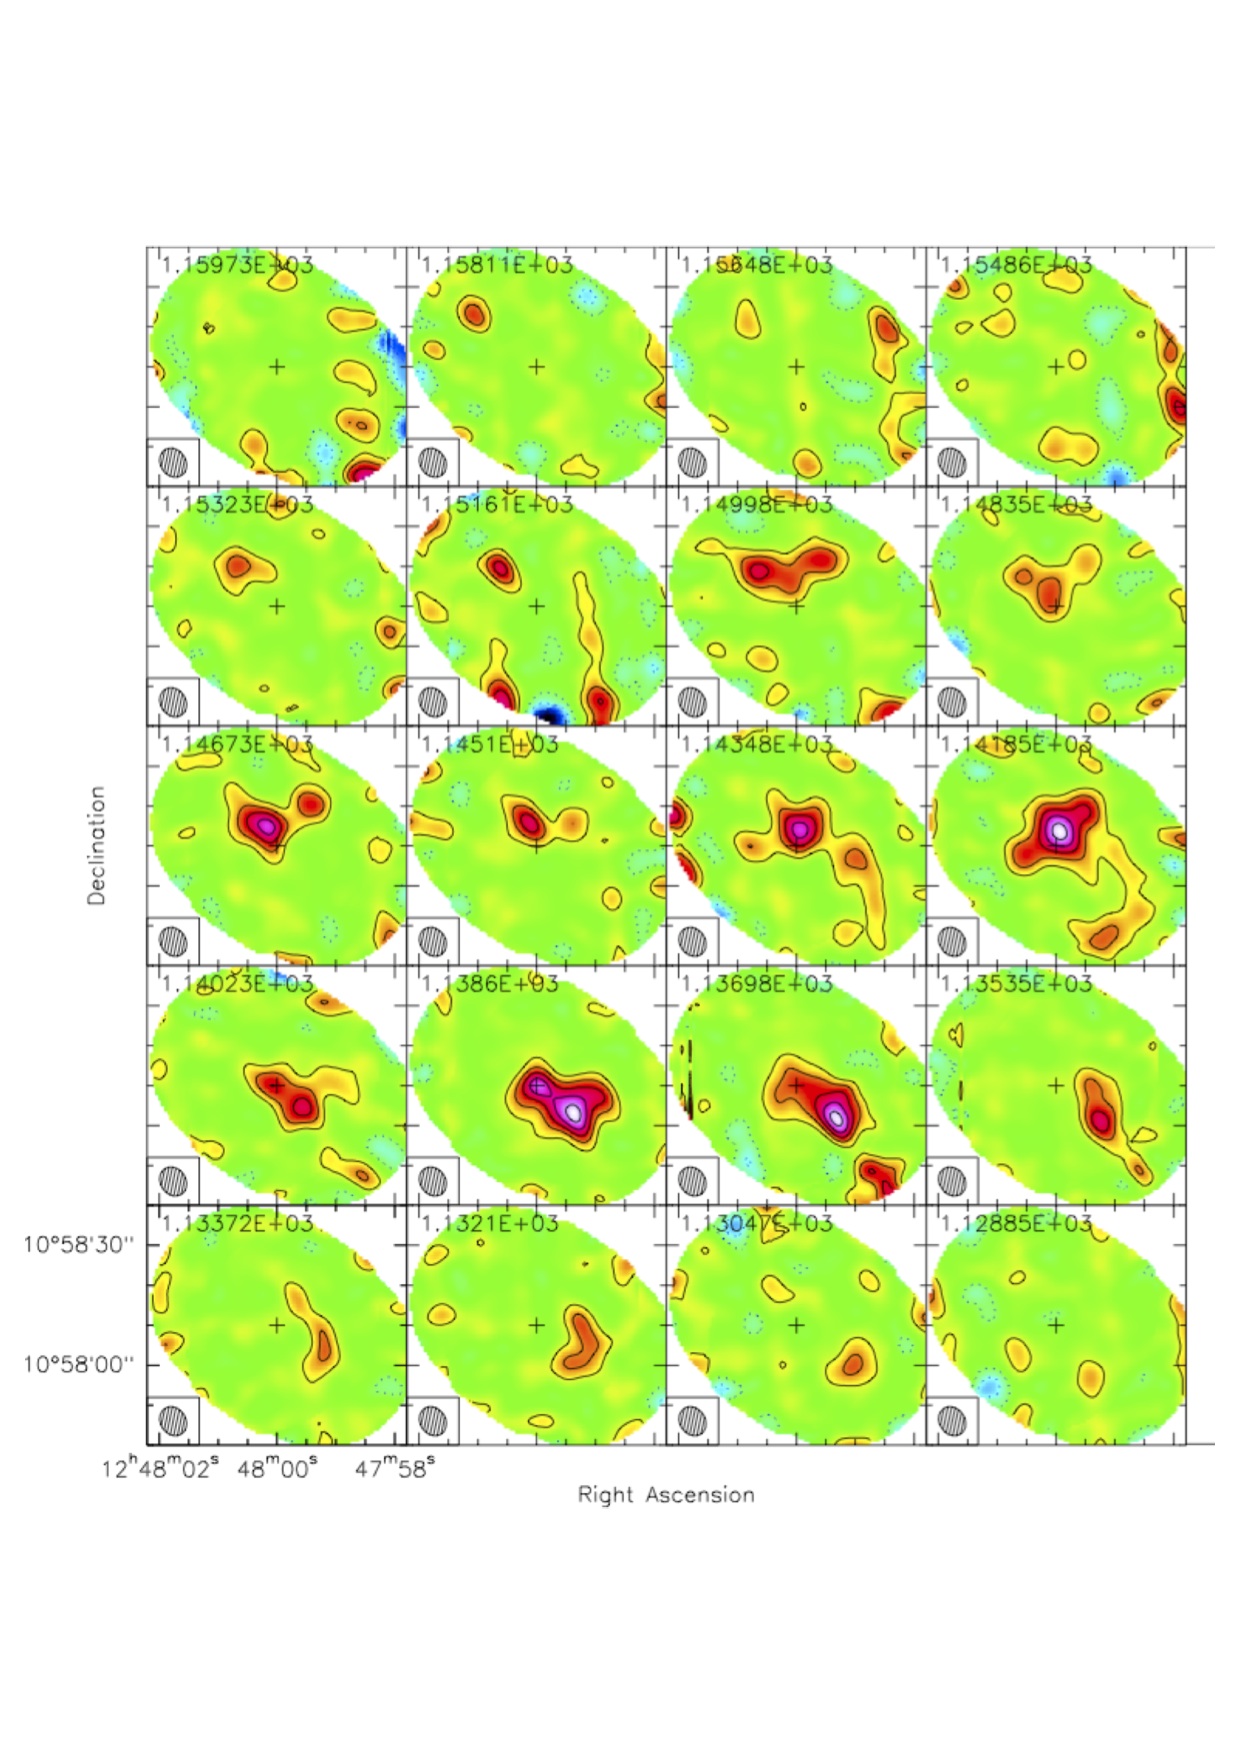
Appendix A presents the channel maps of the taper50 data cube showing that emission is visible in the velocity range between 1129 and 1159 km s-1, distributed in various clouds and showing a velocity gradient along the NE-SW direction. In Fig. 3 we display the velocity integrated CO map. In the upper panel, two clearly separated regions of emission are visible which we call the NE and the SW clouds. In the very South, close to the edge of our imaged area, there is a further region (labelled “Southern cloud”). We tested the significance of this emission by creating a larger map going out to 10% of the primary beam sensitivity and inspecting visually the spectra in this region. We concluded that the emission is real, but at the limit of significance. We will therefore not include this emission in our quantitative analysis. The higher-resolution image (lower panel), shows that the NE, and even more the SW, cloud consist of various smaller clouds.
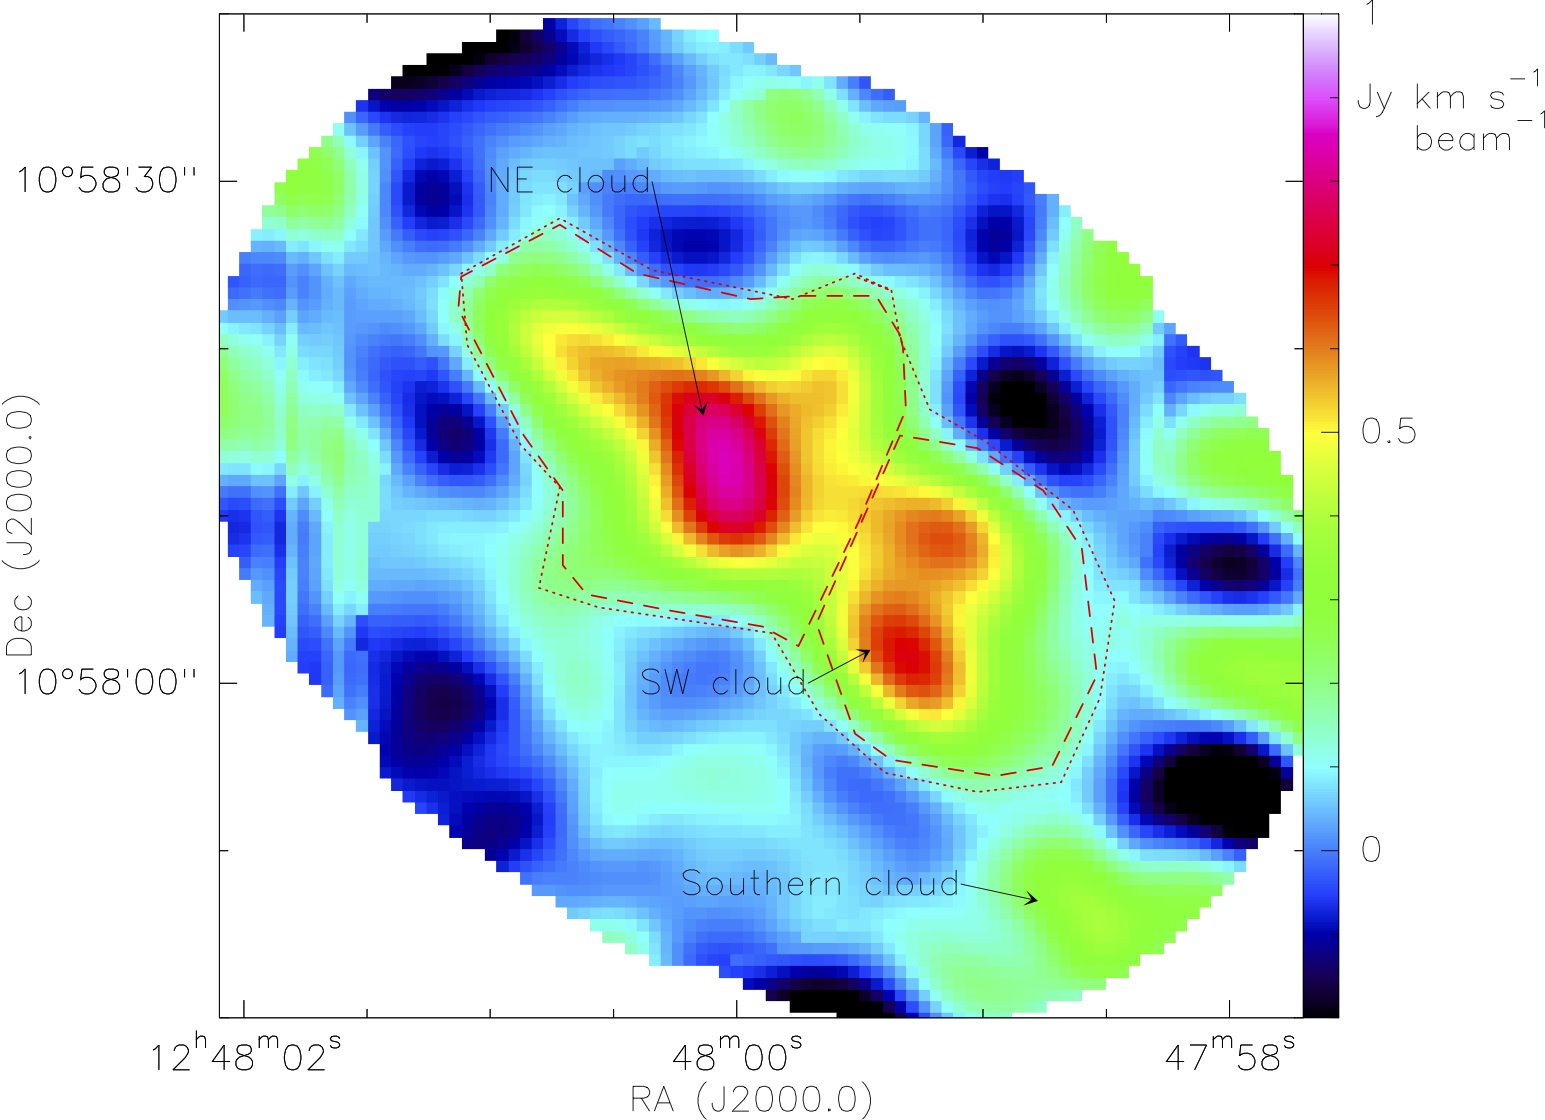
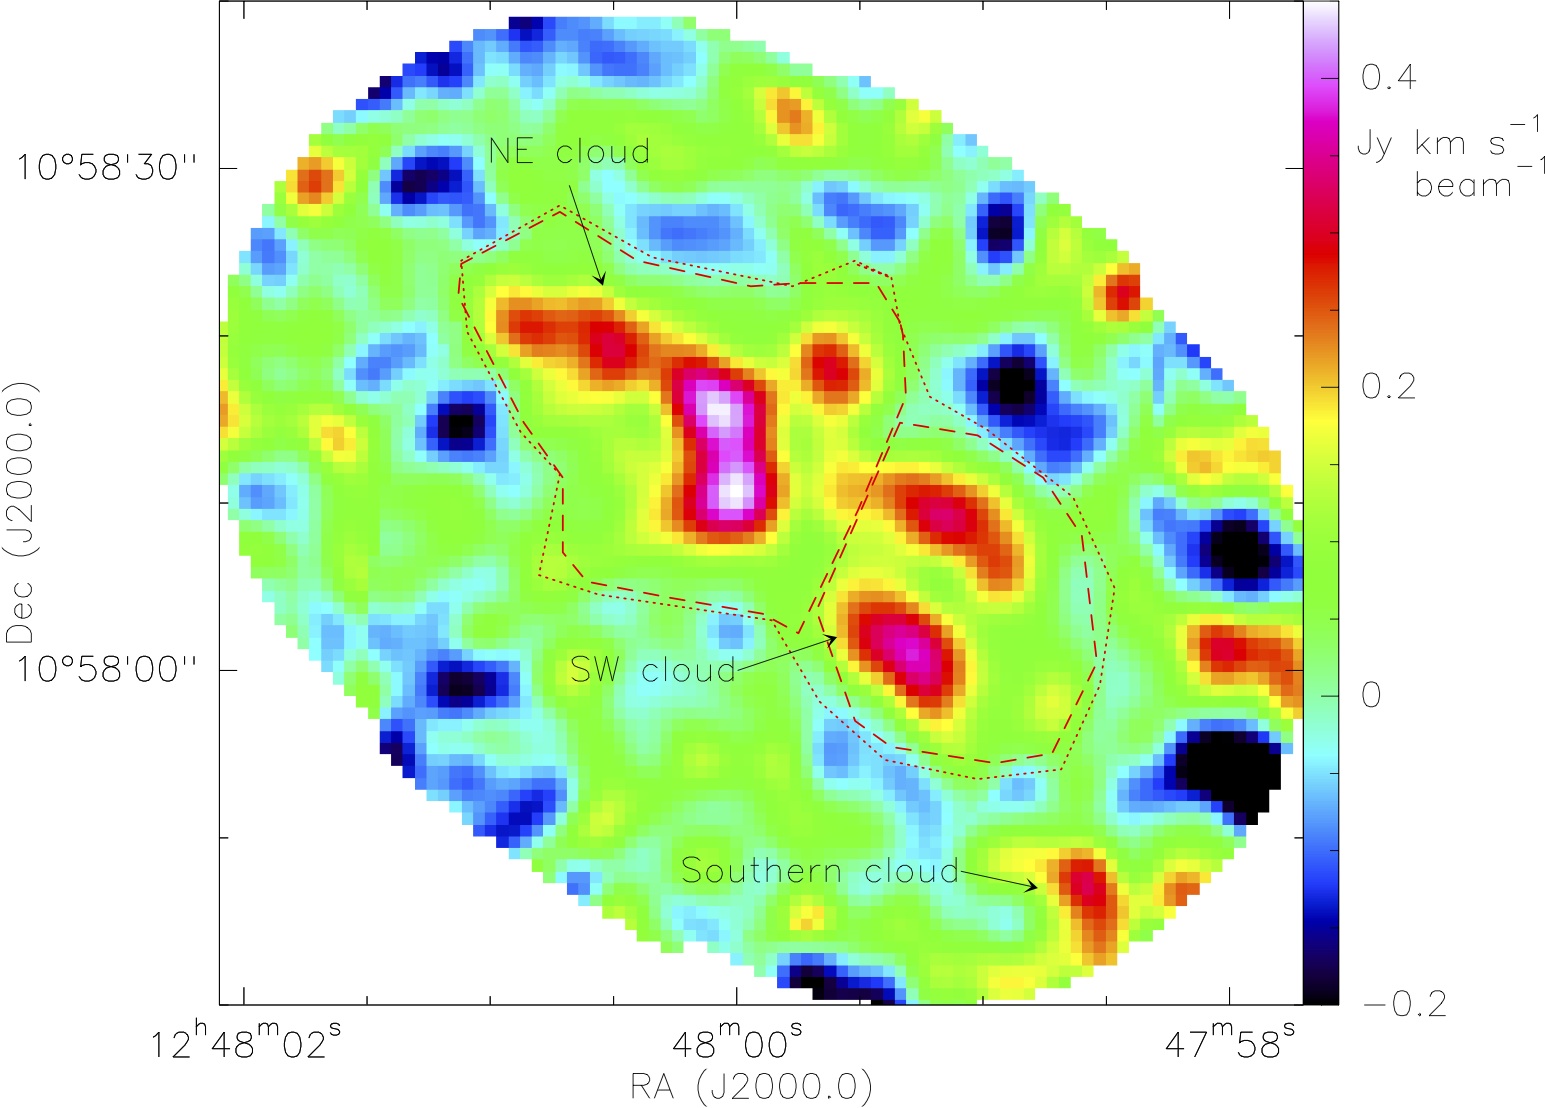
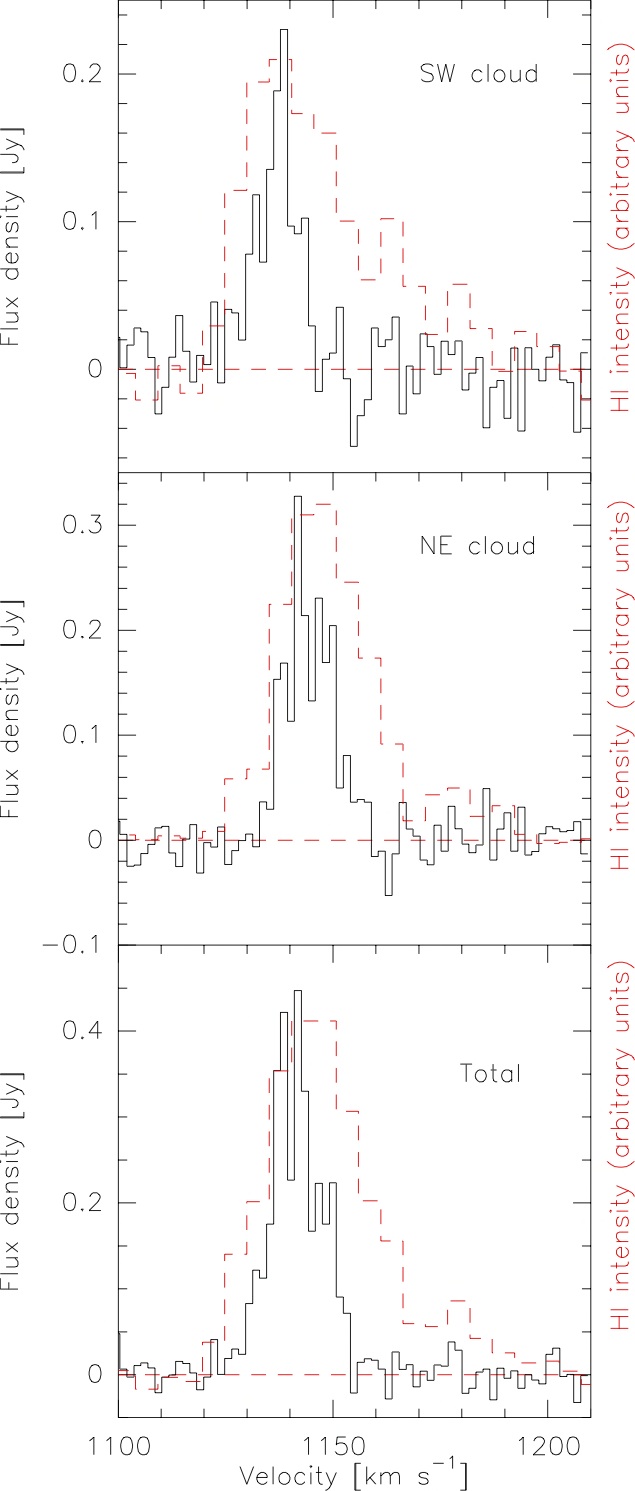
Based on this distribution of the CO, we defined different regions in the galaxy, corresponding to the NE and SW cloud and the total emission (see Fig. 3). For each region, we determined the integrated spectrum which is shown in Fig. 4. The line widths in the two regions are 20 km s-1(SW) and 25 km s-1 (NE). We then determined the velocity integrated flux of the spectra by integrating over channels with emission. The error was calculated as where is the width of a channel (1.6 km s-1), is the velocity range over which the integration was carried out and is the rms noise level, determined in the part of the spectrum where no emission was detected. The values are measured from the taper90 map, but the agreement with the taper50 map is within 10%. The results are listed in Table 2. We can compare the value to the total flux obtained over the same area with the IRAM 30 m telescope of 7.5 Jy km s-1(Duc et al. 2007), with an estimated error of about 20%. Thus, the interferometric observations yield about (7015)% of the flux from single-dish observations, showing that at most a small fraction of smoothly distributed, diffuse CO may be resolved out.
We calculated the mass of the molecular gas from the PdBI CO fluxes as
| (1) |
where is the distance in Mpc and is the CO(1-0) flux in Jy km s-1(see Bolatto et al. 2013). This expression is based on a conversion factor of = cm(K km s-1) and includes a mass fraction of helium of 1.36. The molecular gas masses are listed in Table 2, together with the molecular mass surface densities, which were calculated by dividing the mass by the area over which the CO flux was integrated.
| Region | Area | SCO | b𝑏bb𝑏bFor consistency with the molecular gas, we include in the atomic gas mass a helium fraction of 1.36. | / | |||
|---|---|---|---|---|---|---|---|
| [kpc2] | [Jy km s-1] | [106 M⊙] | [M⊙pc-2] | [106 M⊙] | [M⊙pc-2] | ||
| NE | 2.9 | 3.40.2 | 10.3 0.6 | 3.60.2 | 26 3 | 8.90.9 | 0.280.03 |
| SW | 1.7 | 2.00.2 | 6.10.6 | 3.50.4 | 131 | 7.90.8 | 0.320.05 |
| totala𝑎aa𝑎a”Total” refers to the CO-emitting area for both the molecular and the atomic gas mass, not to the total HI area of the TDG (see Fig. 5). | 5.2 | 5.40.2 | 16.40.6 | 3.20.1 | 465 | 8.90.9 | 0.260.03 |
3.2 Comparison of CO and HI emission
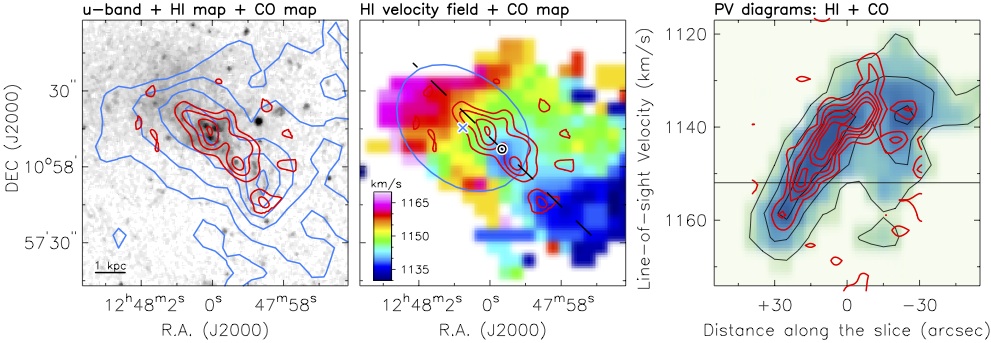
Figure 5 compares the distribution and kinematics of CO and HI emission. The left panel shows an –band image overlaid with both the total CO map at 7′′ resolution (red) and the HI map at 14′′ resolution (blue). The CO cloud to the NE coincides with a strong HI peak (8 M⊙ pc-2) and several stellar clusters. The CO cloud to the SW, instead, lies between two HI peaks; faint star clusters are present in this region. The molecular gas fraction is around 30% everywhere (see Table 2) which is in the range of what Casoli et al. (1998) found for spiral galaxies of type Sa-Sc, and much higher than their result for Sd spirals and irregulars (less than 5%).
The middle panel shows the HI velocity field (from Lelli et al. 2015) overlaid with the total CO map. Lelli et al. (2015) analysed high-resolution HI data of VCC 2062 and found that the HI emission can be described by a rotating disc model. The blue cross and ellipse in Fig. 5 illustrate, respectively, the centre and extension of the HI disc as derived by Lelli et al. (2015). Clearly, the CO emission is displaced to the SW of the kinematic centre, lying on the approaching, blue-shifted side of the HI disc. The NE half of the HI disk contains only older stars.
The right panel compares Position-Velocity (PV) diagrams derived from the HI and CO cubes (red and black contours, respectively). There is excellent agreement between HI and CO kinematics. The HI gas has a broader line width than the CO gas (see also Fig. 4 for a direct comparison of the CO and HI spectra), which is most likely due to the lower velocity and angular resolutions of the HI data. The horizontal line indicates the HI systemic velocity: clearly the CO mainly probes the kinematics on the approaching side of the disc. The shape of the CO PV diagrams suggests a rising rotation curve that perhaps flattens in the outer parts, as it is often seen in dwarf galaxies (e.g. Swaters et al. 2009; Lelli et al. 2012a, b). We note, however, that these PV diagrams do not correspond exactly to the disc major axis (they were chosen to go through the peaks of the CO emission), hence they do not capture the full disc rotation (cf. Fig. 5 of Lelli et al. 2015). Towards the very SW, outside the ellipse showing the extension of the HI disk, the HI emission is not consistent anymore with a rotating disc; it is representative of the underlying tidal debris, showing broad and asymmetric HI line profiles.
3.3 Comparison of CO with the distribution of SF regions
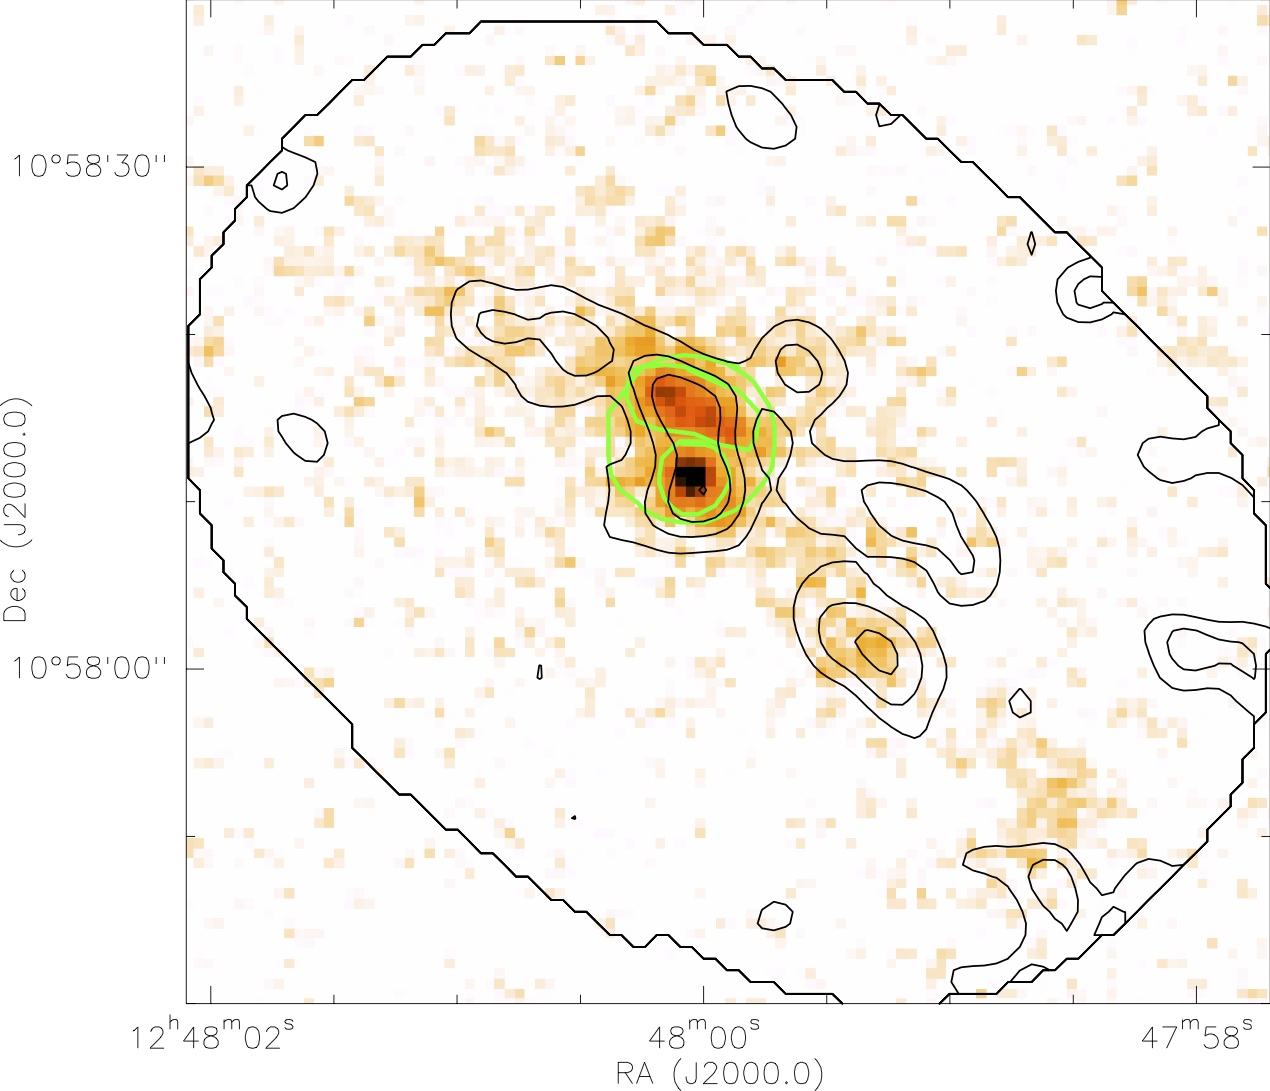
In Fig. 6 we show an overlay of the CO emission (contours) with the 8 m emission. The NE CO cloud coincides with considerable SF, visible in all tracers, whereas at the position of the SE cloud weaker 8 m. SF traced by 8 m is also present close to the emission of the tentative weak southern CO cloud, close to the edge of our field of view.
4 Spectral Energy Distribution and modelling
4.1 Photometry
We made use of the multiwavelength maps available for VCC 2062 and determined the Spectral Energy Distribution (SED) from the FUV to 24 m. We used the same aperture for all bands and carried out the photometry in 2 areas, (i) an aperture encompassing the entire object visible in the optical, including an extended area with weaker emission and no signs of substantial young SF, as traced for example by H or 8 m emission (see the lower left image in Fig. 1), and (ii) an aperture encompassing the total CO emission (the same aperture as in Fig. 3). For each image, we subtracted the average sky background measured in close-by regions outside of the main aperture. For the Spitzer images we applied, following the IRAC and Spitzer handbooks aperture correction factors of 0.95, 0.97, 0.88 and 0.83 for the IRAC bands 1 to 4 and a factor of 1.12 for the MIPS 24 m band. For the NGVS data no aperture corrections were necessary due to their high angular resolution compared to the aperture size. For the GALEX images we estimated the aperture correction from the 8 m image which shows a similar structure. The aperture correction was derived as the ratio between the flux of the original 8 m map to the flux from the 8 m map convolved to the GALEX resolution. We derived values for the aperture correction of 2% for the FUV and 3% for the NUV emission.
We determined the error as the quadratic sum of 3 components: (i) The photometric error due to the noise in the image. This component was usually negligible. (ii) The error due to variations in the background level, estimated from the differences of the mean values in the various background apertures. (iii) Calibration uncertainty as listed in Table 1.
The fluxes derived are listed in Table 3. They are corrected for a Galactic extinction of , based on the Schlafly & Finkbeiner (2011) recalibration of the Schlegel et al. (1998) extinction values and extrapolated using the Cardelli et al. (1989) extinction law with .
| Band | Flux | ||
|---|---|---|---|
| [m] | [mJy] | ||
| total galaxy | CO area | ||
| FUV (GALEX) | 0.154 | 0.055 0.005 | 0.039 0.004 |
| NUV (GALEX) | 0.232 | 0.083 0.005 | 0.051 0.003 |
| u (NGVS) | 0.381 | 0.19 0.02 | 0.10 0.01 |
| g (NGVS) | 0.487 | 0.32 0.03 | 0.15 0.01 |
| i (NGVS) | 0.769 | 0.35 0.03 | 0.17 0.01 |
| z (NGVS) | 0.887 | 0.33 0.06 | 0.15 0.02 |
| IRAC1 (Spitzer) | 3.5 | 0.23 0.03 | 0.14 0.02 |
| IRAC2 (Spitzer) | 4.5 | 0.19 0.02 | 0.10 0.01 |
| IRAC3 (Spitzer) | 5.8 | 0.83 0.35 | 0.59 0.14 |
| IRAC4 (Spitzer) | 8.0 | 1.9 0.4 | 1.3 0.2 |
| MIPS1 (Spitzer) | 24 | 1.3 0.7 | 1.0 0.3 |
4.2 SED modelling with CIGALE
To estimate physical properties of VCC 2062, we modelled the SED with the latest release of the CIGALE code666http://cigale.lam.fr (version number 0.8.1, Boquien et al. in prep.). We built a grid of models, including different SF histories, stellar populations, attenuations (shape of the attenuation curve and normalisation), and emission by dust. The full grid is made of 20,966,400 models. In more detail, these components cover the following parameter space:
-
1.
Guided by the high UV/H luminosity ratio, we modelled the SF history by a double decaying exponential. The first exponential represents the long term SF of the object, starting 13 Gyr ago and with an –folding time ranging from 1 Gyr to 8 Gyr in steps of 1 Gyr. The second exponential represents the latest star–forming episode having started between 50 Myr and 500 Myr ago, with an –folding time from 50 Myr to 500 Myr, both in steps of 50 Myr. This second episode is assumed to have formed between 0.1% and 50% (the sampling being 0.1%, 0.5%, 1%, 5 %, 10%, and afterwards increasing in steps of 5% until 50%) of the total stellar mass.
- 2.
-
3.
We adopt a Chabrier (2003) Initial Mass Function (IMF), which is very similar to the Kroupa IMF.
-
4.
The stellar populations are attenuated with a power–law–modified starburst extinction law (, with (in steps of 0.1)). The reddening of stars younger than 10 Myr is comprised between 0.1 mag and 0.75 mag (increasing in steps of 0.05 mag). Young stars that have not yet broken out completely from their birth clouds tend to be more attenuated than the old stellar population (e.g. Calzetti 2013). In order to take this into account, we apply a reduction factor (0.25, 0.50, or 0.75) to the reddening of old stars.
-
5.
The emission of dust is computed from the absorbed energy from the UV to the near–infrared through an energy balance principle, modelled using the Dale et al. (2014) template, with the parameter varying between 0.5 and 4.0, in steps of 0.5.
Finally, the physical properties such as the SFR, the stellar mass, or the attenuation are estimated from the full grid of models through a Bayesian–like analysis of their respective marginalised probability distribution function.
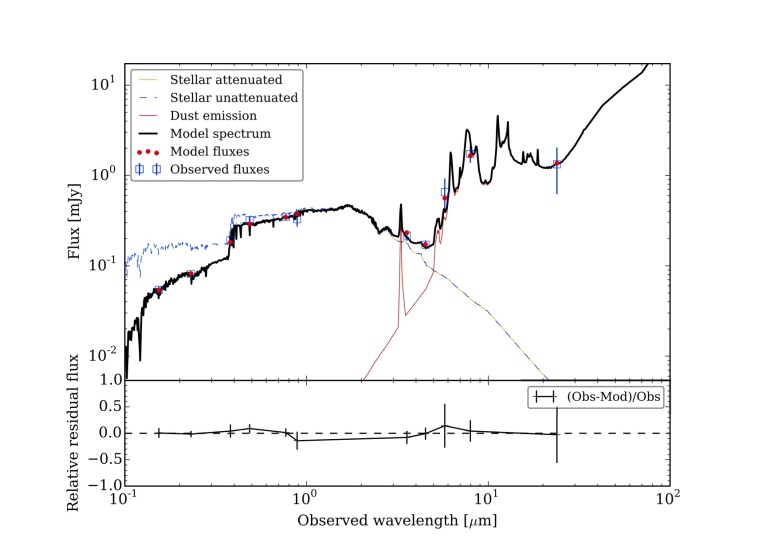
We show the best fit for the total galaxy in Fig. 7. The most relevant best-fit parameters are listed in Table 4 (both for the total galaxy and for the CO-emitting region). The stellar emission was fitted by a combination of a burst and an underlying older component. The mass fraction in the burst ( 40%) is found to be considerable but the exact value is not well constrained. The age of the burst of about 0.3 Gyr is consistent with the expected age of the merger (several hunddred Myr). The SFR has been declining by a factor of about 1.4 during the last 100 Myr.
The SED of VCC 2062 has been modelled before by Boquien et al. (2010). The present analysis includes two major improvements. (i) The quality of the data set has improved substantially. Apart from a higher image quality in the optical range, the data set now includes high-quality data in the and bands which were absent or very poor in Boquien et al. (2010). (ii) The modelling is done with the CIGALE code instead of PEGASE which was used in Boquien et al. (2010). The most relevant improvement in CIGALE is that the fitting process relies on a Bayesian estimate of the marginalised probability distribution functions, allowing more reliable estimates of the physical properties and the associated uncertainties. Furthermore, the entire SED from the UV to the IR is modelled consistently now, with the energy absorbed in the UV being re-emitted in the IR by the dust. This allows us to make use of the mid-IR emission which is crucial to break the age-attenuation degeneracy of the object. The results obtained here remain broadly consistent with those from Boquien et al. (2010), but represent a considerable improvement, for example with respect to the the SFR which could not be determined reliably in the previous study.
| Parameter | total galaxy | CO area |
|---|---|---|
| present SFR ( M⊙ yr-1) | 3.9 0.9 | 3.0 0.4 |
| past SFRa𝑎aa𝑎aSFR averaged over the past 108 yr. ( M⊙ yr-1) | 5.4 1.0 | 3.7 0.7 |
| total stellar mass ( M⊙) | 7.1 2.0 | 3.1 0.9 |
| age of the burst (Myr) | 376 99 | 313 86 |
| (mag) | 0.24 0.06 | 0.28 0.06 |
| (mag) | 1.25 0.17 | 1.31 0.15 |
5 The SF law in VCC 2062
5.1 Calculation of the star formation rate
The high-resolution CO data allows us to study the SF law separately for the NE cloud and SW cloud, as well as for the region encompassing the entire molecular gas emission. Hence, we are probing SF on a kpc scale (the linear sizes of the NE and SW regions are 2.5 and 1.6 kpc, respectively). We calculated the SFR using different tracers which allows us to obtain a complete picture of the SF history. Whereas H is emitted from the most massive, ionizing stars and traces the very recent SFR ( 10 Myr), the UV radiation is emitted mostly by stars of several solar masses and probes the SFR over the past Myr. Both emissions need to be extinction-corrected, which can introduce a considerable uncertainty. The emissions by dust at 8 m and 24 m have the advantage of being, due to their long wavelengths, practically extinction-free SF tracers, but they rely on the presence of dust and might therefore miss the fraction of SF which is not attenuated. The combinations of stellar and dust emission (here we use 8 m, 24 m and H/UV) are expected to be the most reliable tracers as they are sensitive to both dust-free and dust-enshrouded regions with no need to apply an extinction correction (see Kennicutt & Evans 2012).
We carried out aperture photometry on the FUV, H, 8 m and 24 m images using the aperture as following the CO emission (total emission, NE and SW cloud, see Fig. 3). In addition, we derived the flux for the highest-resolution SFR tracers, H and 8 m using smaller apertures centred on peaks of the 8 m emission (see Fig. 6). In order to take the different angular resolutions of the data into account we performed a Gaussian convolution on the H and 8 m map to the resolution of the taper90 CO data (42). The resolution of the GALEX FUV map is comparable to that of the taper90 CO. On the other hand, the resolution of the 24 m is slightly worse. We ignore this effect because it is expected to be small compared to the flux uncertainty and because the 24 m emission is not our main SF tracer. In this analysis we give more weight to the combined 8 m and H emission which has a higher resolution and higher signal-to-noise.
The stellar contribution to the 8 m was found to be less than 0.5% in the CIGALE modelling, and therefore we assume that the 8 m emission is entirely emitted by dust. We corrected the UV emission for Galactic foreground extinction (see Sect. 3.5). We furthermore applied a correction for the internal extinction based on the values derived in the SED modelling with CIGALE (Table 4). The total extinction correction of the UV flux was significant (a factor 4). The extinction correction of the H flux was very small (0.07 mag, or a factor of 1.06), derived from the H/H ratio (Duc et al. 2007).
We used the prescriptions in Tables 1 and 2 of Kennicutt & Evans (2012) to derive SFRs, both from monochromatic and mixed (stellar+dust dust emission) tracers, except for the calculation of the SFR from the 24 m emission where we used the relation derived by Calzetti et al. (2007) from resolved observations (SFR = )). In addition we used the relation from Zhu et al. (2008) to derive the SFR from the 8 m emission (SFR = )). All SFRs were calculated for a Kroupa IMF (Kroupa 2001) which is very similar to the Chabrier IMF used in the CIGALE modelling.
| Band | Fluxa𝑎aa𝑎aThe fluxes and luminosities are corrected for Galactic foreground emission as explained in Sect. 3.5. | Luminositya𝑎aa𝑎aThe fluxes and luminosities are corrected for Galactic foreground emission as explained in Sect. 3.5. | SFRb𝑏bb𝑏bThe SFRs derived from the UV flux takes into account both the Galactic foreground extinction and an internal extinction derived from the stellar population fit (see Table 3 and Sect. 3.6). | c𝑐cc𝑐cMolecular gas depletion timescale, calculated as the ratio between the SFR from column 4 and the molecular gas mass from Table 1. | b𝑏bb𝑏bThe SFRs derived from the UV flux takes into account both the Galactic foreground extinction and an internal extinction derived from the stellar population fit (see Table 3 and Sect. 3.6). |
|---|---|---|---|---|---|
| [mJy]d𝑑dd𝑑dThe unit for most fluxes entries is mJy, expect for H which is given in erg cm-2 s-1. | [ erg s-1] | [M⊙ yr-1] | [ yr] | [ M⊙ yr-1 kpc-2] | |
| [ erg cm-2 s-1] d𝑑dd𝑑dThe unit for most fluxes entries is mJy, expect for H which is given in erg cm-2 s-1. | |||||
| Total emission | |||||
| FUV | 0.039 0.004 | 265.4 | 39.1 | 0.47 | 7.56 |
| H | 4.24 0.42 | 1.46 | 7.8 | 2.3 | 1.52 |
| 8 m | 1.25 0.18 | 161.33 | 19.4 | 0.9 | 3.74 |
| 8 m+H | - | - | 17.8 | 1.0 | 3.44 |
| 24 m | 1.00 0.30 | 43.19 | 15.2 | 1.2 | 2.95 |
| 24 m+FUV | - | - | 19.4 | 0.9 | 3.77 |
| 24 m+H | - | - | 12.5 | 1.5 | 2.43 |
| NE cloud | |||||
| FUV | 0.030 0.003 | 205.2 | 30.2 | 0.61 | 5.84 |
| H | 3.76 0.38 | 1.22 | 6.6 | 1.7 | 2.27 |
| 8 m | 0.92 0.12 | 118.67 | 14.2 | 0.8 | 4.94 |
| 8 m+H | - | - | 13.9 | 0.8 | 4.82 |
| 24 m | 0.87 0.18 | 37.33 | 13.3 | 0.8 | 4.54 |
| 24 m+FUV | - | - | 15.7 | 1.2 | 5.33 |
| SW cloud | |||||
| FUV | 0.008 0.001 | 51.7 | 7.6 | 2.4 | 1.47 |
| H | 0.60 0.06 | 0.19 | 1.0 | 6.3 | 0.60 |
| 8 m | 0.26 0.05 | 33.26 | 4.0 | 1.6 | 2.32 |
| 8 m+H | - | - | 3.1 | 2.1 | 1.79 |
The resulting values for the SFR, together with the SFR surface densities, , are listed in Table 5. The uncertainty in the SFRs is only partly due to the error in the fluxes from which they are calculated, but more by the intrinsic uncertainty in the calibration of the SFR tracers which can be up to a factor of 2 (Leroy et al. 2012). The dust derived and combined tracers give similar results in all regions. The SFR derived from the H emission yields a SFR which is a factor lower while the UV emission tends to give a higher SFR by a factor of (both compared to dust derived and combined tracers.) The largest difference is thus between the SFR derived from FUV and from H (factor 2-5). This result could be due to the sensitivity of both tracers to extinction which makes them less robust than the combined tracers. The higher SFR derived from the UV could also be the result of the decreasing SFR after a single burst of SF and the short life-time of the H compared to the UV emitting stars. Interestingly, such an effect has also been found by Lee et al. (2009) for a sample of 300 dwarf galaxies that showed, in contrast to spiral galaxies, a systematically lower SFR from H than from UV (all SFR tracers having been corrected for extinction).
5.2 Comparison to star formation laws
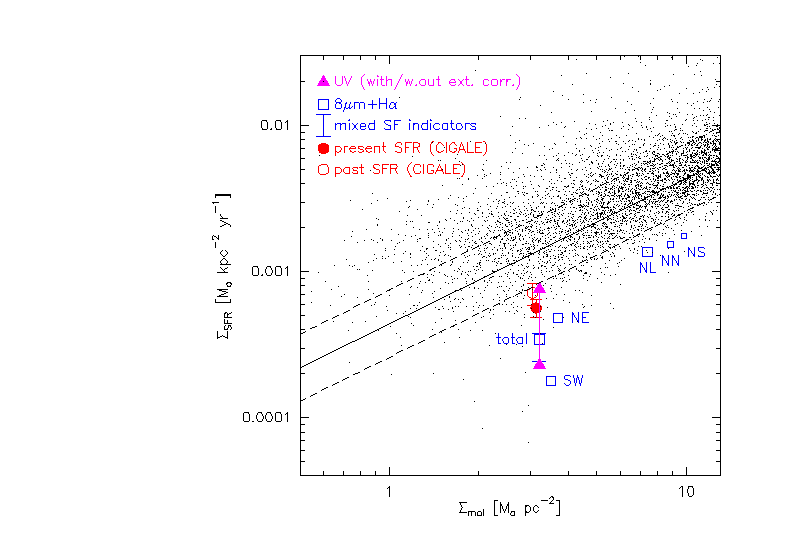
Fig. 8 shows the comparison of to the surface density of the CO-derived molecular gas, as the phase that is more closely related to SF, for different regions in VCC 2062 in a classical Kennicutt-Schmidt (KS) plot. We show the values derived for the different regions (NE, SW and entire CO-emitting area) and different tracers from Table 5. Furthermore we show the values for the small apertures centred on the SF peaks in the NE region. We also include the present and past SFR surface density derived from the SED fitting with CIGALE (Table 4). We compare the data from VCC 2062 to those of a sample of spatially resolved observations of nearby galaxies from HERACLES (Bigiel et al. 2011)999 The SFR and gas masses for this sample and the other samples used for comparison, are adapted to our choice of the IMF, CO-to-H2 conversion factor and helium fraction.. From these data, as well as from the earlier studies by Bigiel et al. (2008) and Leroy et al. (2008), a linear relation between and has been found for angular scales between 180 pc and 1.7 kpc. Bigiel et al. (2011) compared the HERACLES data to an extensive data set of galaxies from the literature and found a consistent trend, albeit with an increased scatter (about 0.5 dex). Their linear relationship implies a constant gas depletion time of Gyr which can be interpreted as a constant SFE per molecular cloud.
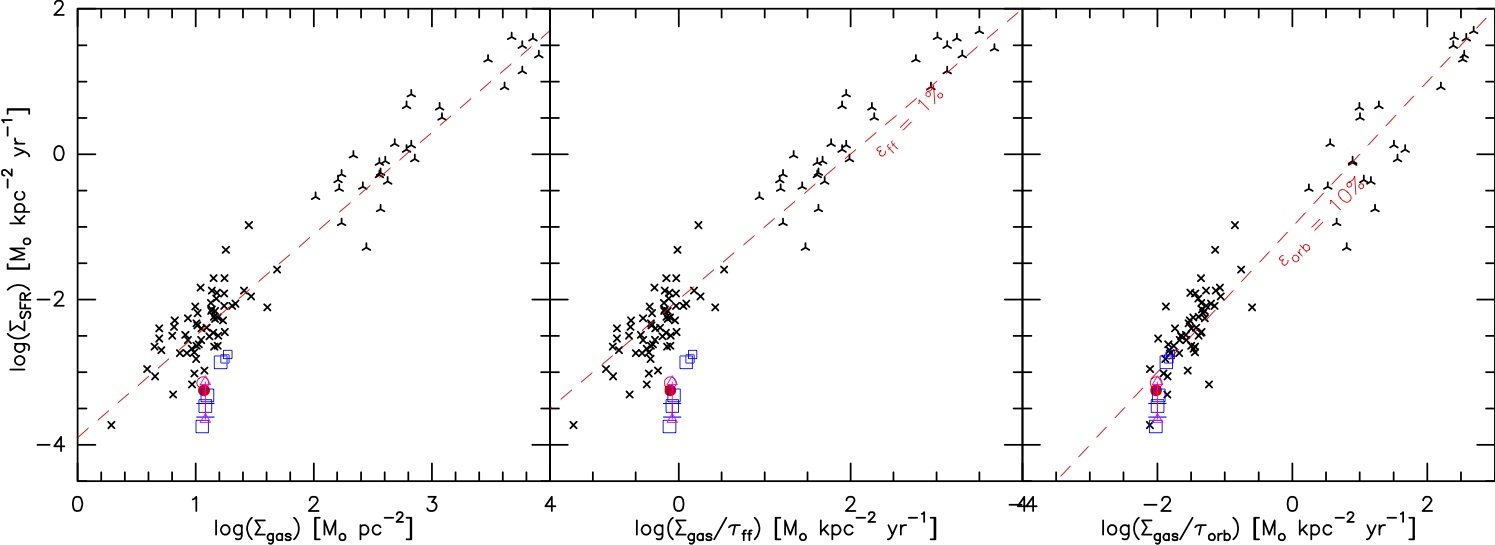
In Fig. 9 (left) we show a similar relation, but now comparing to the surface density of the total (molecular and HI) gas. We include, for comparison, data for the galaxy sample from Kennicutt (1998), spanning from spiral to starburst galaxies, and the corresponding fit to those data which is a power-law in the form 1.4.
As a third SF law we test the relation proposed by Krumholz et al. (2012) (Fig. 9 (middle). They derived a good relation between and /, holding from molecular cloud scales to starburst galaxies, where is the local free-fall time of the gas. This quantity can be calculated, assuming that the molecular gas is distributed in GMCs, as
| (2) |
where is the gravitational constant, the gas velocity dispersion, the surface density of a typical molecular cloud, adopted, following Krumholz et al. (2012), as 85 M⊙ pc-2, and the average gas surface density in the region where the stars form. We adopt for the molecular gas the same velocity dispersion as for the atomic gas ( km s-1, Lelli et al. 2015). We note, however, that this model should be applied with caution to VCC 2062 where not only gravitational but also tidal forces might be important.
The values of of VCC 2062 lie below all these three relations. The difference is particularly large for the SFR derived from the hybrid SF indicators, and largest for the SW cloud (more than a factor of 10). The difference for the SFRs derived from the extinction-corrected UV emission and with CIGALE are less pronounced. They are on the low side, just outside the scatter, of what is expected from the spiral galaxy sample. The values of both and depend on the size of the aperture and increase for smaller apertures which are centred on peaks of the SF region. However, they still lie well below the three relations even for the smaller apertures.
As a final test, we looked into the relation between and / (Elmegreen 1997; Silk 1997). Kennicutt (1998) found that this prescription adjusted the data as well as just with . Moreover, starburst galaxies at high redshifts seem to deviate from the standard KS relation but adhere to its kinematical version with orbital times (Daddi et al. 2010; Genzel et al. 2010). This relation implies that per rotation period about 10% of the available gas is converted into stars. The physical reason for this relation is still open and includes processes such as spiral density waves or, in a slightly modified model, cloud-cloud collisions (Tan 2000) or cloud collapse due to a large-scale Toomre instability (Krumholz et al. 2012). Intriguingly, a similar relation between and / also holds for dwarf galaxies, which lack a well-defined spiral pattern and are probably forming stars in a HI-dominated regime (Lelli et al. 2014). There are, however, also observations that do not strongly support this prescription. Leroy et al. (2008) compared the orbital timescale to the radial variation of the SFE and concluded that alone cannot explain SF, and Krumholz et al. (2012) showed that a relation between and / is not able to explain the process of SF from very small (molecular clouds) to large (starburst) scales.
Due to the lack of DM, VCC 2062 has a long orbital period of, derived from the HI, yr (Lelli et al. 2015). Together with the mean gas depletion time of yr (derived from the mixed tracers, see Table 4) we derive a gas consumption time per revolution of 6-12% in the range of the value of 10% found by Kennicutt (1998) In Fig. 9 (right) we compare the relation derived with this value for VCC 2062 to that of the sample from Kennicutt (1998). Indeed, VCC 2062 follows this relation well, with a very good agreement for the NE region and the total emission and an offset towards low values only for the SE region. The similarity of the SFE per revolution in VCC 2062 and spiral/starburst galaxies could indicate that galaxy-wide processes related to the rotation are responsible for the collapse of molecular clouds. If this were the reason we would expect a similar result for TDGs in general. For the TDG in Arp 158 (Boquien et al. 2011), the two TDGs in Stephan’s Quintet (Lisenfeld et al. 2004) and a small sample of TDGs detected in CO (Braine et al. 2001), could be estimated and was found – contrary to VCC 2062 – to be similar to that of spiral galaxies ( yr). These observations are mostly based on single pointings with the IRAM 30m telescope which do not resolve the structure of the TDGs and therefore do not allow us to apply kinematical models to derive . Thus, the analysis of the available data of other TDGs does not allow to draw any firm conclusions with respect to the role played by in the SF process.
5.3 The specific star formation rate
We used the present SFR and the stellar mass derived from the stellar population CIGALE fitting to calculate the specific SFR (sSFR), as sSFR = SFR/M∗, yielding sSFR = yr-1. This value lies in the range typical for low-mass spiral galaxies with stellar masses of M⊙ (see Kennicutt & Evans 2012, for a summary). Applying the relation from Schiminovich et al. (2007) (log(sSFR) = -0.36 log(M∗)-6.4) we would expect a somewhat higher sSFR for the low-mass VCC 2062 (M M⊙), of the order of yr-1. The most likely reason for the somewhat lower value is that VCC 2062 is a recycled galaxy so that part of its stars might come from the parent galaxy and have not formed in situ. Fig. 2 supports this conclusion since it clearly shows a bridge of old stars from NGC 4695 to VCC 2062. We can test this by deriving the sSFR only in the part of the galaxy where recent SF takes place, assuming that all the stars here have formed in VCC 2062. When we use the CIGALE value for the SFR and M∗ for the CO-emitting area and derive sSFR = yr-1, close to the expected value.
6 Discussion
6.1 VCC 2062 as an old TDG
Duc et al. (2007) studied VCC 2062 in detail and concluded that it is most likely an old TDG. In this study we confirm this view. Two important new pieces of evidence reinforce the past conclusion. (i) A kinematical analysis by Lelli et al. (2015) shows that there is no evidence for DM in VCC 2062, as predicted for this class of objects. (ii) The deep NGVS image reveals a bridge between NGC 4694 and VCC 2062 (see Fig. 2), clearly showing the connection between these objects. Besides, the new deep image shows that the putative parent galaxy exhibits many tidal disturbances consistent with the hypothesis that it is the result from a major gas-rich merger, i.e. the type of collisions able to form TDGs.
The large, multiwavelength data set available for VCC 2062 has allowed detailed analysis of the present and past SF, making VCC 2062 the TDG with the best-studied SED. Previous, similiar studies of TDGs and intergalactic SF regions (Boquien et al. 2007, 2009, 2010), had to base their SED modelling on a more incomplete wavelength range which limited the conclusions, for example about the old stellar population. Our analysis shows that the SFR has been declining in the past with a burst that took place about 300 Myr ago and included a considerable fraction of the mass of the object. This timescale is shorter that the typical merger timescale of 1 Gyr (Bournaud 2010), consistent with the picture that the SF has taken place in the TDG.
The mass fraction of stars formed in the burst () is higher than typical values in spiral and dwarf galaxies (see Gil de Paz et al. 2003, finding that the burst strengths is 1% in Blue Compact Dwarf Galaxies) and typical of what is found in TDGs for which in some cases no old stellar population is found at all (Boquien et al. 2009, 2010). An open question that remains is which fraction of the old stellar population is actually associated with the gravitationally bound object, VCC 2062, and which part belongs to the tidal tail, visible in Fig. 2. About half of the stellar mass derived for the entire object is situated in the CO-emitting region with young SF. Most likely, at least this fraction of the stellar mass belongs to VCC 2062. However, in order to definitively conclude this, deep spectroscopical observations determining the kinematical association of the old stars with VCC 2062 or the tail would be necessary.
6.2 Comparison to other TDGs
| Name | Dist | FWHM | Area | SFR | Ref. | |
|---|---|---|---|---|---|---|
| [Mpc] | [″/kpc] | [kpc2] | [ | [ | ||
| M⊙] | M⊙yr-1] | |||||
| Arp158 | 62.1 | 22 / 6.6 | 49.3 | 8.5 | 5.0 | (1) |
| Arp105S | 115.0 | 22 / 12.2 | 169.9 | 19.8 | 8.1 | (2) |
| NGC4676N | 90.0 | 22 / 9.6 | 201.5 | 10.3 | 8.1 | (2) |
| NGC7252W | 64.0 | 11 / 3.3 | 12.6 | 1.3 | 0.5 | (2) |
| SQB | 85.0 | 22 / 10.0 | 112.2 | 48.3 | 32.2 | (2,3) |
| SQB | 85.0 | 4 / 1.6 | 21.2 | 34.0 | 30.0 | (4) |
| SQtip | 85.0 | 4 / 1.6 | 5.0 | 11.0 | 5.0 | (4) |
| J1032+1952 | 20.4 | 22 / 2.2 | 6.0 | 10.5 | 2.4 | (5) |
| Arp245N | 31.0 | 22 / 3.3 | 27.0 | 19.0 | 9.0 | (6,7) |
| VCC 2062 (NE) | 17 | 22 / 1.8 | 7 | 2.3 | 0.2 | (8,9) |
| VCC 2062 (total) | 17 | 22 / 1.8 | 2.7 | 1.4 | 0.2 | (8,9) |
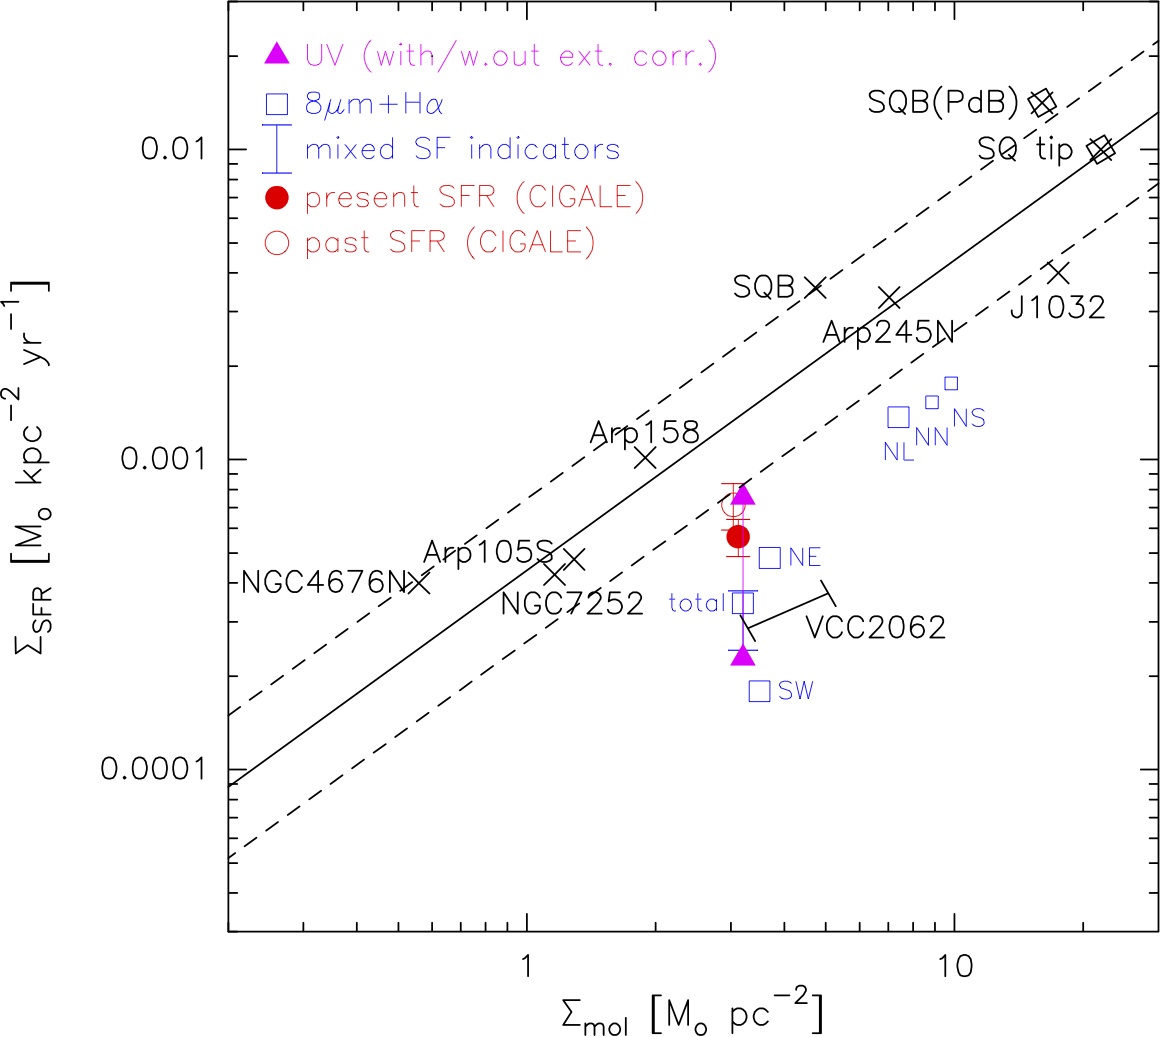
In Fig. 10 we show the KS-relation for a small sample of TDGs taken from the literature (see Table 10), together with the data for VCC 2062. Most of the literature data have been obtained with single dish telescopes (IRAM 30m) and have therefore a poor angular resolution, corresponding to linear scales up to 12.2 kpc (see Table 10), much larger than the size of the SF regions. This has two consequences. (i) The surface densities are unrealistically low because the molecular gas mass and SFR are averaged over a large area. (ii) There is some uncertainty as to where on the KS-relation the objects would fall for smaller apertures centred on the SF regions.
The fact that almost all TDGs follow the standard KS-relation indicates that SF in TDGs seems to proceed in the same way as in spiral galaxies in spite of the very different local conditions (DM content, presence of spiral density waves and tidal forces) in both types of objects. The noticeable exception is VCC 2062 which lies below the standard KS-relation.
6.3 Why is the SFE low in VCC 2062?
The SFR surface density in VCC 2062 is below what is expected from its molecular gas surface density, both when comparing it to spiral galaxies or other TDGs. The difference is particularly large for the SW region which has only weak SF but a considerable amount of molecular gas. The difference is larger for SFRs based on dust and H than for those based on UV or CIGALE modelling. Furthermore, the difference decreases for smaller apertures which are centred on the peaks of SF visible in 8 m within the NE region, but is still there. Thus, even though the exact value of the SFE varies with the choice of SF tracer and with the angular resolution, we find the consistent result that the SFE is low in VCC 2062 compared to other TDGs and spiral galaxies.
The molecular gas surface density in VCC 2062 is very low, among the lowest probed in similar studies (e.g. Bigiel et al. 2008, 2011; Schruba et al. 2011). SF in low gas surface densities has been studied in the outskirts of galaxies (Schruba et al. 2011) or in LSB galaxies (Boissier et al. 2008; Wyder et al. 2009) and very low values of SFE(gas)= SFR/ have been found. However, in these regions molecular gas formation is not very efficient and the molecular gas fraction is low. Possibly, the SFE based on the (undetected) molecular gas would have been normal. This is indeed what has been found in the outskirts of galaxies by stacking the CO spectra Schruba et al. (2011). These results are consistent with the picture that at low surface brightnesses the formation of molecular gas is inefficient, but when it is present, it forms stars with the same SFE as in the inner disks of spirals. The situation in the LSB galaxy VCC 2062 is very different from the objects described above. Here, the molecular gas fraction is considerable (/). The question is why this molecular gas is forming stars at a very low efficiency.
VCC 2062 is not the only object with abundant molecular gas but little SF. Similar situations have been observed in other unusual objects, for example in some regions of the TDG candidate J1023+1952 in the system Arp 94 (Lisenfeld et al. 2008), the intergalactic bridge in Stephan’s Quintet (Lisenfeld et al. 2002a; Guillard et al. 2012), the face-on colliding Taffy galaxies (Braine et al. 2003, 2004), some galaxies in Hickson Compact Groups (HCG; Alatalo et al. 2015) or in the gas in tails stripped from galaxies in clusters (Jáchym et al. 2014; Verdugo et al. 2015). The reason for the lack of SF in spite of the presence of abundant, CO-traced molecular gas is not completely clear, and might be different in each case. A possible reason is the lack of a dense molecular gas phase, as in the bridge of the Taffy galaxies. Braine et al. (2003) showed for this system that molecular gas reformed quickly after the collision, but the dense molecular cores were destroyed. In galaxies in HCGs, Alatalo et al. (2015) argued that shock-injected turbulence perturbed the molecular gas and decreased the SFE.
The situation in VCC 2062 is probably different from the above examples. It is most likely a self-gravitating object, similar to other TDGs in which, in general, the SFE seems normal (see Sect. 5.2). However, the much lower surface brightness of VCC 2062, both with respect to the gas and to the stars, is a major difference between VCC 2062 and other studied TDGs. The stellar surface density (0.6 M⊙ pc-2 within the CO-emitting area) is considerably lower than which may lead to a flaring in the gas disk, similar to what is seen in the outer disks of spirals and irregular galaxies (Elmegreen & Hunter 2015), causing a decrease in the volume density of the gas. An additional effect of the low surface density of newly formed stars is that their combined radiation pressure is less efficient in dispersing the molecular gas. Thus, we might simply be seeing the remaining molecular gas, left-over after the formation of stars. Due to the low stellar surface brightness the interstellar radiation field and thus the gas temperature are most likely low. Shetty et al. (2011) showed that there is only a weak dependence of on the gas temperature, , ( for K). Apart from being weak, the direction of this dependence means that we might slightly underestimate the molecular gas mass, and thus overestimate the SFE, i.e. making the difference with respect to spiral galaxies even larger.
The kinematic information of the gas allows us to apply the stability criterium of Toomre (1964) and derive the critical gas surface density for SF as
| (3) |
where is a constant which we adopt, following Martin & Kennicutt (2001), as and is the epicyclic frequency. We derived critical densities of 2 and 4 M⊙ pc-2 for the SW and NE regions, albeit with a high uncertainly (factor 2-3), mostly because of the uncertainty in the rotation velocity which is a factor of 2 (see Tab. 7 in Lelli et al. 2015). However, even considering this uncertainty, the observed gas surface densities (between 11 and 13 M⊙ pc-2, see Tab. 2) seem to be above the estimated critical value so that the gas is expected to be able to form stars.
Finally, the fact that VCC 2062 is a small object where SF is intermittent might play a role when comparing its SF law to that of larger spiral galaxies where local variations average out more easily. In fact, the analysis of the HI distribution and kinematics (Lelli et al. 2015) has shown that the SF regions are distributed in a very asymmetric way in VCC 2062 (see Fig. 5). The young SF regions all lie on one side of the kinematical centre, whereas the old stars, traced by optical emission, are found also on the other side and extend to the tidal tail connecting VCC 2062 to the parent galaxy. Temporal variations in the SF history could have two consequences. (i) The calibration of the SF tracers is different from that in spiral galaxies. Indeed, Leroy et al. (2012) has shown that SF tracers are not reliable and do not give very consistent results among themselves on kpc scales and for values of M⊙ yr-1 kpc-1. (ii) Our observations might be sensitive to short temporal variations in the ratio between SFR tracers and molecular gas mass which would average out in larger spiral galaxies. Such an effect is expected to be particularly relevant on small angular scales as in the small and faint region SE where the SFE is indeed particularly low.
In summary, there are a number of reasons why the SFE in VCC 2062 is low. We cannot firmly conclude which are the most relevant ones, and very likely, several of them play a role. In any case, it is very likely that the low surface brightness of the object (both in stars and gas) plays an important role in lowering the gas density, decreasing the stellar radiation feedback and increasing the uncertainties in the standard SFR tracers.
7 Summary and conclusions
We presented new CO(1-0) data obtained with the Plateau de Bure Interferometer of VCC 2062, a nearby TDG at the outskirts of the Virgo Cluster. These data have allowed us to study the molecular gas distribution and kinematics. Using a large set of complementary data we modelled the UV-to-IR SED and derived the SFR from different tracers. Combining the SFR with the CO data, we studied the SF law in this object. TDGs have two important properties that make this analysis particularly interesting: (i) In contrast to classical dwarf galaxies, their metallicity is higher (typically of the order of 0.5-0.3 of the Milky Way value) and therefore CO is a good tracer of the molecular gas, and (ii) their DM content is very low and so we are able to study SF in this extreme, DM-free environment. The main conclusions are summarised as follows.
-
•
The CO emission is distributed in two main regions, called NE and SW. The NE region coincides with the peak of the atomic gas and with SF tracers, whereas the SW region lies in between two HI peaks and has little associated SF.
-
•
A comparison of the atomic and molecular gas showed that the atomic gas is more extended than the CO and young SF regions. CO is only found on one side of the kinematical centre of the galaxy. The HI and CO kinematics agree well in the regions where their emissions coincide.
-
•
New, deep optical observations of this system with the NGVS revealed a stellar bridge between the parent galaxy NGC 4695 and VCC 2062. This, together with the negligible dark matter content found from HI kinematical modelling (Lelli et al. 2015), gives the final proof that VCC 2062 is a TDG.
-
•
We modelled the UV-to-IR SED with CIGALE and found that the SFR has noticeably declined in the recent past (a factor of 1.3-1.4 between the present SFR and the SFR averaged over the past yr).
-
•
We calculated the SFR from various tracers (UV, H, 8, and 24 m and combinations of them). In general the different tracers gave compatible results with the exception of the UV which gave a factor 2-4 higher SFR. A declining SFR or a paucity of massive stars are possible reasons. The SFR surface density derived from the dust emission and H was lower than those derived by the SED modelling from CIGALE by a factor of 2-3.
-
•
The molecular gas depletion time (= /SFR), derived at different angular resolutions between 0.3 and 1.5 kpc, of about Gyr, derived from H and dust tracers, is long compared to the median value found by Bigiel et al. (2011) (= 2.35 Gyr, for different samples of galaxies). The discrepancy is particularly large for the SW region (gas depletion time of yr). Similar discrepancies were found when comparing VCC 2062 to other SF laws (Kennicutt 1998; Krumholz et al. 2012).
-
•
We compare the SFE of VCC 2062 to a small sample of other TDGs, most of them with data for the molecular gas at a poorer angular resolution. We find that TDGs in general follow the same KS-relation as spiral galaxies and that VCC 2062 is the only exception.
-
•
We discussed various possible reasons for this long molecular gas depletion time. The difference is not due to an inefficient formation of the molecular gas since abundant molecular gas is present. The low surface brightness of VCC 2062 most likely plays an important role in changing the physical conditions compared to more massive objects (decreased mid-plane pressure, low stellar radiation field). Temporal effects due to intermittent SF and uncertainties in the calibration of the SF tracer might also play a role.
-
•
Together with the orbital timescale derived from the HI analysis ( yr, Lelli et al. 2015), we derived a gas consumption per orbit of 6-12%, in the range of the value of 10% derived for spiral a starburst galaxies in spite of the lack of DM in VCC 2062. High-resolution data for other TDGs are necessary in order to find out whether this result holds for TDGs in general which would indicate an important role of in the SF process.
Acknowledgements.
We would like to warmly thank our support astronomer at Plateau de Bure, A. Castro-Carrizo, for dedicated help during the data reduction, and F. Bigiel for making his data available to us. We appreciate the referee’s very useful comments which helped derive firmer conclusions from the data. This project made use of data obtained as part of the CFHT NGVS Large Programme. The data were processed by Jean-Charles Cuillandre and Stephen Gwyn under the supervision of Laura Ferrarese and Patrick C t . They are warmly thanked. UL acknowledges support by the research projects AYA2011-24728 and AYA2014-53506-P financed by the Spanish Ministerio de Economía y Competividad and by FEDER (Fondo Europeo de Desarrollo Regional) and the Junta de Andalucía (Spain) grants FQM108. EB acknowledges support from the UK’s Science and Technology Facilities Council (grant numbers ST/J001333/1, ST/M001008/1). This work is based on observations carried out under project number ue1e-2010 with the IRAM Plateau de Bure Interferometer. IRAM is supported by INSU/CNRS (France), MPG (Germany) and IGN (Spain). This research has made use of the NASA/IPAC Extragalactic Database (NED) which is operated by the Jet Propulsion Laboratory, California Institute of Technology, under contract with the National Aeronautics and Space Administration. We acknowledge the use of the HyperLeda database (http://leda.univ-lyon1.fr).References
- Alatalo et al. (2015) Alatalo, K., Appleton, P. N., Lisenfeld, U., et al. 2015, ArXiv e-prints
- Asplund et al. (2005) Asplund, M., Grevesse, N., & Sauval, A. J. 2005, in Astronomical Society of the Pacific Conference Series, Vol. 336, Cosmic Abundances as Records of Stellar Evolution and Nucleosynthesis, ed. T. G. Barnes, III & F. N. Bash, 25
- Bigiel et al. (2008) Bigiel, F., Leroy, A., Walter, F., et al. 2008, AJ, 136, 2846
- Bigiel et al. (2011) Bigiel, F., Leroy, A. K., Walter, F., et al. 2011, ApJ, 730, L13
- Boissier et al. (2008) Boissier, S., Gil de Paz, A., Boselli, A., et al. 2008, ApJ, 681, 244
- Bolatto et al. (2013) Bolatto, A. D., Wolfire, M., & Leroy, A. K. 2013, ARA&A, 51, 207
- Boquien et al. (2007) Boquien, M., Duc, P.-A., Braine, J., et al. 2007, A&A, 467, 93
- Boquien et al. (2010) Boquien, M., Duc, P.-A., Galliano, F., et al. 2010, AJ, 140, 2124
- Boquien et al. (2009) Boquien, M., Duc, P.-A., Wu, Y., et al. 2009, AJ, 137, 4561
- Boquien et al. (2011) Boquien, M., Lisenfeld, U., Duc, P.-A., et al. 2011, A&A, 533, A19
- Bournaud (2010) Bournaud, F. 2010, in Astronomical Society of the Pacific Conference Series, Vol. 423, Galaxy Wars: Stellar Populations and Star Formation in Interacting Galaxies, ed. B. Smith, J. Higdon, S. Higdon, & N. Bastian, 177
- Bournaud et al. (2007) Bournaud, F., Duc, P.-A., Brinks, E., et al. 2007, Science, 316, 1166
- Braine et al. (2003) Braine, J., Davoust, E., Zhu, M., et al. 2003, A&A, 408, L13
- Braine et al. (2001) Braine, J., Duc, P.-A., Lisenfeld, U., et al. 2001, A&A, 378, 51
- Braine et al. (2004) Braine, J., Lisenfeld, U., Duc, P.-A., et al. 2004, A&A, 418, 419
- Braine et al. (2000) Braine, J., Lisenfeld, U., Duc, P.-A., & Leon, S. 2000, Nature, 404, 904
- Calzetti (2013) Calzetti, D. 2013, Star Formation Rate Indicators, ed. J. Falcón-Barroso & J. H. Knapen, 419
- Calzetti et al. (2007) Calzetti, D., Kennicutt, R. C., Engelbracht, C. W., et al. 2007, ApJ, 666, 870
- Cardelli et al. (1989) Cardelli, J. A., Clayton, G. C., & Mathis, J. S. 1989, ApJ, 345, 245
- Casoli et al. (1998) Casoli, F., Sauty, S., Gerin, M., et al. 1998, A&A, 331, 451
- Chabrier (2003) Chabrier, G. 2003, PASP, 115, 763
- Chung et al. (2009) Chung, A., van Gorkom, J. H., Kenney, J. D. P., Crowl, H., & Vollmer, B. 2009, AJ, 138, 1741
- Daddi et al. (2010) Daddi, E., Elbaz, D., Walter, F., et al. 2010, ApJ, 714, L118
- Dale et al. (2014) Dale, D. A., Helou, G., Magdis, G. E., et al. 2014, ApJ, 784, 83
- Dib et al. (2011) Dib, S., Piau, L., Mohanty, S., & Braine, J. 2011, MNRAS, 415, 3439
- Duc (2012) Duc, P.-A. 2012, Birth, Life and Survival of Tidal Dwarf Galaxies, ed. P. Papaderos, S. Recchi, & G. Hensler, 305
- Duc et al. (2007) Duc, P.-A., Braine, J., Lisenfeld, U., Brinks, E., & Boquien, M. 2007, A&A, 475, 187
- Duc et al. (2000) Duc, P.-A., Brinks, E., Springel, V., et al. 2000, AJ, 120, 1238
- Duc et al. (2015) Duc, P.-A., Cuillandre, J.-C., Karabal, E., et al. 2015, MNRAS, 446, 120
- Elmegreen (1997) Elmegreen, B. G. 1997, in Revista Mexicana de Astronomia y Astrofisica Conference Series, Vol. 6, Revista Mexicana de Astronomia y Astrofisica Conference Series, ed. J. Franco, R. Terlevich, & A. Serrano, 165
- Elmegreen & Hunter (2015) Elmegreen, B. G. & Hunter, D. A. 2015, ApJ, 805, 145
- Elmegreen et al. (2013) Elmegreen, B. G., Rubio, M., Hunter, D. A., et al. 2013, Nature, 495, 487
- Engelbracht et al. (2007) Engelbracht, C. W., Blaylock, M., Su, K. Y. L., et al. 2007, PASP, 119, 994
- Fazio et al. (2004) Fazio, G. G., Hora, J. L., Allen, L. E., et al. 2004, ApJS, 154, 10
- Ferrarese et al. (2012) Ferrarese, L., Côté, P., Cuillandre, J.-C., et al. 2012, ApJS, 200, 4
- Genzel et al. (2010) Genzel, R., Tacconi, L. J., Gracia-Carpio, J., et al. 2010, MNRAS, 407, 2091
- Gil de Paz et al. (2003) Gil de Paz, A., Madore, B. F., & Pevunova, O. 2003, ApJS, 147, 29
- Gratier et al. (2010a) Gratier, P., Braine, J., Rodriguez-Fernandez, N. J., et al. 2010a, A&A, 512, A68
- Gratier et al. (2010b) Gratier, P., Braine, J., Rodriguez-Fernandez, N. J., et al. 2010b, A&A, 522, A3
- Guillard et al. (2012) Guillard, P., Boulanger, F., Pineau des Forêts, G., et al. 2012, ApJ, 749, 158
- Hunter et al. (1998) Hunter, D. A., Elmegreen, B. G., & Baker, A. L. 1998, ApJ, 493, 595
- Jáchym et al. (2014) Jáchym, P., Combes, F., Cortese, L., Sun, M., & Kenney, J. D. P. 2014, ApJ, 792, 11
- Kennicutt & Evans (2012) Kennicutt, R. C. & Evans, N. J. 2012, ARA&A, 50, 531
- Kennicutt (1998) Kennicutt, Jr., R. C. 1998, ApJ, 498, 541
- Kroupa (2001) Kroupa, P. 2001, MNRAS, 322, 231
- Krumholz et al. (2012) Krumholz, M. R., Dekel, A., & McKee, C. F. 2012, ApJ, 745, 69
- Lee et al. (2003) Lee, H., McCall, M. L., & Richer, M. G. 2003, AJ, 125, 2975
- Lee et al. (2009) Lee, J. C., Gil de Paz, A., Tremonti, C., et al. 2009, ApJ, 706, 599
- Lelli et al. (2015) Lelli, F., Duc, P.-A., Brinks, E., et al. 2015, ArXiv e-prints
- Lelli et al. (2014) Lelli, F., Fraternali, F., & Verheijen, M. 2014, A&A, 563, A27
- Lelli et al. (2012a) Lelli, F., Verheijen, M., Fraternali, F., & Sancisi, R. 2012a, A&A, 537, A72
- Lelli et al. (2012b) Lelli, F., Verheijen, M., Fraternali, F., & Sancisi, R. 2012b, A&A, 544, A145
- Leroy et al. (2012) Leroy, A. K., Bigiel, F., de Blok, W. J. G., et al. 2012, AJ, 144, 3
- Leroy et al. (2008) Leroy, A. K., Walter, F., Brinks, E., et al. 2008, AJ, 136, 2782
- Lisenfeld et al. (2009) Lisenfeld, U., Bournaud, F., Brinks, E., & Duc, P.-A. 2009, ArXiv e-prints
- Lisenfeld et al. (2004) Lisenfeld, U., Braine, J., Duc, P.-A., et al. 2004, A&A, 426, 471
- Lisenfeld et al. (2002a) Lisenfeld, U., Braine, J., Duc, P.-A., et al. 2002a, A&A, 394, 823
- Lisenfeld et al. (2002b) Lisenfeld, U., Braine, J., Vallejo, O., et al. 2002b, in Astronomical Society of the Pacific Conference Series, Vol. 285, Modes of Star Formation and the Origin of Field Populations, ed. E. K. Grebel & W. Brandner, 406
- Lisenfeld et al. (2008) Lisenfeld, U., Mundell, C. G., Schinnerer, E., Appleton, P. N., & Allsopp, J. 2008, ApJ, 685, 181
- Martin & Kennicutt (2001) Martin, C. L. & Kennicutt, Jr., R. C. 2001, ApJ, 555, 301
- Morrissey et al. (2007) Morrissey, P., Conrow, T., Barlow, T. A., et al. 2007, ApJS, 173, 682
- Ploeckinger et al. (2014) Ploeckinger, S., Hensler, G., Recchi, S., Mitchell, N., & Kroupa, P. 2014, MNRAS, 437, 3980
- Ploeckinger et al. (2015) Ploeckinger, S., Recchi, S., Hensler, G., & Kroupa, P. 2015, MNRAS, 447, 2512
- Raichoor et al. (2011) Raichoor, A., Mei, S., Nakata, F., et al. 2011, ApJ, 732, 12
- Rieke et al. (2004) Rieke, G. H., Young, E. T., Engelbracht, C. W., et al. 2004, ApJS, 154, 25
- Schiminovich et al. (2007) Schiminovich, D., Wyder, T. K., Martin, D. C., et al. 2007, ApJS, 173, 315
- Schlafly & Finkbeiner (2011) Schlafly, E. F. & Finkbeiner, D. P. 2011, ApJ, 737, 103
- Schlegel et al. (1998) Schlegel, D. J., Finkbeiner, D. P., & Davis, M. 1998, ApJ, 500, 525
- Schruba et al. (2011) Schruba, A., Leroy, A. K., Walter, F., et al. 2011, AJ, 142, 37
- Shetty et al. (2011) Shetty, R., Glover, S. C., Dullemond, C. P., et al. 2011, MNRAS, 415, 3253
- Silk (1997) Silk, J. 1997, ApJ, 481, 703
- Swaters et al. (2009) Swaters, R. A., Sancisi, R., van Albada, T. S., & van der Hulst, J. M. 2009, A&A, 493, 871
- Tan (2000) Tan, J. C. 2000, ApJ, 536, 173
- Toomre (1964) Toomre, A. 1964, ApJ, 139, 1217
- Verdugo et al. (2015) Verdugo, C., Combes, F., Dasyra, K., Salomé, P., & Braine, J. 2015, A&A, 582, A6
- Verley et al. (2009) Verley, S., Corbelli, E., Giovanardi, C., & Hunt, L. K. 2009, A&A, 493, 453
- Werner et al. (2004) Werner, M. W., Roellig, T. L., Low, F. J., et al. 2004, ApJS, 154, 1
- Wyder et al. (2009) Wyder, T. K., Martin, D. C., Barlow, T. A., et al. 2009, ApJ, 696, 1834
- Zhu et al. (2008) Zhu, Y.-N., Wu, H., Cao, C., & Li, H.-N. 2008, ApJ, 686, 155
Appendix A Channel maps
Fig. 11 shows the channel maps of the taper50 data cube. Emission is visible in the velocity range between 1129 and 1159 km s-1, distributed in various clouds and showing a velocity gradient along the NE-SW direction.