Strain enhanced superconductivity of Mo (=S or Se) bilayers with Na intercalation
Abstract
Mo (=S or Se) is a semiconductor family with two-dimensional structure. And a recent calculation predicted the superconductivity in electron doped MoS2 monolayer. In this work, the electronic structure and lattice dynamics of Mo bilayers with monolayer Na intercalated, have been calculated. According to the electron-phonon interaction, it is predicted that these bilayers can be transformed from indirect-gap semiconductors to a superconductors by Na intercalation. More interestingly, the biaxial tensile strain can significantly enhance the superconducting temperature up to K in Na-intercalated MoS2. In addition, the phonon mean free path at room-temperature is also greatly improved in Na intercalated MoSe2, which is advantaged for related applications.
pacs:
63.22.Np, 74.78.-w, 65.80.-gI Introduction
Two-dimensional (2D) material such as graphene, black phosphorus, and layered transition metal dichalcogenides (TMDs) have attracted enormous interest for their unique structure, novel physical properties, and broad potential applications. Superior to the semi-metallic graphene, few-layer MoS2’s show moderate band gaps which are crucial for practical on/off ratio in electronic circuit devices.Radisavljevic et al. (2011) Besides, MoS2 is potentially important in optoelectronic because its band gap is in the visible light range. Wang et al. (2012) For this reason, great efforts have been made to investigate the dynamics of various carriers in MoS2 including mobilities of electrons, excitons, as well as phonons. Sim et al. (2013); Shi et al. (2013); Kaasbjerg et al. (2012, 2013)
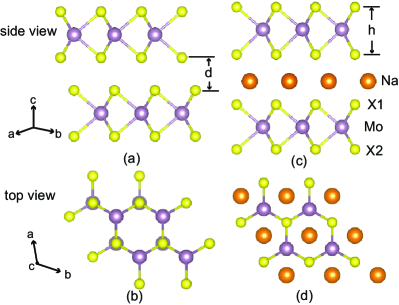
Structurally, each layer of MoS2 (as well as MoSe2) is constructed by the S-Mo-S (or Se-Mo-Se) sandwich, as shown in Fig. 1. Along the -axis, the neighboring triatomic layer is weakly coupled by van der Waals (vdw) interaction.Verble and Wieting (1970) This layered nature makes MoS2 (or MoSe2) flexible and tailorable, e.g. to be doped by ion absorption or intercalation, as well as to fabricate heterostructures. Lee et al. (2015); Huang et al. (2013); Ge and Liu (2013) These artificial modificatory MoS2 and MoSe2 show lots of extraordinary qualities. For example, a giant Rashba-type splitting was found in MoS2/Bi(111) heterostructure, Lee et al. (2015) and a half-metal behavior was predicted in Fe adatoms adsorbed on monolayer and bilayer MoS2 sheets.Huang et al. (2013) Recently, the electron-doped monolayer MoS2 was predicted to be a BCS-type superconductor with a considerable critical temperature () up to K when one extra electron artificially-added per chemical unit.Ge and Liu (2013) However, by considering realistic doping methods (e.g. K absorption),Ge and Liu (2013) the calculated was far below the expected value. Experimentally, an early work by Woollam et. al. studied the insertion of K/Na atoms into bulk MoS2, which found the maximum superconducting ’s of KxMoS2 and NaxMoS2 to be about K and K respectively. Woollam and Somoano (1976) In this sense, the electron doped MoS2 should be a promising superconductor although its real is seriously suppressed by real doping methods. Very recently, the dynamical stability and superconductivity have been reported in the free-standing Li-intercalated MoS2.Huang et al. (2016) However, in real situation these 2D few layers are putted on particular substrates and will be affected by the lattice mismatch, which have not been addressed in Ref. Huang et al., 2016.
In this work, the lattice dynamics and electron-phonon (EP) coupling of Na-intercalated MoS2 and MoSe2 bilayers have been studied via first-principles density functional theory (DFT) and density function perturbation theory (DFPT). Our calculations confirm the superconductivity in MoS2 and MoSe2 with Na intercalation. More interestingly, this superconductivity can be significantly enhanced by tensile strain. Our calculations will motivate more experimental studies to tune the physical properties like superconductivity of 2D materials by the strain effect.
II Model & methods
The DFT calculations have been performed using the PWSCF program of the Quantum-ESPRESSO distribution. Giannozzi et al. (2009) The ultrasoft pseudo-potential (including the semicore electrons as valence electrons in case of Mo) and generalized gradient approximation of Perdew-Burke-Ernzerhof (GGA-PBE) are used with a cutoff energy 35 Ry for the expansion of the electronic wave function in the plane waves. The vdw interactions are treated using the (Grimme) DFT-D2 approximation. Grimme (2006)
Mo bilayers are modeled using slabs with one Na layer (one Na per one unit cell area) inserted. The surfaces are simulated by adding a vacuum layer of Å. For the electronic structure calculations, the Brillouin zone (BZ) integrations are performed with an grid by using the first-order Hermite-Gaussian smearing technique. Within the framework of the linear response theory, the dynamical matrices are calculated for grid of special points in the irreducible two-dimensional BZ and are Fourier interpolated throughout the full Brillouin zone. The dense grid is used in the BZ integrations in order to produce the accurate electron-phonon (EP) interaction matrices.
III Results & discussion
III.1 Crystalline & electronic structures
Although the stablest Mo bilayers are stacked as the A-B type (Fig. 1(a-b)),Liu et al. (2012) this type of stacking conformation becomes dynamic unstable when Na monolayer is interacted into the Mo bilayers, as evidenced by the imaginary frequencies of phonon spectrum around point. Alternatively, the A-A type stacking conformation (Fig. 1(c-d)) is dynamic stable, which will be further discussed in Sec.III.B. Similar conclusion was also recently reported in Li-interacted MoS2 bilayer.Huang et al. (2016) Therefore, considering the dynamic stabilization, the conformation as sketched in Fig. 1(d) will be systematically studied in the following. Each primitive cell contain two Mo layers and one Na atom.
First, the relaxation is performed until the force on each atom is smaller than Ry/a.u.. The optimized lattice constant and interatomic distances are listed in Table 1 in comparison with the experimental values. The calculated lattice constant is only slight larger than the experimental value, which is quite reasonable since GGA normally overestimates lattice constants.
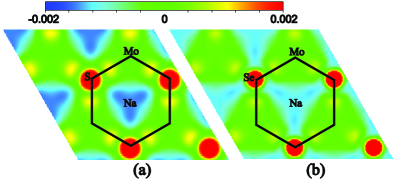
The calculated electron density difference are visualized in Fig. 2, which indicates the spatial distribution difference of electron density between the pure Mo bilayer and Na-intercalated Mo bilayer. The charge transfer from Na to is obvious, especially for =S, which changes the vdw force between original bilayers to ionic-bond-like interactions between Na and . As a direct result, the layer distance () is significantly shorten, as listed in Table 1.
| MoS | MoS2 | (MoS2)2Na | MoSe | MoSe2 | (MoSe2)2Na | |
|---|---|---|---|---|---|---|
| 3.161 | 3.204 | 3.251 | 3.285 | 3.330 | 3.385 | |
| 3.072 | 3.119 | 3.130 | 3.225 | 3.344 | 3.346 | |
| 3.074 | 3.113 | 2.249 | 3.225 | 3.178 | 2.435 |
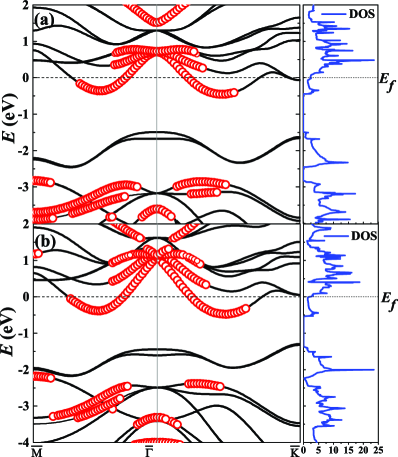
The calculated band structures and density of states (DOS) are shown in Fig. 3. As expected, the Fermi level crosses the conduction band as a direct result of Na intercalation, which dopes electrons to ’s orbitals and builds strong ionic bonding between Na-. It should be noted that this intercalation is different from previously studied Na-adsorption on MoS2 by Komesu et.al.,Komesu et al. (2014) who found a semiconductor behavior with a narrowed band gap.
III.2 Phonon, electron-phonon coupling, & superconductivity
Then we turn to pay attention to the phonon modes at the zone center. The pure MoS2 and MoSe2 bilayers have the identical point group (), which is reduced to in (Mo)2Na. For the point group, the optical modes at BZ center point can be decomposed as polarized along the hexagonal axis direction and polarized in the hexagonal closed packed plane. The phonon modes and are both Raman (R) active, while the and modes are infrared (IR) active, as sketched in Fig. 4(a). In contrast, for the point group, the optical modes at point can be decomposed as . and are infrared active, while and are Raman active. The calculated frequencies of these optical modes are listed in Table 2, in comparison with some experimental data.
| R | ||||||
|---|---|---|---|---|---|---|
| MoS2 | 464.3 | 398.9 | 376.7 | 280.9 | 25.6 | 20.3 |
| MoSe2 | 345.1 | 237.6 | 277.6 | 163.7 | 36.2 | 18.7 |
| R | ||||||
| (MoS2)2Na | 416.9 | 329.0 | 349.3 | 260.6 | 39.0 | 15.9 |
| (MoSe2)2Na | 313.2 | 206.3 | 260.4 | 154.8 | 29.5 | 19.2 |
| IR | ||||||
| MoS2 | 462.6 | 405.4 | 376.7 | 280.2 | ||
| MoSe2 | 344.1 | 235.7 | 277.1 | 163.1 | ||
| IR | ||||||
| (MoS2)2Na | 416.5 | 321.3 | 349.3 | 257.1 | ||
| (MoSe2)2Na | 311.7 | 205.2 | 260.6 | 156.0 |
For pure Mo bilayers, the calculated phonon frequencies are only slightly smaller than the corresponding experimental values.Chen et al. (2015) This tiny inaccuracy is understandable since the GGA-PBE pseudo-potential normally overestimates the volume of cell, which softens the phonon modes. For (Mo)2Na systems, there are considerable red shifts of phonon frequencies compared to the corresponding ones of pure Mo bilayers except for (MoS2)2Na and for (MoSe2)2Na. On one hand, the expanded lattice structure by the intercalated Na layer (e.g. see ’s and ’s in Table 1) leads to weaker force constants between -Mo, which softens phonon modes. In fact, due to a larger lattice constant of (MoSe2)2Na compared with (MoS2)2Na, the frequencies of phonon modes in (MoSe2)2Na are correspondingly smaller than those of (MoS2)2Na. On the other hand, the aforementioned charge transfer from Na to makes the -Na links be strongly ionic-type, which may suppress the neighbor covalent -Mo bonds as a side effect. The and mode, which are layer and shear breathing modes respectively, are sensitive to the interlayer interaction. Due to the electronegativity difference between S and Se, more (less) charge is transferred from Na to neighboring S (Se), making stronger (weaker) Coulomb attraction between Na monolayer and MoS2 (MoSe2) layers. Thus, the changes of and modes in Na(MoSe2)2 are analogous to the trilaminar MoSe2 case,Chen et al. (2015) i.e. is softening and is stiffening. In contrast, the strong Coulomb attraction between Na monolayer and MoS2 layer moves these two modes toward opposite directions, i.e. is blue shifted and is red shifted, similar to the Li-intercalated MoS2 case.Huang et al. (2016)
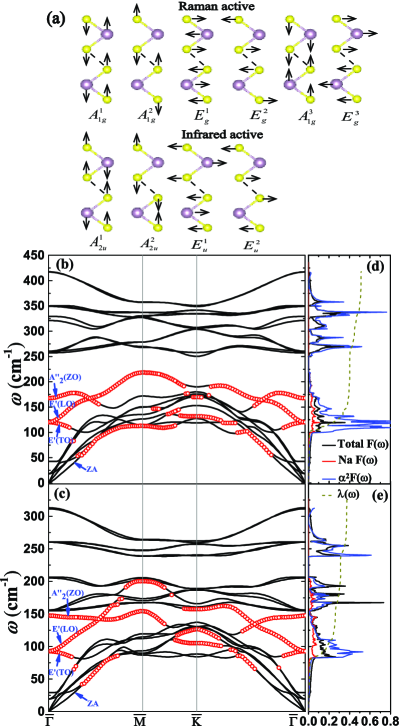
The calculated phonon dispersions along major high symmetry lines and phonon densities of states (PDOS, ()) for (Mo)2Na are shown in Fig. 4(b-e). No imaginary frequency exists in the full phonon spectra, indicating the dynamical stability of the calculated structures of (Mo)2Na. Since Na’s vibration modes own the identical symmetry to these -Mo- ones, the phonon eigenvectors have a strongly mixed character of Na atom and Mo triatomic layer, as indicated in Fig. 4(b-c). It is clear that the vibrations contributed by Na are in the intermediate- and low-frequency region, as well as the out-of-plane acoustic mode (ZA). Generally, the acoustic modes and the layer-breathing modes for opposite vibrations of two triatomic layers are in the low-frequency range and the sandwich -Mo- bond-stretching modes are in the high-frequency range due to the strong covalent bonding.Huang et al. (2015) As shown in Fig. 4(b), two interlayer-shear modes [(TO): optical in-plane transverse mode, (LO): optical in-plane longitudinal mode] and one interlayer-breathing mode [(ZO): optical out-plane mode] are highly mixed with the Na layer’s contribution, especially for the (LO) mode. And due to the moderate Coulomb attraction between Na and neighboring ions, these (TO), (LO), and (ZO) modes situate in the intermediate frequency region.
In the following, the EP interaction is estimated. According to the Migdal-Eliashberg theory, the Eliashberg spectral function [] is given by:Grimvall (1981)
| (1) | |||||
where is the electronic DOS at Fermi level; is the EP matrix element which can be determined self-consistently by the linear response theory. The EP coupling coefficient is obtained by evaluating:Allen and Cohen (1969)
| (2) |
The calculated coefficents are summarized in Table 3 and the Eliashberg functions for (Mo)2Na are shown in Fig. 4(c-d). The similarity between and indicates that all vibration modes contribute to the EP interaction. However, those high-frequency phonons do not contribute much to the strength of electron-phonon interaction due to the weighting of in the definition of (see Eq. 2).
According to Fig. 4(d-e), it’s obvious that (TO), (LO), and (ZO) modes in (Mo)2Na make great contribution to by increasing curve peak in the low frequency region. As summarized in Table 3, is larger in (MoS2)2Na than in (MoSe2)2Na. The physical reasons are: 1) Larger DOS value at the Fermi level in (MoS2)2Na; 2) The contribution from (TO), (LO), and (ZO) modes are stronger in (MoS2)2Na.
| (MoS2)2Na | ||||
|---|---|---|---|---|
| (MoSe2)2Na |
The superconducting can be estimated using the Allen-Dynes modified McMillan equation:Allen and Dynes (1975)
| (3) |
where is the Coulomb repulsion parameter and is the logarithmically averaged frequency. When taking a typical value , the calculated is K for (MoS2)2Na, which is very close to the measured values (about - K) for Na-doped MoS2 bulk.Woollam and Somoano (1976) However, the obtained ( K) for (MoS2)2Na is very low.
The substrate strain from lattice mismatch is a widely used method to tune the physical properties of 2D materials, e.g. zero-field quantum Hall effect in graphene.Guinea et al. (2010) Then it is interesting to study the lattice mismatch effect to the superconducting of Na-intercalated Mo.
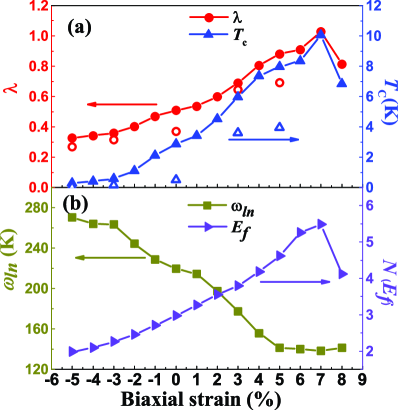
The biaxial strain () is imposed to simulate the lattice mismatch and the results are shown in Fig. 5. Interestingly, for (MoS2)2Na with increasing tensile strain, continuously increases to a maximum value K at , beyond which turns to decrease. In contrast, the compressive strain can suppress monotonously, e.g. to K when biaxial strain down to .
Physically, a tensile strain suppresses the bilayer thickness and thus shortens the distance between Na and S1, which can result in more electron transfer from Na to S1 and improve the DOS at the Fermi level (as shown in Fig. 5(b)). In addition, tensile strain also leads to stronger electron-phonon interaction by softening the (TO), (LO), and (ZO) modes. Similar conclusion is also reached in (MoSe2)2Na whose is enhanced up to K for biaxial tensile strain but suppressed to near zero for compressive strain.
Previous studies suggested that in general the superconducting of 2D materials could be improved by increasing doping density.Xue et al. (2012); Ge and Liu (2013); Huang et al. (2015) Our calculation gives one more route to improve effectively and easily.
III.3 Phonon mean free path
Finally, in order to deeply understand the lattice dynamics of Na-intercalated Mo, the phonon mean free path (MFP) is also investigated, which now can be directly measured in experiments.Minnich et al. (2011) The phonon MFP for the mode at point with polarization is defined as , where is the phonon group velocity and is phonon relaxation time. In real materials, the phonon relaxation time is determined by the combination of electron-phonon, phonon-phonon umklapp scattering, and boundary scattering. For few-layer 2D materials, the boundary scattering from the sides should be very weak and negligible.Wang and Mingo (2011) For simplify, a uniform lifetime () is assumed for all phonon modes’ contributions to the electron-phonon scattering, and the Debye spectrum is adopted as the phonon density of state approximatively Souvatzis (2011). Then, can be approximated as:Souvatzis (2011)
| (4) |
where is the Debye frequency. Corresponding the can be integrated as:
| (5) |
Then using the value of calculated before, the effective can be estimated, as presented in Table 4.
The three-phonon umklapp scattering lifetimes () for different phonon branches can be estimated as:Klemens (2000, 2001)
| (6) |
where is the mass of a (Mo)2Na unit cell, is the average phonon velocity for a given branch, is temperature, is the Boltzmann constant, and is the Grüneissen parameter. For 2D materials, the of each phonon mode at point with polarization is given by:Zou and Balandin (2001); Mounet and Marzari (2005)
| (7) |
| (cm-1) | (ps) | (ps) | MPF (nm) | |
|---|---|---|---|---|
| (MoS2)2Na | (TA) | (TA) | ||
| 236.8 (LA) | (LA) | |||
| (MoSe2)2Na | (TA) | (TA) | ||
| (LA) | (LA) |
Since the acoustic modes (particularly the LA and TA modes) have relatively larger velocities around the point than those of the optical modes, they contribute to most of .Ong and Pop (2011) Here is averaged around point. The calculated MFP’s of acoustic modes around the point are listed in Table 4. The phonon-phonon umklapp scattering makes about contributions to MFP for (Mo)2Na. The anharmonic terms in lattice vibration have great influences on MFP and mainly reflect in here. Generally, larger leads to smaller MFP. For (MoS2)2Na, we obtain for TA and LA modes are and respectively, while in (MoSe2)2Na are only and respectively. The stronger anharmonicity in (MoS2)2Na leads to smaller MFP. Therefore, the MFP’s ( nm for the TA branch, nm for the LA branch) in (MoSe2)2Na is quite prominent, approaching that of graphene (about nm).Ghosh et al. (2008) Even for (MoS2)2Na, the MFP’s ( nm for the TA branch and nm for the LA branch) are larger than those of monolayer MoS2 (about nm for the LA branch calculated using the same method). While in Ref. Cai et al., 2014, the MFP for the LA branch was reported to be only nm for MoS2 monolayer, which was partially due to the inaccuracy in their calculation, as pointed out by Ref. Huang et al., 2014; Sevik, 2014. In short, the Na-intercalation can significantly improve the phonon mean free path of (Mo)2Na, which may be used in heatconduction devices.
IV Conclusion
An in-depth understanding of electronic properties, the lattice dynamical properties, and superconductivity of modificatory 2D materials is highly important for its potential applications in heatconduction devices as well as nanoscale superconductor. The present DFT study found that the Na atoms intercalation can effectively change the electronic properties and lattice dynamical properties of MoS2 and MoSe2.
In summary, electrons transfer from intercalated Na atoms to neighboring Se or S atoms, which increase the density of states at the Fermi level and a semiconducting-to-metallic transition. The superconductivity is expected to be induced by such Na-intercalation, and the superconducting would be enhanced by biaxial tensile strain. In addition, the phonon mean free path at room-temperature is also greatly improved in Na intercalated MoSe2, which is advantaged for related applications.
Acknowledgements.
Work was supported by National Natural Science Foundation of China (Grant Nos. 11274060 and 51322206).References
- Radisavljevic et al. (2011) B. Radisavljevic, A. Radenovic, J. Brivio, V. Giacometti, and A. Kis, Nature Nanotech. 6, 147 (2011).
- Wang et al. (2012) Q. H. Wang, K. Kalantar-Zadeh, A. Kis, J. N. Coleman, and M. S. Strano, Nature Nanotech. 7, 699 (2012).
- Sim et al. (2013) S. Sim, J. Park, J. G. Song, C. In, Y. S. Lee, H. Kim, and H. Choi, Phys. Rev. B 88, 075434 (2013).
- Shi et al. (2013) H. Shi, R. Yan, S. Bertolazzi, J. Brivio, B. Gao, A. Kis, D. Jena, G. H. Xing, and L. Huang, ACS Nano 7, 1072 (2013).
- Kaasbjerg et al. (2012) K. Kaasbjerg, K. S. Thygesen, and K. W. Jacobsen, Phys. Rev. B 85, 115317 (2012).
- Kaasbjerg et al. (2013) K. Kaasbjerg, K. S. Thygesen, and A. P. Jauho, Phys. Rev. B 87, 235312 (2013).
- Verble and Wieting (1970) J. L. Verble and T. J. Wieting, Phys. Rev. Lett. 25, 362 (1970).
- Lee et al. (2015) K. Lee, W. S. Yun, and J. D. Lee, Phys. Rev. B 91, 125420 (2015).
- Huang et al. (2013) Z. Y. Huang, G. L. Hao, C. Y. He, H. Yang, L. Xue, X. Qi, X. Y. Peng, and J. X. Zhong, J. Appl. Phys. 114, 083706 (2013).
- Ge and Liu (2013) Y. Z. Ge and A. Y. Liu, Phys. Rev. B 87, 241408 (2013).
- Woollam and Somoano (1976) J. A. Woollam and R. B. Somoano, Phys. Rev. B 13, 3843 (1976).
- Huang et al. (2016) G. Q. Huang, Z. W. Xing, and D. Y. Xing, Phys. Rev. B 93, 104511 (2016).
- Giannozzi et al. (2009) P. Giannozzi, S. Baroni, N. Bonini, M. Calandra, R. Car, C. Cavazzoni, D. Ceresoli, G. L. Chiarotti, M. Cococcioni, and I. D. et al., J. Phys.: Condens. Matter 21, 395502 (2009).
- Grimme (2006) S. Grimme, J. Comput. Chem. 27, 1787 (2006).
- Liu et al. (2012) Q. H. Liu, L. Li, Y. F. Li, Z. X. Gao, Z. F. Chen, and J. Lu, J. Phys. Chem. C 116, 21556 (2012).
- Böker et al. (2001) T. Böker, R. Severin, A. Müller, C. Janowitz, R. Manzke, D. Voss, P. Krüger, A. Mazur, and J. Pollmann, Phys. Rev. B 64, 235305 (2001).
- Kulikov et al. (1992) L. M. Kulikov, A. A. S. Kobzar, L. G. Akselrud, T. A. Lobova, and E. A. Bogachev, Inorg. Mater. 28, 397 (1992).
- Komesu et al. (2014) T. Komesu, D. Le, X. Zhang, Q. Ma, E. F. Schwier, Y. Kojima, M. Zheng, H. Iwasawa, K. Shimada, M. Taniguchi, L. Bartels, T. S. Rahman, and P. A. Dowben, Appl. Phys. Lett. 105, 241602 (2014).
- Chen et al. (2015) S.-Y. Chen, C. Zheng, M. S. Fuhrer, and J. Yan, Nano Lett. 15, 2526 (2015).
- Huang et al. (2015) G. Q. Huang, Z. W. Xing, and D. Y. Xing, Appl. Phys. Lett. 106, 113107 (2015).
- Grimvall (1981) G. Grimvall, The electron-phonon interaction in metals, Vol. 8 (North-Holland Amsterdam, 1981).
- Allen and Cohen (1969) P. B. Allen and M. L. Cohen, Phys. Rev. 187, 525 (1969).
- Allen and Dynes (1975) P. B. Allen and R. C. Dynes, Phys. Rev. B 12, 905 (1975).
- Guinea et al. (2010) F. Guinea, M. Katsnelson, and A. Geim, Nature Phys. 6, 30 (2010).
- Xue et al. (2012) M. Q. Xue, G. F. Chen, H. X. Yang, Y. H. Zhu, D. M. Wang, J. B. He, and T. B. Cao, J. Am. Chem. Soc. 134, 6536 (2012).
- Minnich et al. (2011) A. J. Minnich, J. A. Johnson, A. J. Schmidt, K. Esfarjani, M. S. Dresselhaus, K. A. Nelson, and G. Chen, Phys. Rev. Lett. 107, 095901 (2011).
- Wang and Mingo (2011) Z. Wang and N. Mingo, Appl. Phys. Lett. 99, 101903 (2011).
- Souvatzis (2011) P. Souvatzis, J. Phys.: Condens. Matter 23, 445401 (2011).
- Klemens (2000) P. G. Klemens, Journal of Wide Bandgap Materials 7, 332 (2000).
- Klemens (2001) P. G. Klemens, Int. J. Thermophys. 22, 265 (2001).
- Zou and Balandin (2001) J. Zou and A. Balandin, J. Appl. Phys. 89, 2932 (2001).
- Mounet and Marzari (2005) N. Mounet and N. Marzari, Phys. Rev. B 71, 205214 (2005).
- Ong and Pop (2011) Z. Y. Ong and E. Pop, Phys. Rev. B 84, 075471 (2011).
- Ghosh et al. (2008) S. Ghosh, I. Calizo, D. Teweldebrhan, E. P. Pokatilov, D. L. Nika, A. A. Balandin, F. M. W. Bao, and C. N. Lau, Appl. Phys. Lett. 92, 151911 (2008).
- Cai et al. (2014) Y. Q. Cai, J. H. Lan, G. Zhang, and Y. W. Zhang, Phys. Rev. B 89, 035438 (2014).
- Huang et al. (2014) L. F. Huang, P. L. Gong, and Z. Zeng, Phys. Rev. B 90, 045409 (2014).
- Sevik (2014) C. Sevik, Phys. Rev. B 89, 035422 (2014).