Phosphorus-bearing molecules in massive dense cores ††thanks: Based on observations carried out with the IRAM-30m Telescope. IRAM is supported by INSU/CNRS (France), MPG (Germany) and IGN (Spain).
Abstract
Phosphorus is a crucial element for the development of life, but so far P-bearing molecules have been detected only in a few astrophysical objects, hence its interstellar chemistry is almost totally unknown. Here we show new detections of phosphorus nitride in a sample of dense cores in different evolutionary stages of the intermediate- and high-mass star formation process: starless, with protostellar objects, and with ultracompact Hii regions. All detected PN line widths are smaller than km s-1, and they arise from regions associated with kinetic temperatures smaller than 100 K. Because the few previous detections reported in the literature are associated with warmer and more turbulent sources, the results of this work show that PN can arise from relatively quiescent and cold gas. This information is challenging for theoretical models that invoke either high desorption temperatures or grain sputtering from shocks to release phosphorus into the gas phase. Derived column densities are of the order of cm-2, marginally lower than the values derived in the few high-mass star forming regions detected so far. New constraints on the abundance of phosphorus monoxide, the fundamental unit of biologically relevant molecules, are also given.
1 Introduction
Phosphorus is an important element for the development of life in the Universe. It is one of the crucial components of nucleic acids, phospholipids, and the adenosine triphosphate (ATP) molecule, from which all forms of life assume energy (e.g. Pasek & Lauretta 2005). Despite this great relevance for biotic and pre-biotic chemistry, little is known about the phosphorus gas phase chemistry, and few measurements of its chemical compounds in the interstellar medium have been obtained so far.
Phosphorus is thought to be synthesized in massive stars and injected into the interstellar medium via supernova explosions (Koo et al. 2013, Roederer et al. 2014). It has a low cosmic abundance relative to hydrogen (, Grevesse & Sauval 1998) lower than that of iron, magnesium, sodium, calcium, and aluminium, and it is thought to be depleted in the dense and cold interstellar medium by a factor (e.g. Wakelam & Herbst 2008). Because P is essentially undepleted in the diffuse clouds (Lebouteiller et al. 2006), depletion of P should be due to freeze-out onto the icy mantles of dust grains, and its desorption mechanisms should be similar to those of all the other icy mantle components. Among the phosphorus-bearing molecules, the phosphorus nitride (PN) is the first one detected in the interstellar medium towards three high-mass star forming regions: Orion (KL), Sgr B2, and W51, in which the measured abundances are , larger than theoretically expected from a pure low-temperature ion-molecule chemical network (Turner & Bally 1987, Ziurys 1987). Since then, it has been detected in few other high-mass dense cores (Turner et al. 1990), as well as in the circumstellar material of carbon- and oxygen-rich stars (e.g. Milam et al. 2008, De Beck et al. 2013) and tentatively in protostellar shocks (Yamaguchi 2011). Other phosphorus-bearing molecules (e.g. PO, CP, HCP, PH3) were detected in evolved stars (Tenenbaum et al. 2007, De Beck et al. 2013, Agúndez et al. 2014), but never in dense star-forming cores so far. Due to this lack of observational constraints, the chemistry of phosphorus in the interstellar medium is basically still unknown.
The few theoretical works focussed so far on the chemistry of interstellar phosphorus disagree in the prediction of the abundances of the main P-bearing molecules. Charnley & Millar (1994) indicate that PO, the fundamental bond unit of many relevant biological molecules (Maciá et al. 1997), should have abundances similar to PN in hot molecular cores (up to yrs), while other molecules (e.g. CP, HCP) would require formation timescales longer than the lifetime of hot cores, and hence should not be detectable in these environments. On the other hand, the theoretical predictions by Millar et al. (1987) and Adams et al. (1990) suggest that PN should be more abundant than PO by about two orders of magnitude, while Thorne et al. (1984) propose PO as the most abundant P-containing molecule based on modelling and laboratory experiments. Therefore, the various models predict different relative abundances of even the simplest molecules. Only observations, by testing and constraining the competing models, can advance the discussion.
In this work, we report on several new detections of PN in dense star-forming cores where intermediate- and high-mass star formation is on-going. Moreover, new upper limits on the abundance of PO are given. We present the observations in Sect. 2. Most of the targets belong to the sample of Fontani et al. (2011, hereafter F+11), who selected their objects based on these criteria: (i) cores relatively nearby (distance kpc) not blended with others; (ii) cores in different evolutionary stages: starless cores without signs of embedded star formation activity (HMSCs), protostellar objects (HMPOs), and ultracompact Hii regions (UCHIIs). The results are described in Sect. 3 and discussed in Sect. 4.
2 IRAM-30m telescope observations
Run-1: the PN (2–1) line, with a rest frequency of 93979.78 MHz, was observed towards the sources listed in Table 1 as part of the observations published in Fontani et al. (2015a) and Fontani et al. (2015b). A detailed description of this observing run is given in Sect. 2 of Fontani et al. (2015a). The main observational parameters are summarised in Table 2.
Run-2: several transitions of the PO molecule were observed in between 152656.98 and 152888.13 GHz from the 5th to the 9th of June, 2015. The ones expected to be the brightest are reported in Table 2. Calibration was performed following the chopper wheel technique (see Kutner & Ulich 1981), with a calibration uncertainty of up to . The spectra were obtained in antenna temperature units, , and then converted to main beam brightness temperature, , via the relation (where ). The observations have been taken in wobbler-switching mode. Pointing was checked every hour on nearby quasars or bright Hii regions. Focus was checked at the beginning of each observing run and at sunrise, either on Saturn or on a nearby strong quasar. The atmospheric conditions were very stable during the whole observing shift, with a precipitable water vapour always in between and mm.
For both runs, the main spectral and technical parameters are listed in Table 2. The spectral parameters (rest frequency, Einstein coefficient, energy of the upper level) are taken from the Jet Propulsory Laboratory catalog (Pickett et al. 1998). All calibrated spectra were analyzed using the GILDAS111The GILDAS software is available at http://www.iram.fr/ IRAMFR/GILDAS software developed at the IRAM and the Observatoire de Grenoble, and MADCUBAIJ 222Madrid Data Cube Analysis on ImageJ is a software to visualize and analyze astronomical single spectra and datacubes (Martín-Pintado et al., in prep.)., developed at the Center of Astrobiology (Madrid, INTA-CSIC).
3 Results
3.1 PN
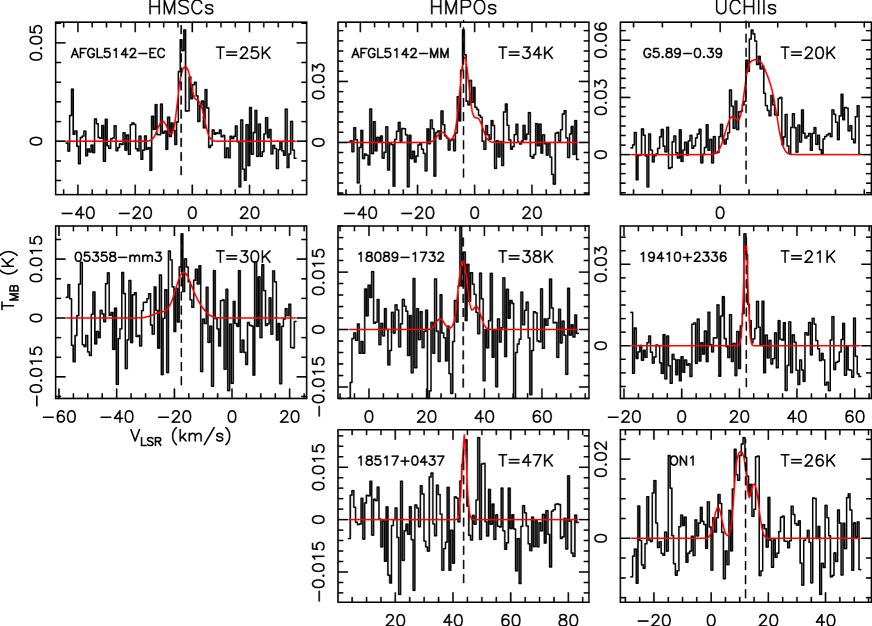
In the sample of F+11 we have detected the PN (2–1) transition in two HMSCs, three HMPOs, and three UCHIIs. The two HMSCs are both defined as ”warm” cores by F+11, based on their kinetic temperature larger than 20 K. These cores do not reveal signs of internal protostellar activity, but are located close to protostellar objects that can affect the gas temperature, and hence the gas chemistry (see F+11 for details). Moreover, the line detected towards the starless core AFGL5142–EC is likely contaminated by the emission coming from the nearby protostellar core AFGL5142–mm, given the large beam size (′′). The situation is different for the starless core 05358–mm3, because the emission can be contaminated by the nearby HMPO 05358–mm1, but this latter is undetected, thus we are confident that in the spectrum of 05358–mm3, the emission from the starless core is dominant. In Fig. 1 we show the PN (2–1) spectra of the eight detected sources. The detections have been checked with the code MADCUBAIJ. The code provides synthetic spectra under Local Thermodynamic Equilibrium (LTE) conditions, taking into account the opacity of the lines. Thus, MADCUBAIJ was used both to confirm the detections, and to complement the analysis performed with CLASS (see below). All the detected lines are consistent with the synthetic spectra produced assuming the temperatures and column densities of the sources. Moreover, we have carefully inspected the presence of possible lines overlapping with PN (2–1) in the Cologne Database for Molecular Spectroscopy333http://www.astro.uni-koeln.de/cdms/, and ruled-out any contamination by nearby lines.
The lines of PN possess hyperfine structure due to the electric quadrupole moment of the 14N nucleus (see Cazzoli et al. 2006). The peak velocities and full width at half maximum of the lines have been derived from fits that consider this structure. The method has given good results for all sources except 18517+0437 and 19410+2336, for which the lines are too narrow with respect to the velocity resolution, so that the fit to the hyperfine structure provides line parameters with too large uncertainties. For these, the lines have been fit with a single Gaussian. The results are given in Table 1. Derived line widths are usually larger than km s-1. In F+11 all (but one) quiescent starless cores possess of N2H+ smaller than 3 km s-1, while all UCHIIs (but one) have km s-1. Because the UCHII regions are the sources in which shocks should have the most significant influence on the kinematics, measured of PN are consistent with the idea that phosphorus needs a shock to be released from the dust grains and injected in the gas. However, in the two objects that have been fit with a single Gaussian (e.g. 18517+0437, 19410+2336) we have found relatively narrow lines ( km s-1). Moreover, for these lines the simplified approach using a Gaussian gives an upper limit of the intrinsic value. These are the first PN lines with widths narrower than km s-1, indicating that PN is not necessarily associated with shocks and can be found also in relatively quiescent gas. This point will be discussed better in Sect. 4. Peak velocities are consistent within km s-1 with those of N2H+, NH3, and NH2D (F+11, Fontani et al. 2015a), except in G5.89–0.39, indicating that in general PN, N2H+, NH3 and NH2D trace similar material. In G5.89–0.39, the clear velocity difference indicates separate emitting regions to be investigated at higher angular resolution.
The beam-averaged column densities have been derived from the integrated intensities (the sum of the intensities of all channels with signal) of the lines from Eq. (A4) in Caselli et al. (2002), assuming local thermodynamic equilibrium and optically thin conditions. All values are in between 1.6 and 10.4 cm-2, smaller on average than the few previous observations in high-mass star forming cores and dense clouds (i.e. cm-2, Turner et al. 1990). Interestingly, the region NGC7538 was detected in PN (5–4) by Turner et al. (1990) with the NRAO-12m telescope, but it is undetected in the (2–1) line in this work. Note that the beam of NRAO-12m at GHz (rest frequency of PN(5–4)) is very similar to that of our observations. Therefore, beam dilution effects cannot explain the non-detection with the IRAM-30m Telescope. Assuming a core size of 22′′ and a gas temperature of 100 K, they derived a PN column density of 5.8 cm-2. This value is larger than the upper limit derived in this work (2.2 cm-2), in which, however, the assumed is 20 K. Assuming = 100 K and a source size of 22′′, we obtain cm-2, more consistent with the estimate of Turner et al. (1990) within the uncertainties. The integrated areas, the excitation temperatures (), and the corresponding column densities of PN are listed in Table 1. The analysis using MADCUBAIJ provides very similar abundances (see Col. 7 of Table 1), and gives low opacities (0.005), supporting the assumption that the lines are optically thin. This opacity is calculated assuming that the source fills the beam, which is not a good approximation for our sources. However, even assuming a source size of 5′′, a realistic average angular size for our sources (see F+11), the opacities are still below 0.05, perfectly consistent with the assumption of optically thin conditions. Unfortunately, the PN abundance cannot be derived for all objects because data of the thermal dust (sub-)mm continuum emission, from which the H2 column density can be obtained, are still lacking.
Because for optically thin lines cannot be derived directly from the spectrum, we have assumed the gas kinetic temperatures reported in Table A.3 of F+11. All spectral parameters utilised in the derivation of the column densities have been taken from the Jet Propulsion Laboratory (Pickett et al. 1998) catalogue. The assumption of optically thin conditions is consistent with the moderate opacity ( or lower) derived in the sources in which can be computed directly from the measure of the relative intensities of the hyperfine components (for details, see the CLASS manual444https://www.iram.fr/IRAMFR/GILDAS/doc/html/class-html/class.html). In two cases, AFGL5142–EC and ON1, the fit to the hyperfine structure provides , but the uncertainty on is comparable to the value, and this, together with the low optical depth derived with MADCUBAIJ, prevents us to assume optically thick conditions. Therefore, we have decided to conservatively assume optically thin conditions in these two cases as well. For undetected sources, the upper limit on the integrated intensity has been calculated from the rms of the spectrum from the formula , valid for a Gaussian profile with peak temperature equal to the rms.
| source | (PN) | (PN)b | (PO)b | (CN)c | ||||
|---|---|---|---|---|---|---|---|---|
| (km s-1) | (km s-1) | K km s-1 | K | cm-2 | cm-2 | cm-2 | cm-2 | |
| HMSC | ||||||||
| 00117–MM2 | – | 1.6a | 0.032 | 14 | ||||
| AFGL5142–EC | –2.63 | 3.8(0.6) | 0.32(0.02) | 25 | 8.3(0.4) | 5.8 | 4.9(0.3) | |
| 05358–mm3 | –17.52 | 6(2) | 0.11(0.01) | 30 | 2.9(0.4) | 10 | 2.4(0.1) | |
| G034–G2 | – | 1.6a | 0.037 | 16 | ||||
| G034–F2 | – | 1.6a | 0.037 | 16 | ||||
| G034–F1 | – | 1.6a | 0.043 | 16 | ||||
| G028–C1 | – | 1.6a | 0.041 | 17 | ||||
| I20293–WC | – | 1.6a | 0.036 | 17 | ||||
| I22134–G | – | 1.6a | 0.036 | 25 | ||||
| I22134–B | – | 1.6a | 0.036 | 17 | ||||
| HMPO | ||||||||
| 00117–MM1 | – | 2.9a | 0.07 | 20 | ||||
| AFGL5142–MM | –3.66 | 3.7(0.6) | 0.21(0.02) | 34 | 6.9(0.6) | 12 | 4.3(0.2) | |
| 05358–mm1 | – | 2.9a | 0.09 | 39 | ||||
| 18089–1732 | 33.04 | 3(1) | 0.09(0.02) | 38 | 3.3(0.6) | 6.3 | 6.3(0.2) | |
| 18517+0437d | 44.12 | 1.8(0.7)d | 0.05(0.02)d | 47 | 2.0(0.7) | 4.4 | 3.1(0.2) | |
| G75–core | – | 2.9a | 0.07 | 96 | ||||
| I20293–MM1 | – | 2.9a | 0.09 | 37 | ||||
| I21307 | – | 2.9a | 0.07 | 21 | ||||
| I23385 | – | 2.9a | 0.05 | 37 | ||||
| UCHII | ||||||||
| G5.89–0.39 | 12.0 | 5.2(0.8) | 0.5(0.3) | 20 | 10.4(0.8) | 14.5 | 15(4) | |
| 19035–VLA1 | – | 3.5a | 0.15 | 39 | ||||
| 19410+2336d | 22.5 | 1.6(0.4)d | 0.07(0.01)d | 21 | 1.6(0.3) | 3.3 | 10(3) | |
| ON1 | 12.0 | 2.9(0.5) | 0.14(0.01) | 26 | 3.8(0.04) | 9.5 | 5(2) | |
| I22134–VLA1 | – | 3.5a | 0.075 | 47 | ||||
| 23033+5951 | – | 3.5a | 0.15 | 25 | ||||
| NGC7538–IRS9 | – | 3.5a | 0.10 | 20 | ||||
a fixed line width assumed to derive the upper limit on (see Sect. 3.1). The value is the average line width derived from the detected sources for the HMPOs and the UCHIIs, while for the HMSCs we have taken the average line width of the N2D+ (2–1) line (F+11);
b derived from MADCUBAIJ (see Sects. 3.1 and 3.2). Upper limits on PO are given only for the sources detected in PN;
c from Fontani et al. (2015b);
d values derived from Gaussian fits to the lines.
3.2 PO
PO lines are not detected in any source, but we have computed upper limits on the column densities with the code MADCUBAIJ. The upper limits for the integrated intensity have been derived from the formula , where is the number of channels covered by the linewidth v. The upper limits of PO for the objects detected in PN are reported in Table 1. They are slightly higher or of the order of the PN column densities. Although for PO we only have upper limits, our findings are not against the results found in the evolved oxygen-rich stars VY CMa (Tenenbaum et al. 2007) and IK Tau (De Beck et al. 2013), detected in both PN and PO, in which their abundances are of the same order of magnitude as well.
| molecular line | line rest frequency | HPBW | |||||
| (GHz) | (K) | (′′) | (km s-1) | K | |||
| PN J=2–1 | 93.97978 | 6.8 | 0.62 | 0.84 | |||
| PO J=7/2-5/2 ,F=4-3,l=e | 152.65698 | 15.7 | 16 | 0.096 | 0.65/0.93 | ||
| PO J=7/2-5/2 ,F=3-2,l=e | 152.68028 | 15.7 | 16 | 0.096 | 0.65/0.93 | ||
| PO J=7/2-5/2 ,F=4-3,l=f | 152.85545 | 15.7 | 16 | 0.096 | 0.65/0.93 | ||
| PO J=7/2-5/2 ,F=3-2,l=f | 152.88813 | 15.7 | 16 | 0.096 | 0.65/0.93 |
a Total spectral window covered by the FTS correlator.
4 Discussion and conclusions
Before this work, PN was detected in six hot ( K) and turbulent ( km s-1) high-mass star forming cores (Turner & Bally 1987, Ziurys 1987, Turner et al. 1990). In this work we have detected eight regions with line widths narrower than 6 km s-1, and temperatures in the range K, which suggests that PN can also be formed in relatively cold and quiescent material. The comparison between our new detections and the previous ones are shown in Fig. 2. These results are challenging for chemical models that explain the formation of PN via thermal desorption of PH3 from grain mantles at temperature above K (Charnley & Millar 1994, solid vertical line in Fig. 2), followed by rapid gas phase reactions ( yrs) which transform it into PN, PO, or atomic P. They also disagree with previous observations that claimed high depletion of P (depletion factors of ) in dense star forming cores, suggesting violent mechanisms like grain disruption to have a significant amount of phosphorus in the gas phase (Turner & Bally 1987). In fact, as shown in Sect. 3.1, some lines are narrower than km s-1, hence the non-thermal motions are very likely not dominated by shocks (Fig. 2). A lower sublimation temperature of PN ( K) has been claimed (see e.g. Garrod & Herbst 2006), which however is still higher than the kinetic temperature measured in many sources detected in this work (see Fig. 2).
We have not found any (anti-)correlation between line parameters and other core properties (kinetic temperature, line widths of other molecules, deuterium fractionation), except for a correlation between line width of PN and kinetic temperatures (Fig. 2), which was expected since the warmer cores are typically more turbulent. Interestingly, the PN line widths in HMSCs are larger than those measured in CN (Fontani et al. 2015b), suggesting different emitting regions, but any interpretation cannot be supported without high angular resolution maps of both PN and CN.
To model the abundance ratios, we utilized chemical model based on Vasyunin & Herbst 2013). We adopted ”low metals” initial chemical composition (EA1, Table 1 in Wakelam & Herbst 2008) to account for the depletion of elemental phosphorus in cold interstellar medium. The chemical evolution of a cloud was modeled in two stages. First, chemical evolution was calculated for a cold dark clump with density (H2)= cm-3, visual extinction mag, and temperature K for years. After that, gas density and temperature were increased to (H2)= cm-3, and K, correspondingly, and chemical evolution has been followed for another years. The resulting abundance ratios for this time span are showed on Fig. 3, which shows the predictions for CN/PN, CH3OH/PN, N2H+/PN, and HNC/PN.
The column densities of the species aforementioned have been measured in all the sources detected in PN (Fontani et al. 2015a, Fontani et al. 2015b, Fontani et al. 2014). Therefore, we have compared the volume density ratios observed to the values predicted by the models, assuming that the emitting diameter is the same for the different molecules. We find that the average CN/PN ratio is . This has been obtained correcting the beam-averaged N(CN) listed in Table 2 of Fontani et al. (2015b) for the factor to take the different beams into account. With a similar approach, we find an average N2H+/PN, an average CH3OH/PN, and an average HNC/PN of . These latters have been derived from the column densities of N2H+ and CH3OH given in Fontani et al. (2015b), Fontani et al. (2015a), and Fontani et al. (2014), respectively. Inspection of Fig. 3 tells us that the ratios N2H+/PN, CH3OH/PN, and HNC/PN are globally in agreement with the models that assume an age of the objects yrs and K, mainly constrained by CH3OH/PN. On the other hand, the CN/PN ratio cannot be reproduced by any model. A possible explanation can be a significantly different emitting region of the two molecules. In fact, in the observations of Fontani et al. (2015b), the beam is 11′′, but if the CN emission arises from a more extended area, then the column density given by Fontani et al. (2015b) is a lower limit. That CN is likely a tracer of the more extended envelope rather than the densest portions of the sources is consistent with the finding that its abundance increases with the presence of UV photons (e.g. Fuente et al. 1995, Palau et al. 2007). However, to test this scenario, and to better understand the origin of PN in dense star-forming cores, future higher angular resolution observations are absolutely required.


Acknowledgments
The authors are grateful to the IRAM staff for its help during the observations of the IRAM-30m data. This work was partly supported by the Italian Ministero dell Istruzione, Universitá e Ricerca through the grant Progetti Premiali 2012 - iALMA. A.P. acknowledges financial support from UNAM-DGAPA-PAPIIT IA102815 grant, México. P.C. and A.V. acknowledge support from the European Research Council.
References
- Adams et al. (1990) Adams N. G., McIntosh B. J., Smith D., 1990, , 232, 443
- Agúndez et al. (2014) Agúndez M., Cernicharo J., Decin L., Encrenaz P., Teyssier D., 2014, ApJ, 790, L27
- Caselli et al. (2002) Caselli, P., Walmsley, C. M.; Zucconi, A.; Tafalla, M.; Dore, L.; Myers, P. C. 2002, ApJ, 565, 344
- Cazzoli et al. (2006) Cazzoli, G., Cludi, L., Puzzarini, C. 2006, J. Mol. Struct. 780, 260
- Charnley & Millar (1994) Charnley S. B., & Millar T. J., 1994, MNRAS, 270, 570
- De Beck et al. (2013) De Beck E., Kaminski T., Patel N. A., Young K. H., Gottlieb C. A., Menten K. M., Decin L., 2013, A&A, 558, 132
- Fontani et al. (2011) Fontani, F., Palau, A., Caselli, P., Sánchez-Monge, A., Butler, M.J., Tan, J.C., Jiménez-Serra, I. et al. 2011, A&A, 529, L7
- Fontani et al. (2015a) Fontani, F., Busquet, G., Palau, Aina, Caselli, P., Sánchez-Monge, A., Tan, J. C., Audard, M. 2015a, A&A, 575, 87
- Fontani et al. (2015b) Fontani, F., Caselli, P., Palau, A., Bizzocchi, L., Ceccarelli, C. 2015b, ApJ, 808, L46
- Fontani et al. (2014) Fontani, F., Sakai, T., Furuya, K., Sakai, N., Aikawa, Y., Yamamoto, S. 2014, MNRAS, 440, 448
- Fuente et al. (1995) Fuente, A., Martin-Pintado, J., Gaume, R. 1995, ApJ, 442, L33
- Garrod & Herbst (2006) Garrod, & Herbst, E. 2006, A&A, 457, 927
- Grevesse & Sauval (1998) Grevesse, N., & Sauval, A. J. 1998, Space Sci. Rev., 85, 161
- Koo et al. (2013) Koo B.-C., Lee Y.-H., Moon D.-S., Yoon S.-C., Raymond J. C., 2013, Sci, 342, 1346
- Kutner & Ulich (1981) Kutner, M.L. & Ulich, B.L. 1981, ApJ, 250, 341
- Leboutellier et al. (2006) Leboutellier, V., Kuassivi, Ferlet, R. 2006, ASPC, 348, 480
- Macia et al. (1997) Maciá, E., Hernández, M. V., & Oró, J. 1997, Origins Life Evol. Biosphere, 27, 459
- Milam et al. (2008) Milam, S.N., Halfen, D.T., Tenenbaum, E.D., Apponi, A.J., Woolf, N.J., Ziurys, L.M. 2008, ApJ, 684, 618
- Millar et al. (1987) Millar T. J., Bennett A., Herbst E., 1987, , 229, 41
- Palau et al. (2007) Palau, A., Estalella, R., Girart, J.M., Ho, P.T.P., Zhang, Q., Beuther, H. 2007, A&A, 465, 219
- Pasek & Lauretta (2005) Pasek, M.A., & Lauretta, D.S. 2005, Astrobiology, 5, 515
- Pickett et al. (1998) Pickett, H.M., Poynter, R.L., Cohen, E.A., Delitsky, M.L., Pearson, J.C., Müller, H.S.P. 1998, JQSRT, 60, 883
- Roederer et al. (2014) Roederer I. U., Jacobson H. R., Thanathibodee T., Frebel A., Toller E., 2014, ApJ, 797, 69
- Tenenbaum et al. (2007) Tenenbaum E. D., Woolf N. J. & Ziurys L. M., 2007, ApJ, 666, L29
- Thorne et al. (1984) Thorne L. R., Anicich V. G., Prasad S. S., Huntress, Jr. W. T., 1984, ApJ , 280, 139
- Turner & Bally (1987) Turner, B.E. & Bally, J. 1987, ApJ, 321, L75
- Turner et al. (1990) Turner, B.E., Tsuji, T., Bally, J., Guelin, M., Cernicharo, J. 1990, ApJ, 365, 569
- Vasyunin & Herbst (2013) Vasyunin, A.I. & Herbst, E. 2013, ApJ, 769, 34
- Wakelam & Herbst (2008) Wakelam, V. & Herbst, E. 2008, ApJ, 680, 371
- Yamaguchi et al. (2011) Yamaguchi T., Takano, S., Sakai, N., Sakai, T., et al. 2011, PASJ, 63, L37
- Ziurys (1987) Ziurys, L.M. 1987, ApJ, 321, L81