DESY 16-064
Study of HERA Data at Low and Low and the Need for Higher-Twist Corrections to Standard pQCD Fits
I. Abta, A.M. Cooper-Sarkarb, B. Fosterb,c,d, V. Myronenkod, K. Wichmannd, M. Winge
a Max-Planck-Institut für Physik, Werner-Heisenberg-Institut, München 80805, Germany
b Physics Department, University of Oxford, Oxford OX1 3RH, United Kingdom
c Hamburg University, I. Institute of Experimental Physics, Hamburg 22607, Germany
d Deutsches Elektronen Synchrotron DESY, Hamburg 22607, Germany
e Department of Physics and Astronomy, University College London, London WC1E 6BT, United Kingdom
A detailed comparison of HERA data at low Bjorken- and low four-momentum-transfer squared, , with predictions based on evolution (DGLAP) in perturbative Quantum Chromo Dynamics suggests inadequacies of this framework. The standard DGLAP evolution was augmented by including an additional higher-twist term in the description of the longitudinal structure function, . This additional term, , improves the description of the reduced cross sections significantly. The resulting predictions for suggest that further corrections are required for less than about 2 GeV2.
1 Introduction
Analyses of HERA and other DIS data are generally performed within the perturbative regime of Quantum Chromo Dynamics (QCD), [1] i.e. with , the four-momentum-transfer squared, sufficiently above 1 GeV2. The HERA data extend towards and values, where is the Bjorken scaling variable, where the longitudinal structure function, , becomes significant. Previous HERA results [2, 3] suggest that QCD continues to give a good description of the data down to surprisingly low values of . This gives the possibility of not only establishing the limit below which QCD no longer describes the data, but also of investigating modifications to the standard Dokshitzer–Gribov–Lipatov–Altarelli–Parisi (DGLAP) [4, 5, 6, 7, 8] evolution that have been proposed in the literature, for example resummations, as introduced by Balitsky–Fadin–Kuraev–Lipatov [9], or “saturation”. The key variable is , the fraction of the proton momentum carried by the parton, which is identical to in the quark–parton model. Saturation is expected to occur when the density of gluons becomes so large that the standard increase in gluon density as falls is flattened off by gluon–gluon interactions and recombination. Such effects can be described by non-linear evolution equations including higher-twist corrections at low , visualised as gluon ladders with recombining gluons [10, 11]. An earlier analysis of HERA-I data [12] had shown some discrepancies with conventional DGLAP evolution at low and low . This is now investigated using the final combination of HERA inclusive cross sections.
This combination of HERA reduced cross sections for neutral current (NC) and charged current (CC) scattering measured by the H1 and ZEUS collaborations was recently published [3] together with a QCD analysis based solely on the DGLAP formalism, which produced a set of parton distribution functions (PDFs) called HERAPDF2.0. In this analysis, it was noted that the predictions from the PDFs of HERAPDF2.0 were not able to describe the NC data very well at low , below GeV2, both at NLO and NNLO. This was confirmed within the framework of the NNPDF global analysis [13].
The reduced NC deep inelastic scattering cross sections are given by a linear combination of structure functions which depends on the PDFs. At low , where virtual photon exchange is dominant, the reduced cross sections for scattering are equal and may be expressed in terms of the structure functions and as
| (1) |
where the fine-structure constant, , the photon propagator and a helicity factor are absorbed in the definitions of and . In particular, the predictions of HERAPDF2.0 were not able to describe the turn-over of the NC reduced cross section at low and low due to the contribution from , which is directly connected to the gluon PDF [14].
The analysis presented here focuses on a simple to add higher-twist terms to the DGLAP-based evolution. The expectation is that such terms are important for , but not for the structure function , because in the case of longitudinal and transverse contributions cancel [10]. New sets of PDFs were extracted at next-to-leading order (NLO) and next-to-next-to-leading order (NNLO). These PDFs are labelled the HHT PDFs and the corresponding analyses are called the HHT analyses, for ease of reference. The predictions from these analyses are compared to the reduced HERA cross sections at low and low . The predictions of HHT and HERAPDF2.0 for are compared to measurements published separately by the H1 [15] and ZEUS [16] collaborations.
2 The HERA Data and HERAPDF2.0
The HERA data on neutral current and charged current and inclusive cross sections as combined by the H1 and ZEUS collaborations [3] were used as the input to the analysis presented here. Their kinematic range spans six orders of magnitude in and , but only four orders of magnitude are usable for pQCD fits, for which must be above 1 GeV2. The range in is automatically reduced when low- data are excluded, because, at HERA, low also implies low .
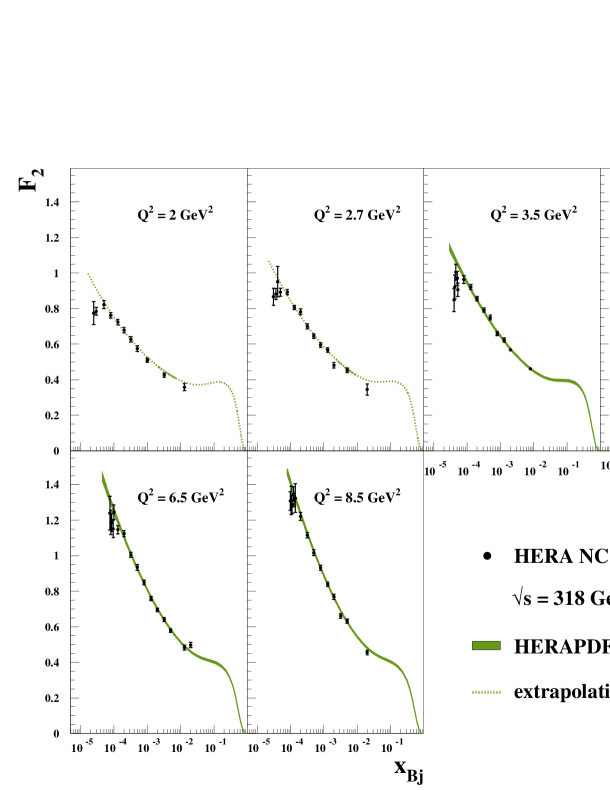
The data were previously used to extract the HERAPDF2.0 [3] set of PDFs. While the description of the data by the predictions of HERAPDF2.0 is quite good, the overall /(number of degrees of freedom, ndof) values of the various fits were around 1.2 [3]. It was observed that these values could be reduced if , the smallest of the data used in the fits, was increased from 3.5 GeV2 to 10 GeV2. However, this substantially worsened the predictions for the low- and low- regime, which were already not particularly good either at NLO or NNLO for the standard fits with GeV2. Neither did NNLO fits show any improvement over NLO ones.
Most of the HERA data were taken with a centre-of-mass energy, , of GeV. However, NC data are available also for lower , such that different values of the inelasticity are accessed at the same and , since . This provides direct information on . Although results on were published separately by the H1 and ZEUS collaborations, the data on which the results were based were combined and were included in the data set used for the HHT analysis.
3 QCD Analysis Including Higher-Twist Effects
The introduction of higher-twist terms is one possible way to extend the DGLAP framework. Higher-twist effects have a dependence and are thus important at low . Such terms have been introduced by previous authors, but usually in the context of higher-twist effects which are important at high [17]. In the present paper we investigate low- higher-twist effects since, for the kinematics of HERA, low is only accessed at low . Motyka et al. [18] have also considered higher-twist effects at low but in the context of diffractive data. In the present study we concentrate on inclusive data. The leading-twist perturbative QCD forms of the structure functions and were augmented by simple twist-4 terms
| (2) | |||||
| (3) |
where and are free parameters in the fits.
The ZEUSfitter package 111The package was recently also used in a combined electroweak and QCD analysis of HERA data [19]. was used for the analysis presented here. The results were cross-checked with the HERAFitter [20] package. Except for the addition of the higher-twist term, the fits called HHT were set up exactly as the HERAPDF2.0 fits. In particular the heavy-flavour scheme used was the RTOPT scheme [21, 22, 23] and the minimum value of for data entering the fit was GeV2. The value of GeV2 was chosen as it was assumed that non-perturbative effects would only appear at below this value. Other groups work with even lower , for example MSTW/MMHT [24, 25] use GeV2. A higher-twist term as introduced in Eq. 3 was tested by MMHT and found to improve the values of their fits [26] to HERA and other data. In the present paper the effects of such a higher-twist term on the predictions for and are explored in more detail, using an analysis focussing on HERA data.
The PDFs for HHT were parameterised at the starting scale GeV2. The gluon PDF, directly connected to , was parameterised as
| (4) |
where and are free parameters and was set to [24]. The was added to make the parametersiation more flexible at low . It could lead to a negative gluon density at low , even at scales above . However, this was neither observed for HERAPDF2.0 nor for the analysis presented here.
The HHT fits were performed at NNLO and NLO, including the higher-twist term for only, only and both and . The uncertainties from the fits are taken as experimental uncertainties and are the only uncertainties considered throughout the paper. The introduction of was found to reduce the /ndof of the fit significantly, both at NLO and at NNLO. However, adding had no significant effect. For the NNLO fit, it only reduced the /ndof from 1363/1131 to 1357/1130 and the corresponding value of was consistent with zero, i.e. GeV2. Similar values for were obtained when and were included simultaneously. Therefore, all HHT fits presented in this paper include only the term. This agrees with predictions [10] that higher-twist terms would be observable in but not in because the contributions from longitudinally and transversely polarised photons would cancel for .
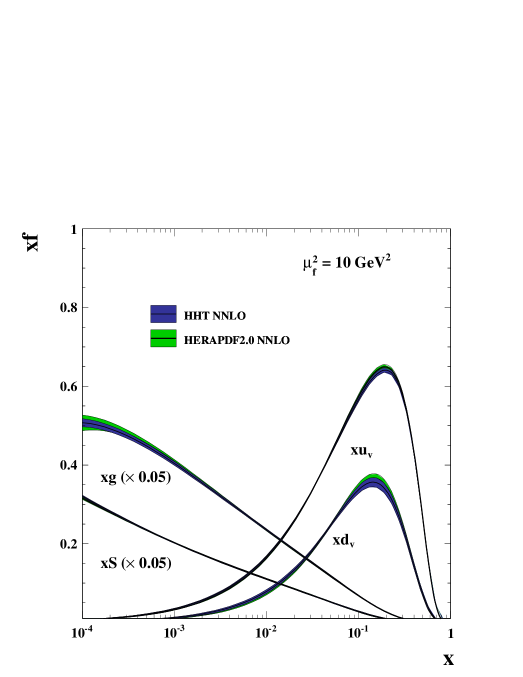
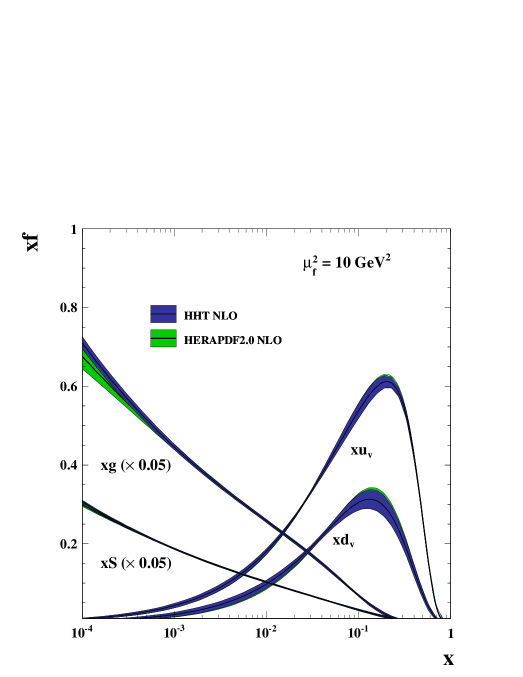
The HHT PDFs, and for the valence quarks and for the sea quarks together with , are shown in Fig. 1. The PDFs of HHT are very similar to the PDFs of HERAPDF2.0, even though the values of extracted are quite high: GeV2 from the NNLO and GeV2 from the NLO fit. The PDFs of HHT remain very similar to those of HERAPDF2.0 when they are evolved in up to the scale of the LHC, across the kinematic reach of of the ATLAS, CMS and LHCb experiments. Thus the need for higher-twist terms at low has no effect on LHC physics.
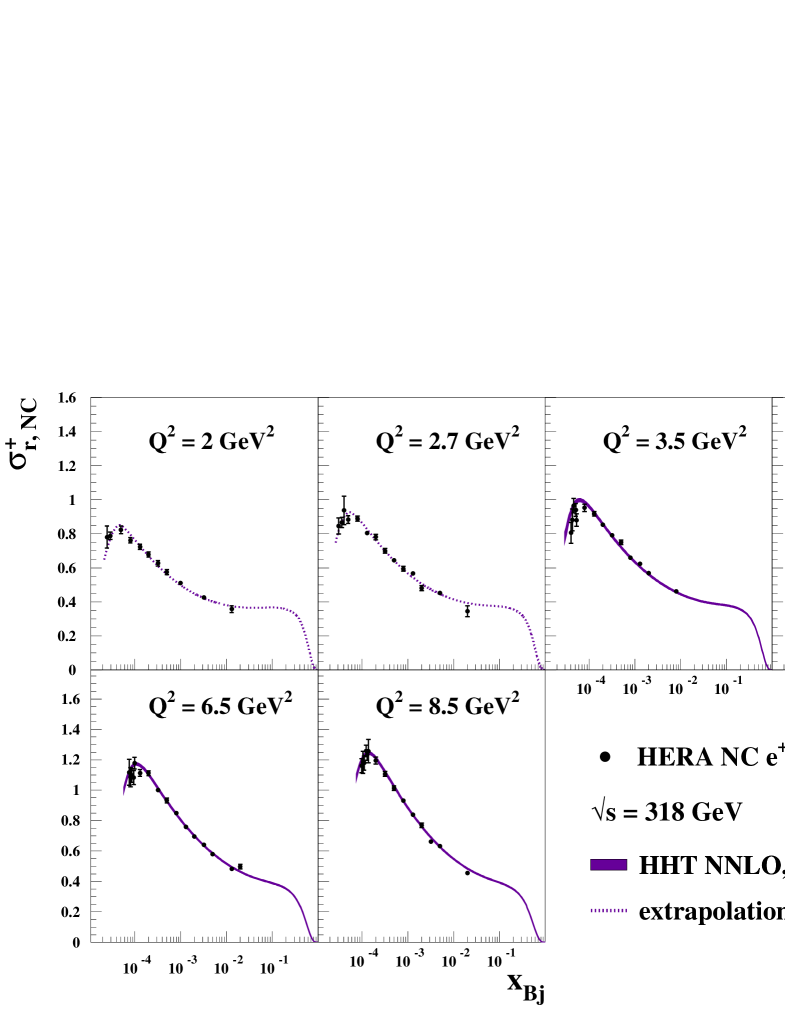
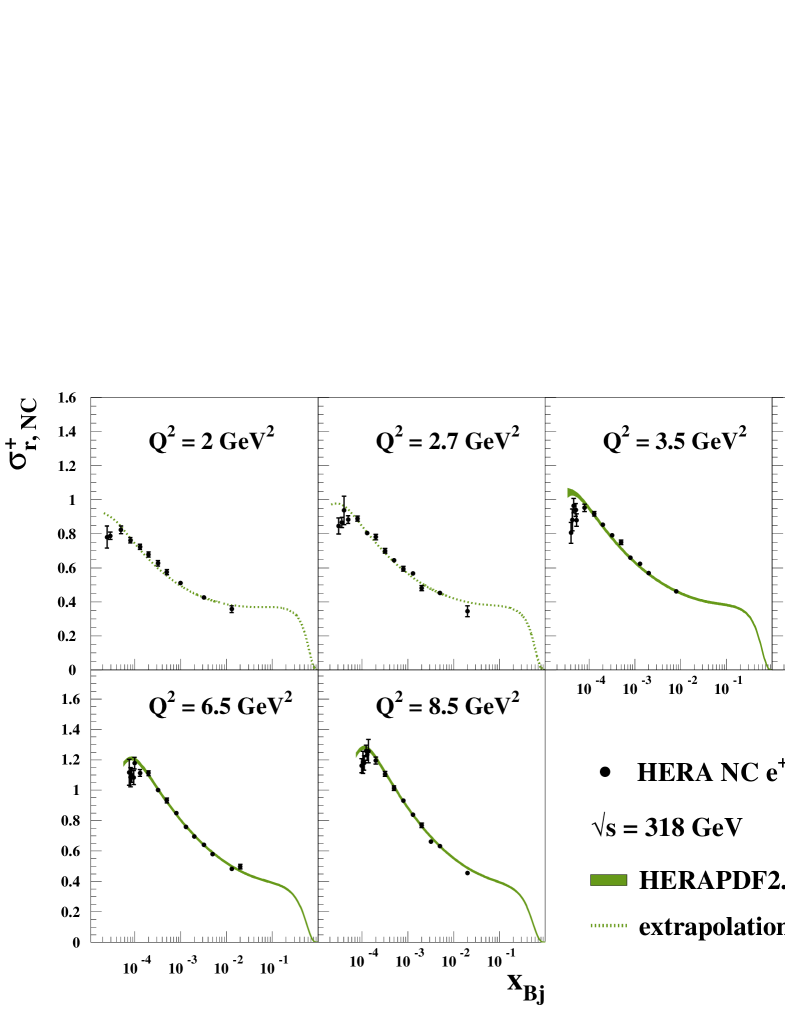
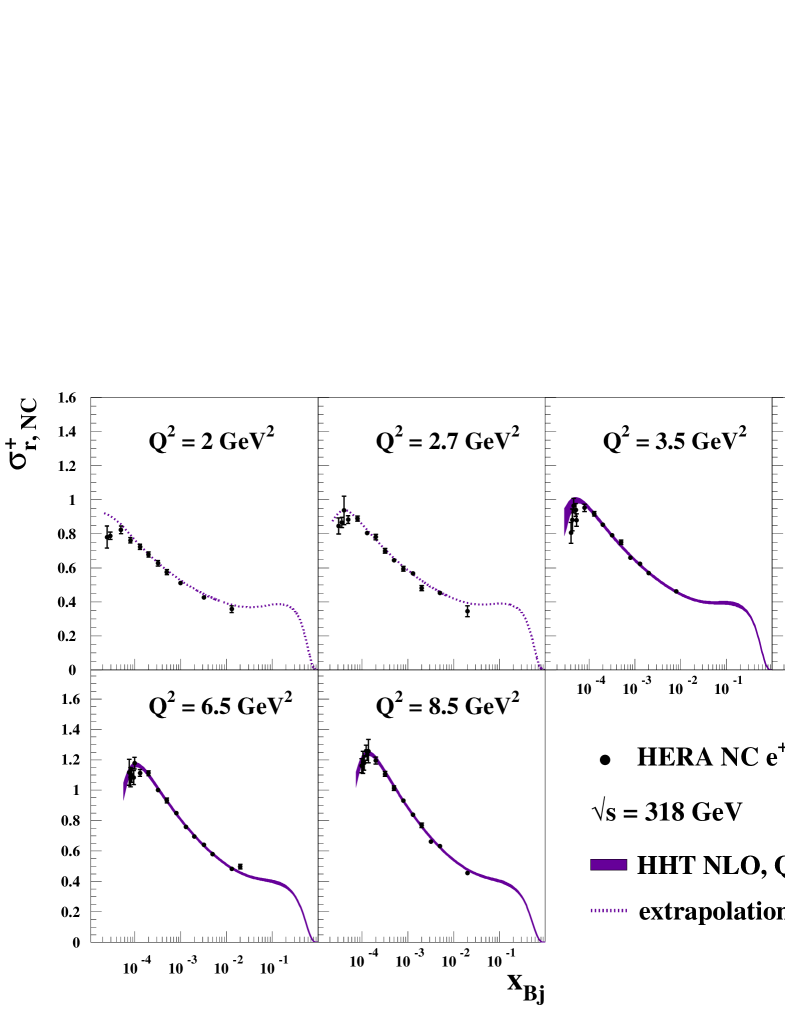
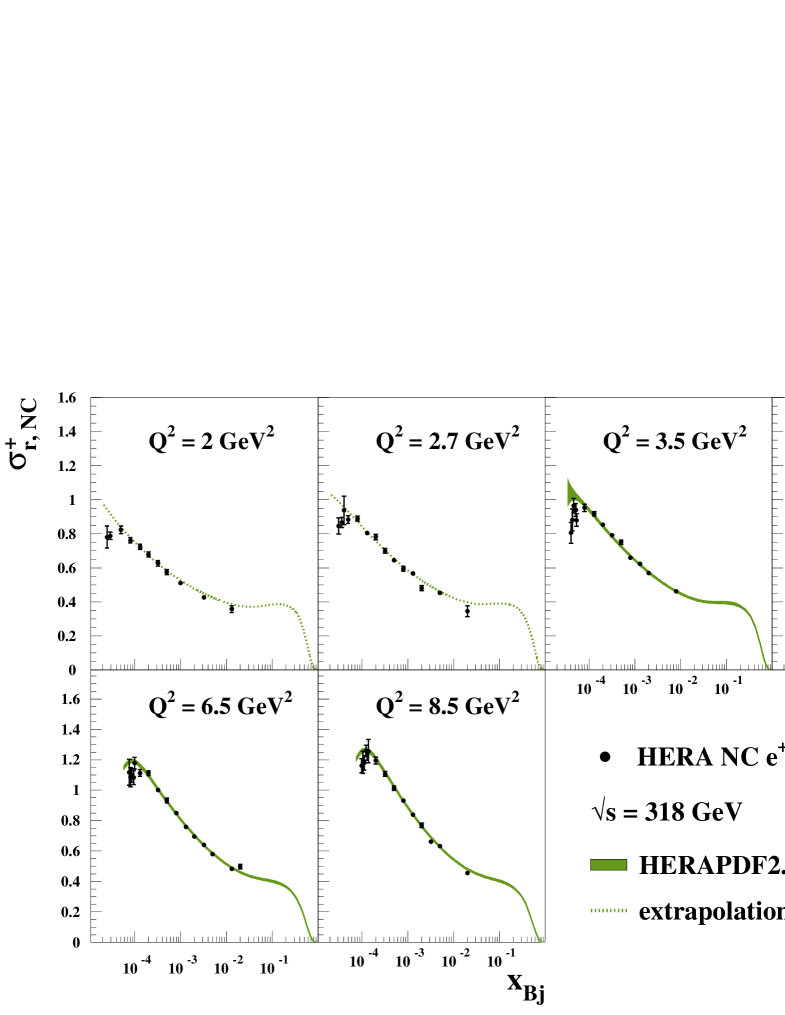
The /ndof for HHT NNLO is and for HHT NLO . This may be compared to the HERAPDF2.0 /ndof values of for the NNLO and for the NLO fit. This represents an improvement of for NLO and an even more significant at NNLO. Table 1 details the main contributions to this reduction of . The HHT fit at NNLO has a lower than the fit at NLO. This is a reversal of the situation for HERAPDF2.0. Table 1 also lists the partial /ndp values for the high-precision NC data with GeV2. In addition, the /ndp values for the data points below GeV2 down to 2.0 GeV2 are listed. These values provide an evaluation of the quality of the predictions below and quantify that the extrapolation of HHT NNLO describes these data better than the extrapolation of HERAPDF2.0, while the description at NLO does not improve.
The positive higher-twist terms preferred by the HHT fits imply that is larger than determined in the HERAPDF2.0 fits. Since the structure function is directly related to the gluon distribution at low , at , it might be expected that a larger implies at larger low- gluon. However, this ignores the role of higher-order matrix elements. In fact, the NNLO gluon distribution exhibits a turn-over at low and . This comes from the substantial term which the HHT NNLO fit requires even in the presence of the large higher-twist term. To investigate this a gluon parameterisation of the form was also tested at both NLO and NNLO. This form is called the alternative gluon or AG form of the parametrisation and it ensures that the gluon distribution is always positive definite for . The AG fits and the fits using the form of Eq. 4 are very similar at NLO. In contrast, the AG parameterisation at NNLO results in much higher /ndof values, 1389/1133 for HERAPDF2.0 and 1350/1132 for HHT. At NNLO the data favour a strong gluon turn-over whereas AG, by construction, does not allow this. The AG parameterisation is clearly not suited for fits at NNLO.
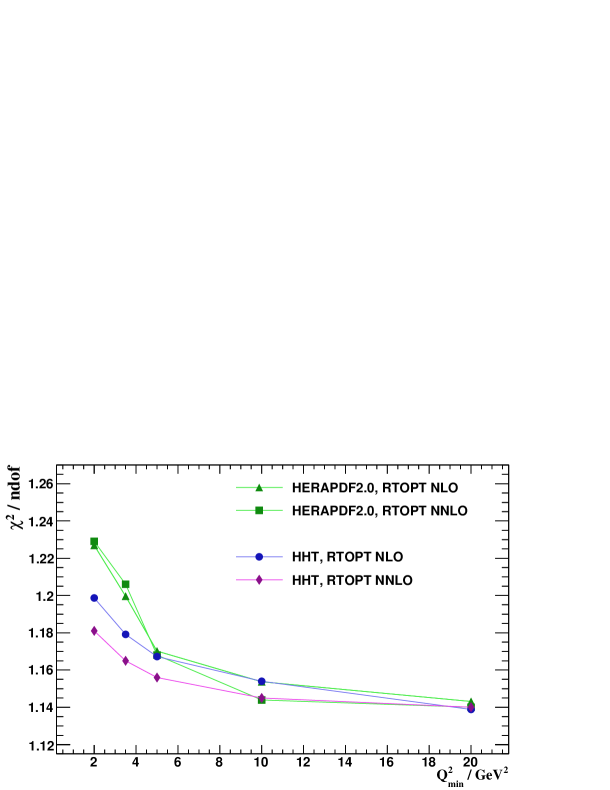
The validity of the assumption that perturbation theory is applicable in the kinematic regime of the fits is tested by the dependence of the quality of the fits, as represented by /ndof, on the value of . The value of /ndof should ideally not depend strongly on . The dependence of ndof on for HHT and HERAPDF2.0 is shown in Fig. 2 for both NNLO and NLO. The values drop steadily until GeV2, when the /ndof becomes similar for HHT and HERAPDF2.0. The effect of the higher-twist term is, as expected, confined to the low- region. The HHT fits show a slower rise in as is reduced.
The fits with GeV2 close to the starting scale GeV2 were studied in more detail. The relevant values are listed in Table 2. The PDF and especially the higher-twist parameters of HHT NNLO do not change much when is lowered from 3.5 GeV2 to 2.0 GeV2. The partial /ndp for the NC data with GeV increases from 1.12 to 1.14, but the partial /ndp drops from 1.28 to 1.04 for the 25 points in the range GeV2.
Refitting with lower has a stronger effect at NLO than at NNLO, but again, the higher-twist term is basically unchanged. The results at NLO are, as before, not strongly dependent on the details of the gluon distribution. This can be seen when refitting with HHT NLO AG, which yields almost the same result as HHT NLO.
4 Heavy-Flavour Schemes
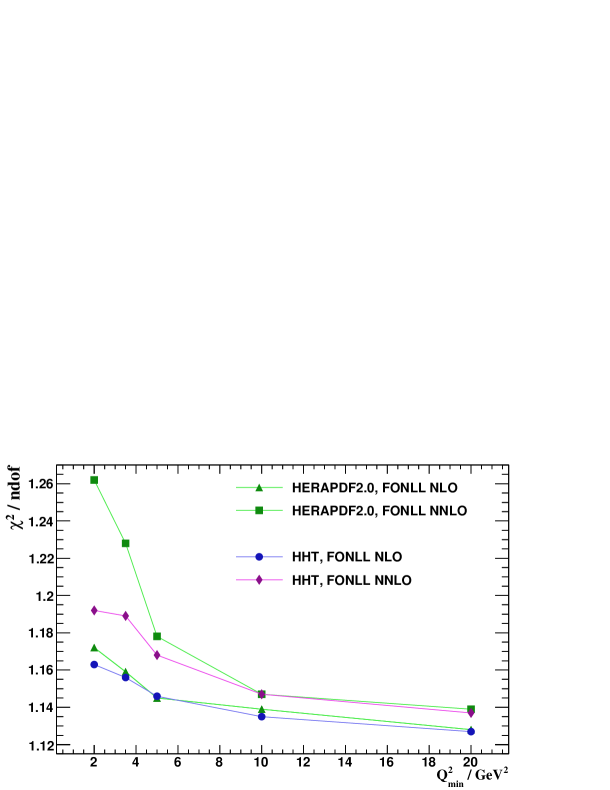
The influence of the heavy-flavour scheme was already discussed in the context of HERAPDF2.0 [3]. To study the effect on this analysis, the HERAFitter [20] package was used to replace the default RTOPT scheme with the fixed-order plus next-to-leading logarithms (FONLL) scheme [27, 28]. The resulting dependence of on is shown in Fig. 3, together with the values from the standard fits.
In the FONLL scheme, the HHT NNLO fit has a substantially improved /ndof for low compared to HERAPDF2.0, just as for the standard HHT NNLO fit with RTOPT. The value of the higher-twist parameter GeV2 is also similar. However, the HHT NLO FONLL fit has only a marginally improved /ndof for low as compared to HERAPDF2.0 and a small value of , i.e. GeV2. This is probably associated with the order of at which is evaluated in these different heavy-flavour schemes. RTOPT at NLO calculates to and RTOPT at NNLO calculates to . FONLL at NLO calculates to and FONLL at NNLO calculates to . Only calculating to results in a relatively large , which can reduce the need for a higher-twist term. However, as soon as is calculated to or higher, a higher-twist term is required. The best fit achieved for HHT NNLO is with the RTOPT scheme.
5 Reduced Cross Sections
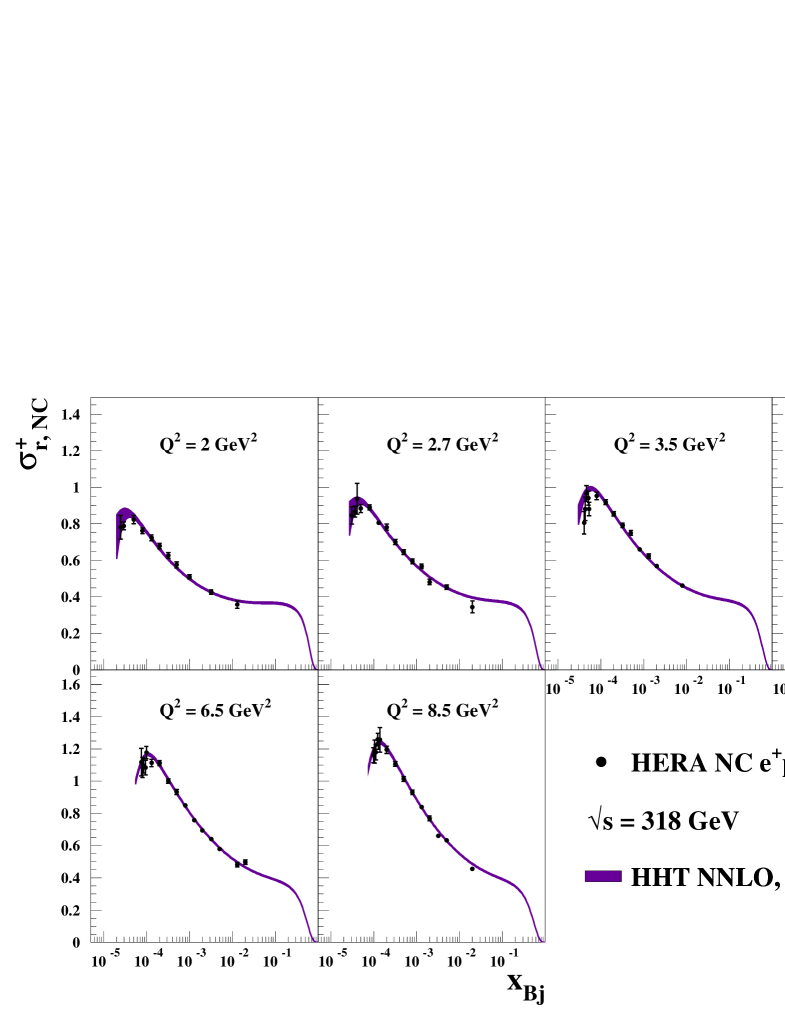
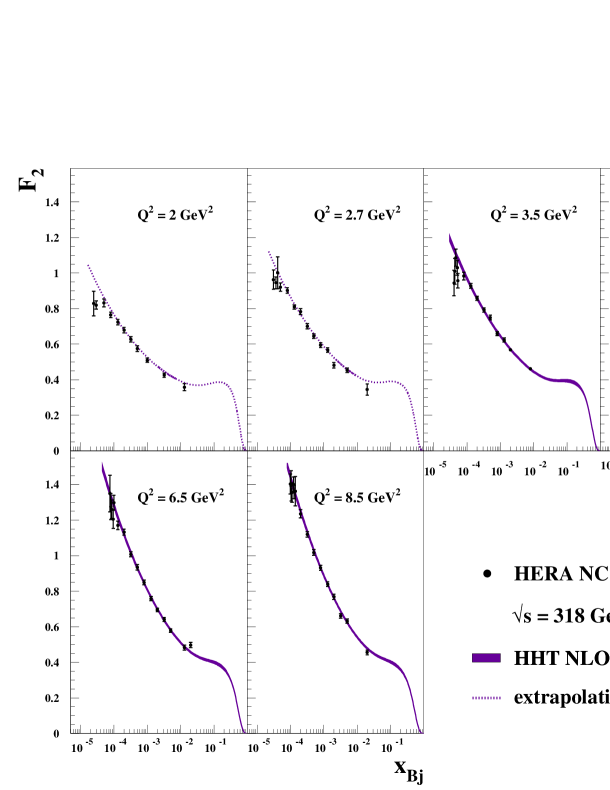
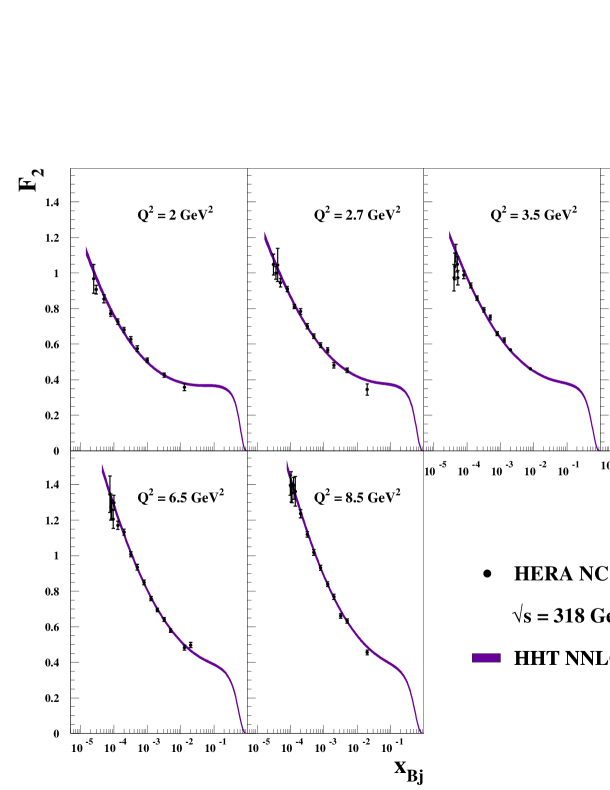
A comparison of the predictions of HHT and HERAPDF2.0 with GeV2 to the measured reduced NC cross sections is shown at NNLO in Fig. 4 and at NLO in Fig. 5. In all cases, the predictions are extrapolated down to GeV2; HHT clearly describes this low-, low- data better. This was already indicated by the /ndof values in Table 1, where the /ndp for the data points with GeV2 are listed separately. The HHT NNLO predictions are clearly preferred as they describe the turn-over of the data towards low quite well. This turn-over region at low is not well described by the predictions from HERAPDF2.0.
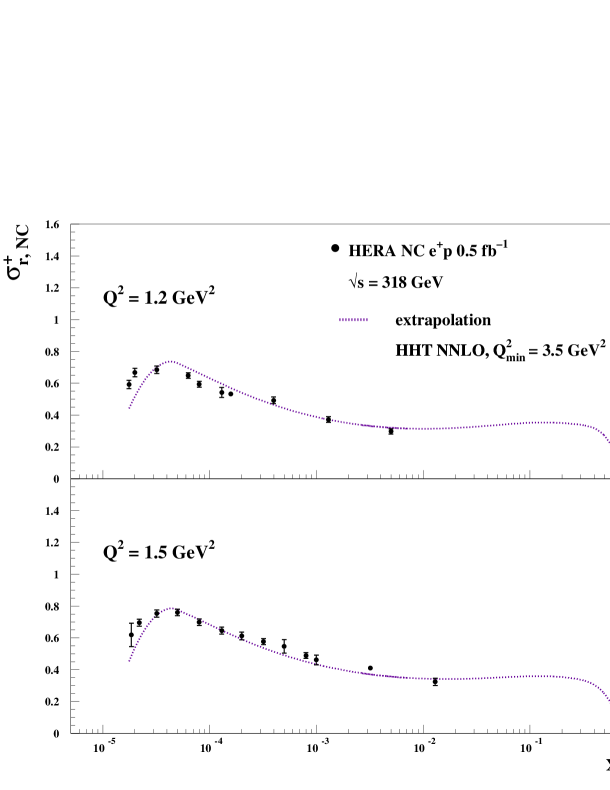
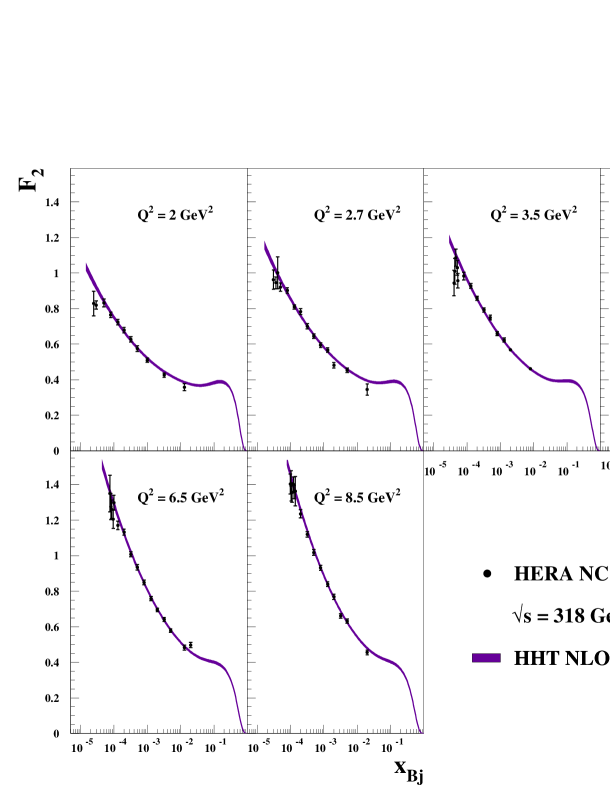
The predictions of the HHT NNLO and HHT NLO with GeV2 are shown in Fig. 6. The data are well described at NNLO, even better than for the standard HHT NNLO with GeV2. The effect of the lower is stronger at NLO, where the turn-over is better described.
The HHT NNLO predictions even describe the data down to GeV2 quite well, as can be seen in Fig. 7. This is especially true for HHT NNLO with GeV2. At GeV2, the turn-over is very well described. At GeV2, the predicted turn-over is somewhat shifted towards higher . However, it is remarkable how well these data below the starting scale of the evolution are described, illustrating once again the apparent ability of a perturbative QCD to describe the data to surprisingly low .
6 The Structure Functions and
Values of the structure function are extracted from the data as
| (5) |
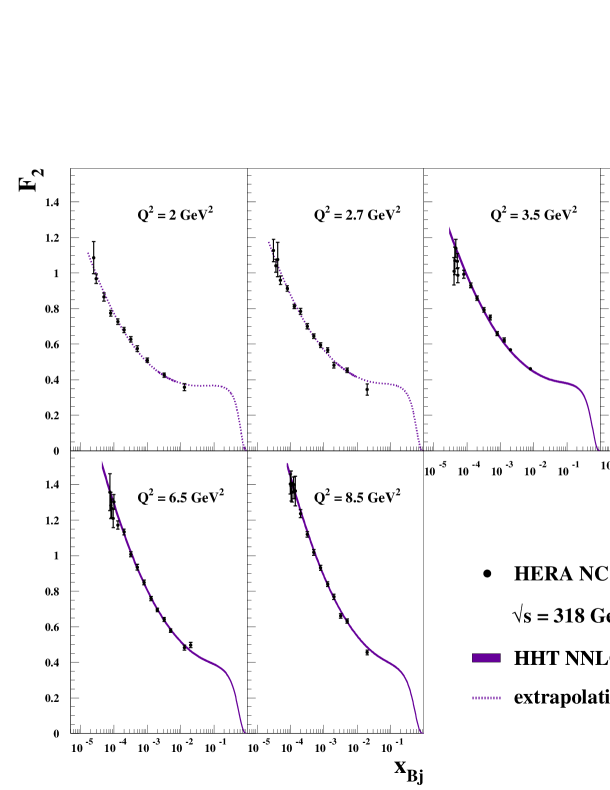
The values of together with are shown in Figs. 8 and 9 for HHT and HERAPDF2.0 at NNLO and NLO, respectively. At NNLO, the HHT predictions and extractions agree well down to GeV2. Since is substantial, the predictions from HHT for are larger than from HERAPDF2.0 at low . Since , see Eq. 1, this results also in larger predictions for and in larger values of . The agreement between prediction and extraction is better for HHT. This confirms that the from HERAPDF2.0 is not large enough. The predicted and the extracted values also agree better for HHT at NLO, but the NLO fit is not as good as the NNLO fit below around GeV2.
In Fig. 10, and are shown for HHT NNLO and NLO with GeV2. The situation for the NNLO fit looks very similar to the fit with GeV2. The description of the data by the predictions of the NLO fit is improved at low and low . However, still shows a tendency to turn-over. This confirms the findings of the comparisons with the reduced cross-section data that HHT NNLO is better suited to describe the data than HHT NLO.
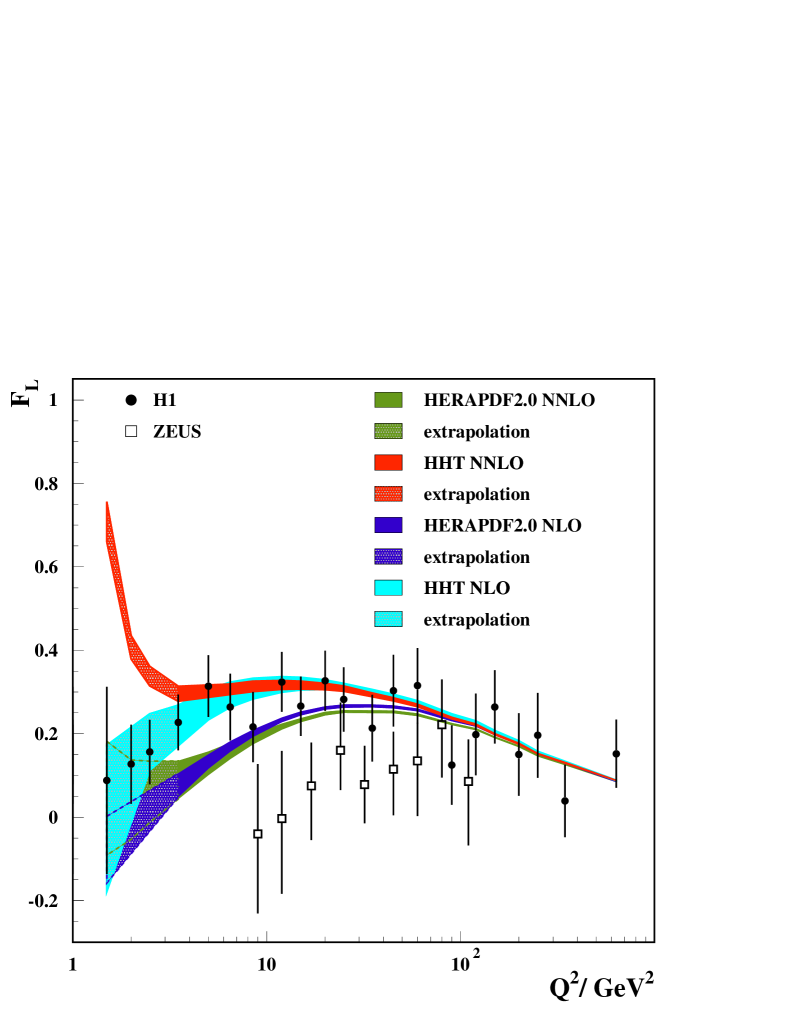
The H1 and ZEUS collaborations published separate measurements of [15, 16], using data with lowered which provided cross sections at different values for identical and . The predictions of HHT and HERAPDF2.0 with GeV2 for at NNLO and NLO are compared to these measurements in Fig. 11. For , the shapes of all predicted curves are similar but the predictions of HHT are significantly higher than those from HERAPDF2.0 for below 50 GeV2. Even though the statistical accuracy of the data is limited, the data mildly favour HHT over HERAPDF2.0 in this regime.
In Fig. 11, extrapolated predictions are shown below GeV2 and even below the starting scale GeV2. These predictions have large uncertainties and the accuracy of the data is limited, but it is clear that the upturn of predicted by HHT NNLO is not favoured by the data. This disagreement on is in contrast to the fact that the predictions of HHT NNLO describe the very precise NC cross sections down to GeV2 remarkably well, see Fig. 7. Although the higher-twist term is expected to be important for [10], the very large increase of the predicted suggests that some other effect is being absorbed in in the simple used in the current analysis. Since HERA kinematics couples low to low it could be that resummation has a role to play here.
Interestingly, HERAPDF2.0 NNLO also predicts a slight upturn of at below . This suggests that the upturn in both the HHT and HERAPDF2.0 NNLO analyses is connected to the NNLO coefficient functions, which are large and positive. Similar effects were observed previously [29] for predictions from both pure DGLAP analyses and those including higher-twist terms.
7 Saturation
The operator-product expansion beyond leading twist has diagrams in which two, three or four gluons may be exchanged in the t-channel such that these gluons may be viewed as recombining. This recombination could lead to gluon saturation [11]. The -term used in the analysis presented here corresponds to twist-4. Another approach to describe saturation is the colour-dipole picture, which is formulated in the proton rest frame where the incoming photon develops structure over a coherence length proportional to and . Recently, fits to the HERA data were presented [30], which indicate that saturation effects should set in at latest at , but possibly earlier. The data presented here reach down to . It is therefore interesting to see if there is any hint of saturation effects becoming important already in these HERA data.
Phenomenological models of saturation have been treated in the colour-dipole picture. A successful dipole model using the non-linear running-coupling Balitsky-Kovchegov equation [31, 32] has been developed by Albacete et al. [33]. However, fits in such a scheme are beyond the scope of the present paper. Instead the HERA data are here compared with the predictions of a simple dipole model of saturation [34] by Golec-Biernat and Wüsthoff (GBW), in which the onset of saturation is characterised as the transition from a “soft” to a “hard” scattering regime. This occurs along a “critical line” in the plane. Fits to early HERA data with low and low indicated that the criticial line would be around at GeV2 and at GeV2 [34]. These very low- and low- data are mostly not included in the present HHT analysis. This analysis is based on the DGLAP formalism which is not expected to work for as low as 1 GeV2. The necessary cut limits the range of the fitted data in such that the data used here just touch the predicted critical line.
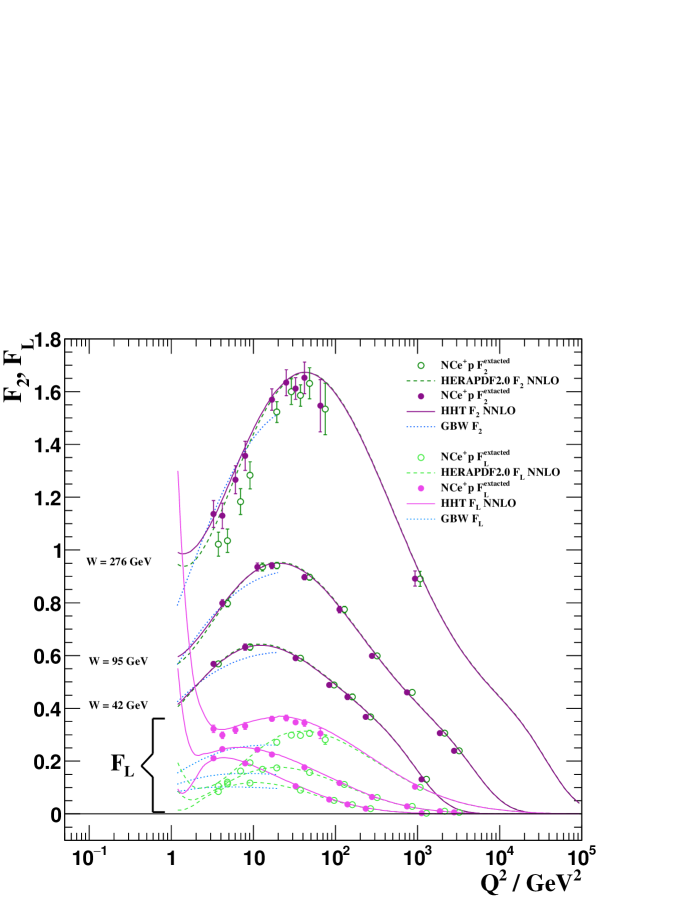
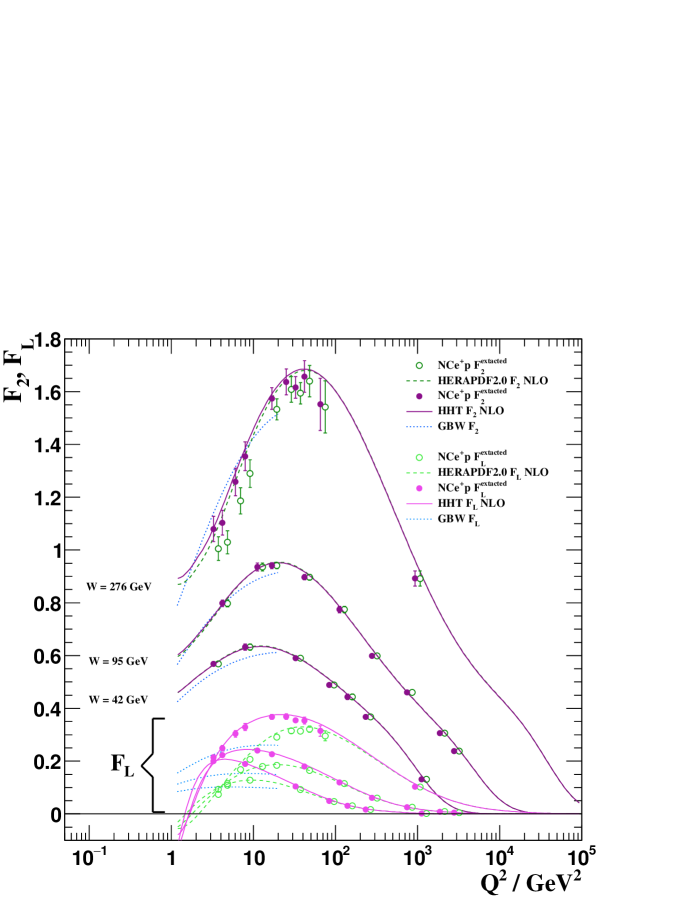
Results on and are presented for selected values of the energy at the photon–proton vertex, , to separate out the low- regime of the data () and to compare to the predictions of GBW. Figures 12 and 13 show extractions 222Extracted values are calculated similarly to the values of , see Eq. 5. together with the corresponding predictions for and for the high-precision NC data for HHT and HERAPDF2.0 at NNLO and NLO, respectively. The data used here are limited to GeV2 and approach the critical regime of only for GeV. The predictions of GBW, also shown in Figs. 12 and 13, agree reasonably well with the predictions of HHT up to of about 10 GeV2 at this highest value, the only value where HHT and HERAPDF2.0 differ significantly. The values of are significantly larger for HHT in this low- regime than for HERAPDF2.0 and they agree better with the corresponding predictions. This is true for fits at NNLO and at NLO. In both cases, it is caused by significantly larger values of , since Eq. 1 implies that must also increase.
For Figs. 12 and 13, all predictions from HHT and HERAPDF2.0 were extrapolated down to GeV2, a value below the starting scale, for which the predictions of HHT NNLO nevertheless still describe the reduced cross sections quite well, see Fig. 7. The predictions from GBW are expected to be particularly relevant in this regime while the pQCD evolution on which HHT and HERAPDF2.0 are based is expected to start to break down. This is demonstrated by the results on . The extractions and predictions differ substantially between NNLO and NLO for below 10 GeV2. At NLO, the predicted values become negative for all three values as approaches 1 GeV2 for both HERAPDF2.0 and HHT. This is unphysical. At NNLO, all predicted values start to increase as approaches 1 GeV2. For HHT NNLO, this increase is dramatic.
Figures 12 and 13 also demonstrate that values of cannot be considered measurements. Even though the predictions of HHT and HERAPDF2.0 differ significantly below 100 GeV2, the extractions seem to simply reflect those predictions. This demonstrates the importance of direct measurements.
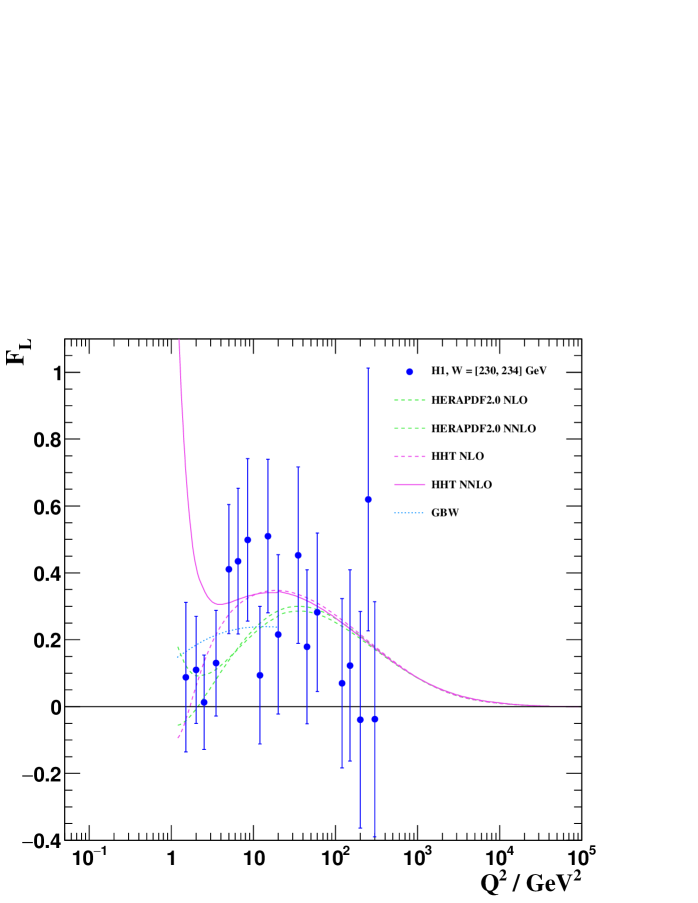
Figure 14 shows predictions for from HHT and HERAPDF2.0 at both NNLO and NLO for GeV together with a prediction from GBW. The plot also contains measured values down to of almost 1 GeV2 published by the H1 collaboration [15]. The statistical accuracy of these data is limited, but the strong upturn of predicted by HHT NNLO is not observed. The data confirm the downward trend of the values measured for the full range shown in Fig. 11. Colour-dipole motivated models [34, 29] predict that becomes similar for different values of at low . The measured values of shown in Figs. 11 and 14 are compatible with this.
The strong difference between predictions from HHT NNLO and NLO, together with the HHT NNLO prediction of a strong upturn of as approaches 1 GeV2 indicate that the current simple higher-twist correction to the perturbative DGLAP evolution alone cannot completely describe the physics involved, even though the reduced cross sections are described quite well by this .
8 Conclusions
The addition of a twist-4 term to the description of the longitudinal structure function significantly improved the quality of pQCD fits within the DGLAP framework to HERA data. In particular, the description of cross sections at low and low was improved. The range of the fits was extended down to GeV2 and the cross-section data could be well described down to GeV2 by extrapolations. The addition of a higher-twist term to the structure function has no effect. This confirms the expectation that the influence of higher-twist effects cancels for longitudinally and transversely polarised photons in .
The recombination of gluons is part of the higher-twist formalism. This can be seen as a mechanism of saturation. The strong influence of such a higher-twist term can be seen as the first hint for the onset of saturation in the HERA data at low and low . The predictions of HHT NNLO for become very high for below 3.5 GeV2 and disagree with the data. This indicates that the pQCD description is breaking down and further mechanisms are needed for a consistent description of the data at the lowest and .
9 Acknowledgements
We are grateful to our ZEUS colleagues who supported this work. We thank our funding agencies, especially the Alexander von Humboldt foundation, for financial support and DESY for the hospitality extended to the non-DESY authors. We also thank K. Golec-Biernat for discussions and providing the predictions of the GBW model.
References
- MANDY [(2011Cooper-Sarkar and Devenish)] authorA. M. Cooper-Sarkar and R. Devenish, Deep Inelastic Scattering (Oxford University Press, (2011)).
- Aaron et al. [2010] F. Aaron et al. [ZEUS and H1 Collaboration], JHEP 1001, 109 (2010), [arXiv:0911.0884].
- Abramovicz et al. [2015] H. Abramovicz et al. [ZEUS and H1 Collaboration], Eur. Phys. J. C 75, 580 (2015), [arXiv:1506.06042].
- Gribov and Lipatov [1972a] V. Gribov and L. Lipatov, Sov. J. Nucl. Phys. 15, 438 (1972a).
- Gribov and Lipatov [1972b] V. Gribov and L. Lipatov, Sov. J. Nucl. Phys. 15, 675 (1972b).
- Lipatov [1975] L. Lipatov, Sov. J. Nucl. Phys. 20, 94 (1975).
- Dokshitzer [1977] Y. Dokshitzer, Sov. Phys. JETP 46, 641 (1977).
- Altarelli and Parisi [1977] G. Altarelli and G. Parisi, Nucl. Phys. B 126, 298 (1977).
- Kuraev et al. [1977] E. Kuraev, L. Lipatov, and F. Fadin, Sov. Phys. JETP 45, 199 (1977).
- Bartels et al. [2000] J. Bartels, K. Golec-Biernat, and K. Peters, Eur. Phys. J. C 17, 121 (2000), [hep-ph/0003042v4].
- Bartels et al. [2002] J. Bartels, K. Golec-Biernat, and H. Kowalski, Phys. Rev. D 66, 014001 (2002), [hep-ph/0203258].
- Caola et al. [2009] F. Caola, S. Forte, and J. Rojo, Phys. Lett. B 686, 127 (2010), [arXiv:0910.3143].
- Rojo [2015] J. Rojo, PoS (EPS-HEP2015), 506 (2015), [arXiv:1508.07731].
- Cooper-Sarkar et al. [1988] A. M. Cooper-Sarkar et al., Z. Phys. C 39, 281 (1988).
- Andreev et al. [2013] V. Andreev et al. [H1 Collaboration], Eur. Phys. J. C 74, 2814 (2014), [arXiv:1312.4821].
- Abramowicz et al. [2014] H. Abramowicz et al. [ZEUS Collaboration], Phys. Rev. D 90, 072002 (2014), [arXiv:1404.6376].
- Alekhin et al. [2012] S. Alekhin, J. Blumlein, and S. Moch, Phys. Rev. D 86, 054009 (2012), [arXiv:1202.2281].
- Motyka et al. [2012] L. Motyka, M. Sadzikowski, and W. Slominski, Phys. Rev. D 86, 111501 (2012), [arXiv:1203.5461].
- Abramovicz et al. [2016] H. Abramovicz et al. [ZEUS Collaboration] Phys. Rev. D 93, 092002 (2016), [arXiv:1603.09628].
- Alekhin et al. [2014] S. Alekhin et al., Eur. Phys. J. C 75, 304 (2015), [arXiv:1410.4412].
- Thorne and Roberts [1998] R. S. Thorne and R. G. Roberts, Phys. Rev. D 57, 6871 (1998), [hep-ph/9709442].
- Thorne [2006] R. S. Thorne, Phys. Rev. D 73, 054019 (2006), [hep-ph/0601245].
- Thorne [2012] R. S. Thorne, Phys. Rev. D 86, 074017 (2012), [arXiv:1201.6180].
- Martin et al. [2009] A. D. Martin, W. J. Stirling, R. S. Thorne, and G. Watt, Eur. Phys. J. C 63, 189 (2009), [arXiv:0901.0002].
- Harland-Lang et al. [2015] L. A. Harland-Lang, A. D. Martin, P. Motylinski, and R. S. Thorne, Eur. Phys. J. C 75, 204 (2015), [arXiv:1412.3989].
- Harland-Lang et al. [2016] L. A. Harland-Lang, A. D. Martin, P. Motylinski, and R. S. Thorne, Eur. Phys. J. C 76, 10 (2016), [arXiv:1601.03413].
- Cacciari et al. [1998] M. Cacciari, M. Greco, and P. Nason, JHEP 9805, 007 (1998), [hep-ph/9803400].
- Forte et al. [2010] S. Forte, E. Laenen, P. Nason, and J. Rojo, Nucl. Phys. B 834, 116 (2010), [arXiv:1001.2312].
- Martin et al. [2006] A. D. Martin, W. J. Stirling, and R. S. Thorne, Phys. Lett. B 635, 305 (2006), [hep-ph/0601247].
- Caldwell [2016] A. Caldwell, New J. Phys. 18, 073019 (2016), [arXiv:1601.04472v1].
- Balitsky [1996] I. Balitsky, Nucl. Phys. B 463, 99 (1996), [hep-ph/9509348].
- Kovchegov [1999] Y. Kovchegov, Phys. Rev. D 60, 034008 (1999), [hep-ph/9901281].
- Albacete et al. [2010] J. L. Albacete et al., Eur. Phys. J. C 71, 1705(2011), [arXiv:1012.4408].
- Golec-Biernat and Wüsthoff [1998] K. Golec-Biernat and M. Wüsthoff, Phys. Rev. D 59, 014017 (1998), [hep-ph/9807513].
| Fit at | with GeV2 | HERAPDF2.0 | HHT | GeV2 |
|---|---|---|---|---|
| NNLO | /ndof | 5.50.6 | ||
| /ndp for NC : | ||||
| /ndp for NC : GeV | ||||
| NLO | /ndof | 4.20.7 | ||
| /ndp for NC : | ||||
| /ndp for NC : GeV |
| Fit at | with GeV2 | HERAPDF2.0 | HHT | GeV2 |
|---|---|---|---|---|
| NNLO | /ndof | 1437/1171 | 5.20.7 | |
| /ndp for NC : | 486/402 | |||
| /ndp NC : GeV2 | 31/25 | 26/25 | ||
| NLO | /ndof | 1433/1171 | 4.00.6 | |
| /ndp for NC : | 487/402 | |||
| /ndp NC : GeV2 | 40/25 |