A New Constraint on the Ly Fraction of UV Very Bright Galaxies at Redshift 7
Abstract
We study the extent to which very bright () Lyman-break selected galaxies at redshifts display detectable Ly emission. To explore this issue, we have obtained follow-up optical spectroscopy of 9 galaxies from a parent sample of 24 galaxy candidates selected from the 1.65 deg2 COSMOS-UltraVISTA and SXDS-UDS survey fields using the latest near-infrared public survey data, and new ultra-deep Subaru -band imaging (which we also present and describe in this paper). Our spectroscopy has yielded only one possible detection of Ly at with a rest-frame equivalent width . The relative weakness of this line, combined with our failure to detect Ly emission from the other spectroscopic targets allows us to place a new upper limit on the prevalence of strong Ly emission at these redshifts. For conservative calculation and to facilitate comparison with previous studies at lower redshifts, we derive a 1- upper limit on the fraction of UV-bright galaxies at that display , which we estimate to be . This result may indicate a weak trend where the fraction of strong Ly emitters ceases to rise, and possibly falls between and . Our results also leave open the possibility that strong Ly may still be more prevalent in the brightest galaxies in the reionization era than their fainter counterparts. A larger spectroscopic sample of galaxies is required to derive a more reliable constraint on the neutral hydrogen fraction at based on the Ly fraction in the bright galaxies.
Subject headings:
cosmology: observations – cosmology: reionization – galaxies: high-redshift – galaxies: evolution1. Introduction
Understanding the epoch of cosmological reionization has been a key challenge in modern observational cosmology. The Gunn-Peterson test with spectra of high-redshift (high-) quasars is an observational tool for detecting the reionization epoch, and suggests that the intergalactic medium (IGM) was reionized at (Fan et al., 2006). There is also observational evidence that neutral hydrogen still remains in the IGM of the universe at , e.g., studies with quasars (Becker et al., 2015) and with gamma-ray bursts (GRBs) (Totani et al., 2014; Hartoog et al., 2015). Recent analysis of the cosmic microwave background (CMB) indicated the redshift of the cosmic reionization of by Planck (Planck Collaboration, 2015).
Galaxies associated with Ly emission, i.e., Lyman- emitters (LAEs) are also valuable probes to infer the neutral hydrogen (H i) fraction of the IGM. McQuinn et al. (2007) suggested the effectiveness of this concept from a theoretical viewpoint. Observational studies indicated that the luminosity functions (LFs) of the Lyman-break galaxies (LBGs) show a monotonic decline in number density at to (McLure et al., 2013; Bowler et al., 2012, 2014, 2015; Bouwens et al., 2015). In contrast, the LFs of LAEs show little change at , implying an increasing fraction of LAEs relative to LBGs with increasing redshift; in turn, they show a significant decline at in the number density, e.g., Konno et al. (2014) who presented a clear decrease in the Ly LF at from the . This rapid decline in the Ly LF can be attributed to a change in at . The neutral hydrogen in the IGM could decrease observed Ly photons from star-forming galaxies by resonant scattering(Kobayashi et al., 2010). Ouchi et al. (2010) suggested an increase in the H i fraction from to and the estimated is 0.22 at . They suggested possible cosmic variance in the number density of LAEs across a sq.degree area by a factor of 2 to 10 depending on their NB921 magnitudes. Kashikawa et al. (2011) inferred at from a different data set, suggesting existence of the cosmic variance in with a possible patchy reionization process in the universe.
A caveat in investigating reionization with the LFs of galaxies is that the LFs are likely to be influenced by galaxy evolution. In contrast, the Ly fraction, i.e., the fraction of galaxies exhibiting strong Ly emission of the total LBGs, has an advantage in that it should be less affected by galaxy evolution, especially in terms of the number density, than the Ly LFs, which require comparison with the UV LFs (Stark et al., 2010). In addition, star formation activity and dust/metal content of galaxies which contribute to the equivalent width (EW) of Ly, do not change rapidly even at compared to those at lower redshifts (Dunlop et al., 2013).
The Ly fraction at each redshift has been studied intensively to yield a complementary information to the cosmic reionization process (Stark et al., 2010, 2011; Pentericci et al., 2011; Ono et al., 2012; Curtis-Lake et al., 2012; Treu et al., 2013; Tilvi et al., 2014; Caruana et al., 2014; Cassata et al., 2015). The studies by Stark et al. (2010) and Ono et al. (2012) suggested that the Ly fraction of LBGs drops significantly from to in contrast to its monotonic increase at . Their faint sample showed a more rapid decline than the bright sample. Tilvi et al. (2014) also studied the Ly fraction at and discussed the decline in Ly fraction at with the possibility of witnessing the ongoing cosmic reionization process at . A recent study with Hubble Space Telescope (HST) slitless spectroscopy targeting gravitationally lensed clusters of galaxies (GLASS) also indicated that the number of LAEs at with respect to that of the LBGs is consistent with a lower probability of Ly emission at than at (Schmidt et al., 2016).
While the relative number of LAEs is an effective tracer of the cosmic reionization state, a fair application would require consideration of several factors that may affect the observable Ly emission from high- galaxies. The strength of Ly emitted from galaxies may be affected by a combination of physical properties of galaxies and the transmission of the IGM along the lines of sight.
Stark et al. (2010) discussed the importance of the coupled effects by internal dust extinction and the geometry and kinematics of H i gas surrounding a galaxy, to determine the net Ly photons that can escape from the galaxy. LBGs with low luminosities tend to have low metallicity or dust extinction, leading to a bluer UV color (Bouwens et al., 2014; Bowler et al., 2015) and likely association of strong Ly emission. This may introduce a possible luminosity dependence of the Ly fraction, as suggested in previous studies (Stark et al., 2011; Ono et al., 2012). Steidel et al. (2010) discussed a similar trend in the stellar mass dependence on the strong Ly emission.
Observational studies suggested that LBGs with high UV luminosities tend to show a deficit in strong Ly emission (Ando et al., 2006; Shimasaku et al., 2006). Based on spectroscopic observations of LBGs, Stark et al. (2011) reported that the Ly fraction of LBGs with low UV luminosities is higher than that of those with high luminosities at . In addition, the Ly fraction () rises as redshift increases over . Cassata et al. (2015) supported this trend at based on a spectroscopic survey of galaxies in the VIMOS-VLT Deep Survey (VVDS) sample. Curtis-Lake et al. (2012) reported the same increase in Ly fraction () from to at bright magnitudes (). Recent spectroscopic studies have also reported detection of Ly in a few sources in a similar luminosity range (Oesch et al., 2015; Roberts-Borsani et al., 2015; Zitrin et al., 2015).
The redshift above is an important epoch to understand the progression of reionization. In particular, it is of interest to investigate even brighter objects (), i.e., in environments in very massive dark matter halos. Such massive halos are thought to evolve and form galaxies with strong clustering in an earlier epoch, and so are likely to host larger amounts of ionizing sources than less massive halos. Therefore, it is expected that reionization would progress earlier in the environments around the massive dark matter halos than in other regions. However, despite intensive observational studies of the Ly fraction at , only small numbers of the LBGs at are available. Primarily due to limitations in the surveyed area and as brighter galaxies are rarer, very little is known about the LBGs with very bright magnitudes. Previous studies on the Ly fraction were conducted only at UV magnitudes fainter than . Thus, new deep and wide imaging and spectroscopic observations are indispensable to extend our knowledge of the bright magnitude regime. Focusing on such UV-bright LBGs is also an effective approach that facilitates follow-up spectroscopy and allows determination of a reliable Ly fraction at high redshifts.
We have undertaken a new survey program to cover an unprecedentedly wide area by a deep imaging survey to detect UV-bright LBGs, followed by spectroscopic observation of some of the high- candidate galaxies. In this study, with the new spectroscopic sample from our survey program, we examine the Ly fraction of LBGs at for very bright magnitudes. We also discuss the cosmic reionization at redshift 7, providing a new constraint on the cosmic neutral H i fraction. In Section 2, we summarize the observations and data reduction in our -band imaging survey program, and explain the method of target selection for LBG candidates at . Section 3 describes the follow-up spectroscopy and properties of the spectroscopic sample. The Ly EW of our UV-bright galaxy sample is described in Section 4. We discuss the Ly fraction of LBGs in Section 5, and its implications and interpretation regarding the state of the cosmic reionization in Section 6. Finally, conclusions are presented in Section 7. Throughout the paper, we use the AB magnitude system (Oke & Gunn, 1983), and assume a flat universe with .
2. Imaging Observations, Data, and Target Selection
This paper aims to study the Ly fraction based on LBG candidates at in the two common fields, COSMOS/UltraVISTA and SXDS/UKIDSS-UDS (hereafter, UltraVISTA and UDS, respectively). These two survey fields represent a unique and powerful combination for studies on high- galaxies, where extensive multi-wavelength surveys at various facilities have been performed. In particular, the two ground-based deep near-infrared (NIR) surveys UltraVISTA (McCracken et al., 2012) and UKIDSS-UDS (Lawrence et al., 2007) provide an unprecedentedly wide and deep data set over an area of 1.65 sq.degree, making the two fields the most suitable for searches of bright LBGs at .
Initially, however, only relatively shallow optical data sets were available in these fields, especially in the band, which is crucial for detecting the dropout feature of the Lyman-break of the galaxies, e.g., COSMOS imaging (Capak et al., 2007) by the Subaru Telescope covering the UltraVISTA field in the and bands, with (5 , 3-arcsec aperture), and the Subaru/XMM-Newton Deep Survey (SXDS) (Furusawa et al., 2008) located at the UDS field in the , and bands to a depth of (5 , 2-arcsec aperture). This situation motivated us to undertake a new observational campaign of ultra-deep imaging in the band in the two fields.
We use a combined sample of the LBGs presented previously by Bowler et al. (2012, 2014), and a small addition to this work in the UDS field as described below. In the following sections, we first present an overview of the entire -band imaging campaign and data reduction. Then, construction of the sample of LBGs in each field is explained.
2.1. Suprime-Cam -band Data
2.1.1 Observations
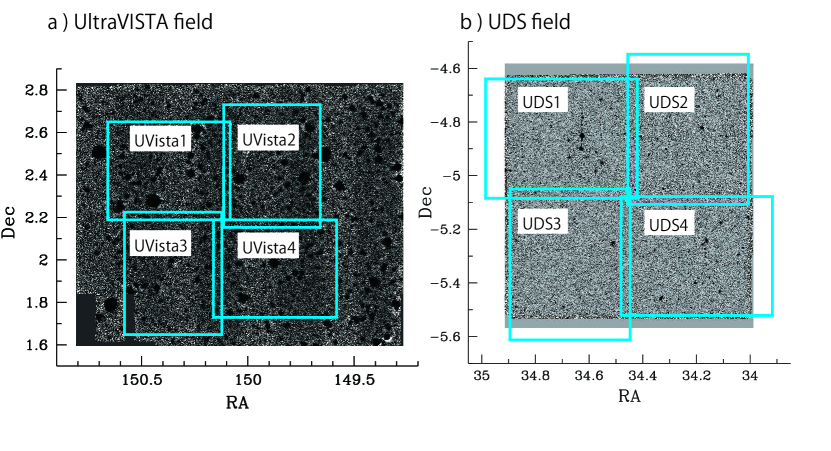
The deep imaging observations in the band were conducted with Suprime-Cam (Miyazaki et al., 2002) using the 8.2 m Subaru Telescope, which uses fully depleted CCDs that were introduced in 2008 August. Our survey plan was designed to cover the two target fields UltraVISTA and UDS ( sq.degree) with eight pointings of Suprime-Cam, the field of view of which is sq.arcmin. Figure 1 summarizes this pointing strategy. Each pointing was planned to be integrated by 20 hours, divided into shorter exposures. The observing times were awarded as an open-use Subaru intensive program (PI: Furusawa; S08B-051). Originally, 20 nights were allocated over three semesters from 2008 October to 2009 November. To compensate for low completion rate due to poor weather conditions, etc., another 16 nights were added by a regular open-use program and the observatory’s discretionary time. Final exposure times in each pointing, which are merged into the stacked images are 19.6, 18.3, 18.7, and 20.8 hours for the UltraVISTA field, and 11.7, 16.2, 11.7, and 15.5 hours for the UDS field. The -band data obtained in this campaign are summarized in Table 1.
2.1.2 Data Reduction
Data reduction of the -band data performed to generate mosaic-stacked images from raw CCD images, following the procedure described in Furusawa et al. (2008). The SDFRED2 software (Yagi et al., 2002; Ouchi et al., 2004) provided by the observatory was used. Small fluctuations due to cross-talk between amplifiers of the CCD were corrected (Yagi, 2012) for the UDS field data. The full width half-maximums (FWHMs) of the point spread function (PSF) of the stacked images before any convolution or transformation are 0.76, 0.84, 0.70, and 0.82 arcsec for the UltraVISTA field, and 0.75, 0.81, 0.78, and 0.81 arcsec for the UDS field.
The celestial coordinates of the stacked images were calibrated with the USNO-B1.0 catalog (Monet et al., 2003), using SExtractor and SCAMP111http://www.astromatic.net . The resultant residuals of the determined coordinates from the USNO-B1.0 catalog coordinates are on the order of 0.5 to 0.8 arcsec rms. This accuracy is good enough to perform image warping in Section 2.3.
Magnitude zero points of the stacked images were determined with a standard star GD71 (). The estimated depths in the band are 26.6, 26.5, 26.5, and 26.8 (5 , 2-arcsec aperture) for the UltraVISTA field, and 26.3, 26.6, 26,6, and 26.6 for the UDS field. This data set is the deepest ever achieved in the band covering the entire two deep fields ( sq.degree).
2.2. Sample Selection in UltraVISTA Field
Sample selection of galaxies in the UltraVISTA field (RA , Dec. , J2000) was performed by Bowler et al. (2014), in an update to their initial work (Bowler et al., 2012). In the field, the UltraVISTA DR2 provides NIR photometry in the , and bands ( in ultradeep strips; 5 , 1.8-arcsec aperture) over a field of 0.91 sq.degree e.g., Figure 1 in Bowler et al. (2014). They combined the UltraVISTA-DR2 data with the multi-waveband data including the CFHTLS data in the bands (; 5, 2-arcsec aperture), and the final -band data set (Table 1) provided by our imaging campaign.
The high- candidates were selected based on a photometric redshift () analysis applied to the sources detected in the or band under conditions with no detection in the or bluer bands. The resultant LBG sample in the UltraVISTA field contained 19 candidates with , including 13 sources at .
2.3. Sample Selection in UDS Field
The UDS-DR10 data (Omar Almaini, private communication) covers an area of 0.74 sq.degree centered on the UDS field (RA , Dec. , J2000) to depths of , and (5 , 2-arcsec aperture). Bowler et al. (2014) performed selection of LBGs in the UDS field with photometric redshift analysis using the multi-waveband data set including the NIR UDS (, and ) data and the optical SXDS (, and ) data. The data set also included the -band data in our imaging campaign. However, the -band data were of interim status, which consisted of 11.1, 16.2, 11.2, and 15.5 hours slightly shallower in the UDS1 and UDS3 than the final data set listed in Table 1. Additional -band data have been obtained since their study.
Their LBG sample in the UDS field included only two candidates with in contrast to the UltraVISTA field. This relatively small number of high- candidates in the UDS field may have been due to their requirement of significant detection in the band to avoid contamination by severe cross-talk from the UKIRT/WFCAM, which is only applied to the UDS field. To add as many candidates to their LBG sample in this field as possible, in this study we used the combined data of the UDS-DR10, the SXDS, and the updated -band data set with the final depths (Table 1). Moreover, we applied a different sample selection to the data from that adopted in Bowler et al. (2014). Our additional sample selection procedure is described below.
2.3.1 Additional Sample Selection in UDS Field
We transformed the -band stacked images in the UDS field onto the same pixel coordinates as those of the -band image. The images in the to bands were convolved with a single Gaussian smoothing kernel to have the same FWHMs (0.83 arcsec) of the PSF as the -band images.
On the images, we ran SExtractor (ver. 2.19.5) in double-image mode, with detection on the -band image, to generate -band detected multi-waveband catalogs (; 5 , 2-arcsec aperture), separately for each of the four pointings. We also removed sources located at pixels that were affected by low signal-to-noise ratio (S/N) around the image edges, strong blooming, and strong halos of bright stars.
We applied the following condition to the magnitude-limited sample of galaxies: (1) , (2) , and (3) complete dropout in all of the and bands. The first condition involves selection of the Lyman-break, which together with the second condition minimizes contamination by galactic LT-dwarf stars. The third condition is to reduce contamination by lower-redshift galaxies. The resultant intermediate catalogs that satisfied the above conditions included 659, 757, 725, and 700 sources in each pointing, respectively.
To remove false sources due to severe cross-talk on the images, we visually inspected every candidate source in the intermediate catalogs by eye, instead of requiring detection in the band. The false signals due to cross-talk appeared at positions of 191 pixels and/or its multiples from bright root signals in either the x- or y-axis, in each of the bands. These locations of cross-talk signals are inherited from the characteristics of the read-out electronics of UKIRT/WFCAM. If the candidate is an artifact of cross-talk, there must be a root signal that causes a series of cross-talk located at one of the positions of the multiples of 191 pixels from the candidate. Importantly, a series of false signals decays monotonically with distance from the root signal, and also does not go beyond the quadrant area where the root signal is located. Therefore, for every candidate source, we inspected 24 locations with distances of 191 and 282 pixels from the candidate on the x- and y-axes and grid points according to their combinations. In cases where there is any possible false signal at these locations, we excluded the candidate source as it is likely to be a false signal.
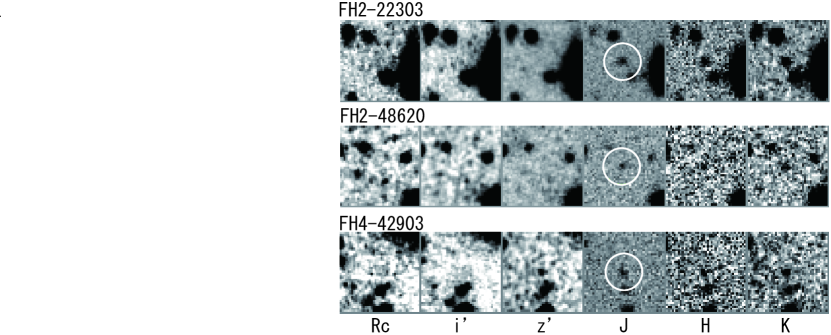
We finally selected three new candidates of galaxies at in the UDS field, which are listed in Table 2. Figure 2 shows postage stamp images of the three sources. The three candidates, FH2-22303, FH2-48620, and FH4-42903, have bright magnitudes (24.3, 25.4, 25.3; 2-arcsec aperture), or rest-frame UV magnitudes of , , and , respectively. Photometric redshifts were derived using data from all of the broad bands from to bands based on the same method employed in Furusawa et al. (2011). The resultant are , and for FH2-22303, FH2-48620, and FH2-42903, respectively, supporting the high redshifts of the candidate galaxies. The associated errors correspond to their confidence levels. The best-fit spectral energy distributions (SEDs) for the three sources are shown in Figure 3. The first two sources (FH2-22303 and FH2-48620) are brighter than all galaxies studied to date by spectroscopy for the Ly fraction (Cassata et al., 2011, 2015; Ono et al., 2012), if confirmed at . We confirmed that the number density of the combined data set () of the sample by Bowler et al. (2014) and the new 3 sources , is consistent with the UV LF presented by Bowler et al. (2014).
2.4. Final Photometric Sample of the Candidates
We selected a total of 24 photometric sample of galaxies at . The sample consists of 19 galaxies in the UltraVISTA field, 2 in the UDS field presented by Bowler et al. (2014), and the 3 new galaxies in the UDS field added in this study.
Of the 24 LBG candidates at , 18 galaxies have very bright UV magnitudes of (14 galaxies in the UltraVISTA, and 4 in the UDS fields). As discussed in Section 3, nine galaxies are spectroscopically followed up in this study, and seven of these belong to the very bright magnitude range.
3. Follow-up Spectroscopy
3.1. Observations, Data, and Analysis
We conducted spectroscopic observations of nine sources of the 24 candidate galaxies selected in the previous section. These targets were chosen to include the four high-priority sources in the UltraVISTA field, which were qualified as ‘robust’ in Bowler et al. (2012), and all the five sources in the UDS field. The ‘robust’ targets were categorized based on results of analysis that did not accept either galactic stars or low- dusty galaxies in Bowler et al. (2012). A summary of the target sources is shown in Table 3. The IDs of all the sources presented in Bowler et al. (2014) are taken from Table 2 of Bowler et al. (2014) with the prefix ‘B14-’, containing four sources in the UltraVISTA field and two in the UDS field. The three sources with the prefix ’FH’ are the sources in the UDS field added in this study. The observations were performed on the four nights of 2013 March 5 and 6 and 2014 October 24 and 25, in multi-object spectroscopy (MOS) mode with Subaru/FOCAS (Kashikawa et al., 2002). The VPH900 grism combined with the OH58 order-sort filter was employed, covering a wavelength range of 7,500 to 10,450 Å giving a spectral resolution of (0.74Å pixel-1) with a slit width of 0.8 arcsec. This combination has the highest throughput at the target wavelengths among the 8-m class telescopes, especially at around , and is therefore highly suitable for the follow-up spectroscopy of Ly emission at . Each MOS mask has a single target source at . The integrated times of 1.3 to 6 hours are devoted to each source (Table 3), being split into individual exposures of 1,200 s, with a dithering width of 1.0 arcsec in the spatial direction between exposures.
Data analysis was performed in a regular manner using the standard pipeline FOCASRED and MOSRED, implemented based on IRAF and provided by the observatory. The raw spectrum data were first bias-subtracted and flatfielded by domeflat data. The pixel areas of target spectra were extracted by applying distortion correction based on a predefined pattern. Then, wavelengths were calibrated based on night sky OH emission lines embedded in the 2D spectra, and sky background was subtracted from the 2D spectra. The reduced 2D spectra of individual exposures were shifted in the spatial direction by the dithering width and combined by taking median with 3- clipping of outlying pixels.
Flux calibration was performed on the stacked 2D spectra using spectrophotometric standard stars GD153, G191B2B, and Feige110, with IRAF tasks ‘standard’, ‘sensfunc’, ‘fluxcalib’, and ‘extinction’. With these tasks, the atmospheric extinction was corrected assuming the atmospheric attenuation as a function of wavelength at Maunakea, which was measured by CFHT. This procedure also removed features of the flatfield as a function of wavelength. The overall fitting error was rms in this calibration, which is good enough for the following discussion. We determined a spatial range of the source on the calibrated 2D spectrum using the IRAF task ‘prows’, and extracted a 1D spectrum by summing fluxes within a spatial range of 6 pixels or 1.2 arcsec centered at the flux peak.
The effects of slit-loss on the measured fluxes of each source were corrected by estimating the missing fluxes based on the seeing size during the spectroscopic observations and the intrinsic sizes of the sources on the -band images. The estimated slit-loss fractions ranged from to .
3.2. Upper Limit of Ly Fluxes
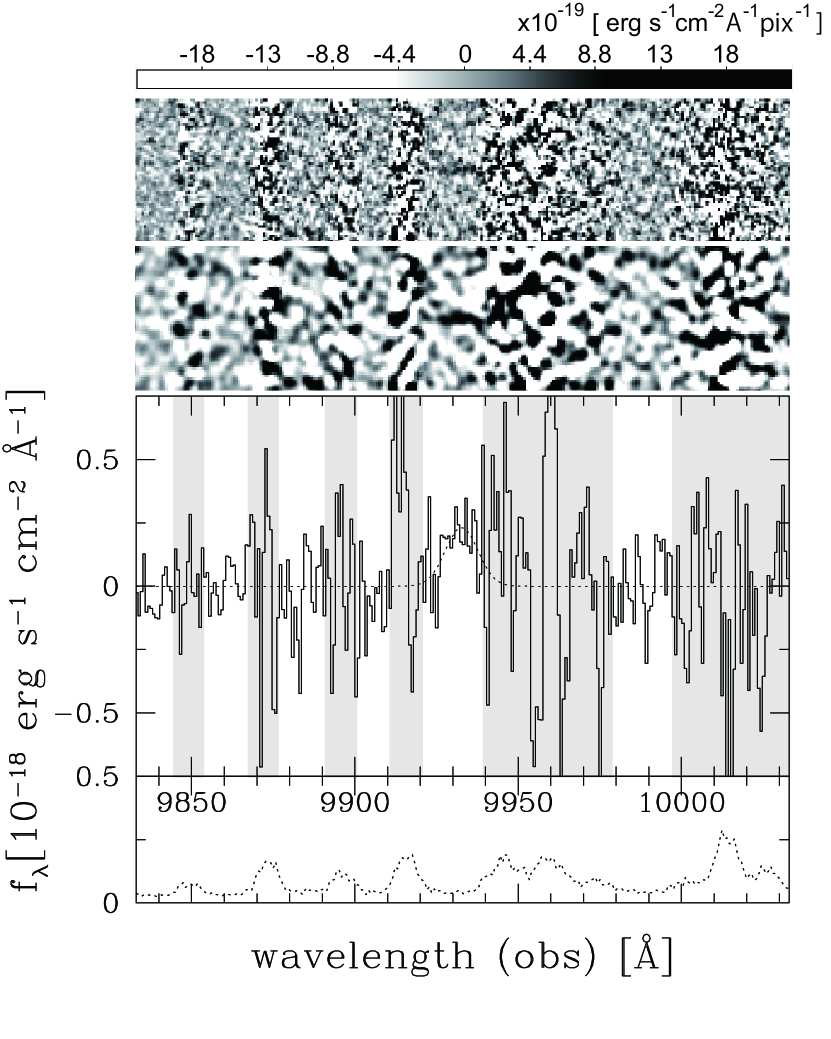
Only a source B14-065666 displays a possible Ly emission at , while the other eight sources showed no convincing emission line features to the S/N level of 3, i.e., no detection of Ly. Figure 4 shows the 2D and 1D spectra of the B14-065666 at around wavelengths including the emission line profile. It was confirmed that the line is detected in each of 2D spectra generated separately for different dither positions, and spatial positions of the line are consistent with the dithering pattern. Only a single line feature is detected in the source B14-065666. This suggests that the line is unlikely to be H Å, as [NII]6548,6584Å(S/N) lines are not visible within the covered wavelength range on the spectrum. In addition, the red color of cannot be explained by ordinary galaxy SEDs. This line is unlikely to be the [OIII], because the doublet lines [OIII]4959,5007 apart could be resolved assuming line ratio in the areas that are free from the OH emission, although the S/N () is not sufficiently large. In addition, the red color cannot be explained due to lack of any break feature around the wavelength range. The [OII] line in this case was located out of the wavelength coverage and could not be detected. The likelihood of the [OII] is also small, as the double lines [OII]3727,3729Å (5.3Å apart in the observer’s frame) should be resolved, although the S/N may not be sufficiently large assuming line ratio near an OH emission band. Nonetheless, the photometric redshift of (Bowler et al., 2014) and the red color of the source could exclude being a lower- galaxy at .
The property of the possible Ly emission was measured on the 1D spectrum of B14-065666. By profile fitting with the Gaussian function by the IRAF task ‘splot’, the line profile is centered at , which corresponds to a redshift of 7.168 for Ly. This spectroscopic redshift agrees with the estimated by Bowler et al. (2014). The measured Ly flux density is erg s-1 cm-2 (S/N of 5.5), and the Ly luminosity was erg s-1 (Table 3). Here, the flux error was estimated by fluctuation of sky background counts over the wavelength range of the 2D spectra where the line profile is located, avoiding the severe OH skylines. This luminosity is fainter than of the Ly LF in the redshift range by a factor of (Ouchi et al., 2010) to (Matthee et al., 2015).
As the other eight sources did not show any possible emission lines, we studied noise statistics of their 2D spectra to estimate the observational upper limits of their Ly fluxes. To measure the noise fluctuation, we sampled about 500 locations on the 2D spectra in the wavelength range corresponding to Ly at to for five sources, including both regions free from and affected by the OH skylines. Each sampling area covered a rectangular area of 1 arcsec in the spatial direction and a width of 25Å in the wavelength direction, as a typical Ly observed line width. For the other three sources (B14-169850, B14-035314, B14-118717), of which are below (Bowler et al., 2014), we chose the sampling wavelength range to cover the redshifts spanning . This range corresponds to the maximum 1- error of all the photometric sample galaxies as a conservative choice.
3.3. EW Upper Limit
We derived the upper limit of the Ly flux EW for our candidate sources based on the UV luminosities and the 3- upper limit of the Ly flux determined in the previous section. The EW upper limit in the observer’s frame () is converted to that in the rest-frame () on the assumption of , except the source of B14-065666 (). The estimated upper limits of range from to , which are shown in Table 3. The UV magnitudes were calculated from the -band magnitudes derived from MAG_AUTO and assuming a flat spectrum of galaxies located at . For the only source B14-065666 exhibiting a possible Ly emission line, the line flux was converted to using a UV magnitude of as a continuum flux, assuming redshift of . The resultant is , which is consistent with the tendency for UV-bright galaxies to have small even in this very bright magnitude range ().
4. EW of UV Very Bright Galaxies
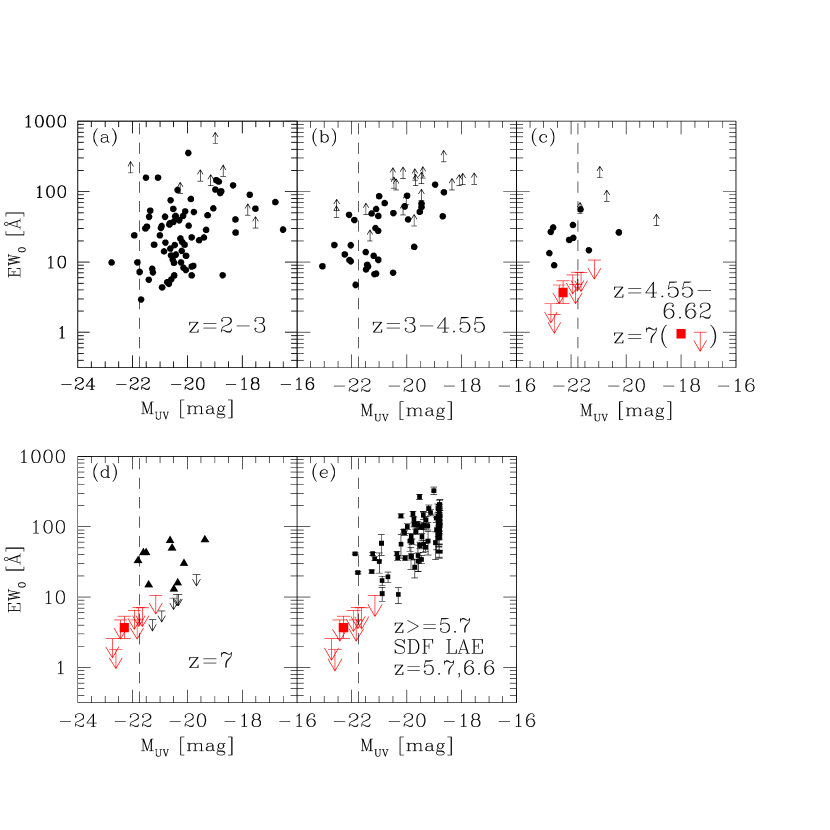
The relations between Ly and UV magnitudes of galaxies in different redshift bins are shown in Figure 5. Our data are compared with previous studies, which provide the following results.
First, in panels (a)–(c) for , the galaxy sample by Cassata et al. (2011) includes galaxies with very bright magnitudes (). However, only a few galaxies show very small of Ly emission in this magnitude range.
Second, in panels (c) and (d), our data are shown with the upper limits to the (Ly), which provide a new galaxy sample to the very bright magnitude range at . These galaxies are associated with very small of . Our data suggest the existence of a considerable fraction of galaxies with low (Ly) at at the brightest UV magnitudes () studied to date; only a source with at in this magnitude range was reported (Ono et al., 2012) prior to this study.
In panel (c) , the data points by Cassata et al. (2011) seem to be located at systematically higher than our data. However, their data points at in panel (c) should be at based on their EW (540 to 1250Å) in the observer’s frame. In addition, with an independent sample based on photometric redshifts, Cassata et al. (2015) indicated that of bright galaxies () at have small of , including galaxies with very small (). Therefore, there should be no marked difference in the relation of and UV magnitudes at between the previous studies (Cassata et al., 2011, 2015) and this study.
Finally, panel (e) compares our results for the LBG candidates with those on the narrow-band selected LAEs in a previous study that surveyed a sq.degree field (Kashikawa et al., 2011). Our UV-selected galaxies show lower than the LAEs in the same redshift range.
5. Ly Fraction of UV Very Bright Galaxies
We aim to obtain a new constraint on the Ly fraction for the very bright magnitude range at , which is studied here for the first time. The new result should be complementary to previous results at fainter magnitudes to understand a luminosity dependence of the Ly fraction.
To derive our results according to the same formalism as adopted in previous studies (Stark et al., 2010; Ono et al., 2012; Cassata et al., 2015), we use the fraction of galaxies with a rest-frame Ly larger than 50Å, . Previous studies discussed in the two magnitude ranges (bright: , and faint: ). As seven sources of our nine sample galaxies are brighter (Table 3) than the above bright magnitude range, we introduce a new magnitude range of ‘very bright’ (). We chose the threshold of 50Å, as the in the bright magnitudes () at presented by Stark et al. (2010) is only the previous result that can be directly compared with our data at . It is essential to compare our Ly fraction at with those at lower redshifts to discuss a change in the Ly fraction and progress in the reionization at these epochs.
We estimated the as follows. First, the seven sources with UV magnitudes spanning from to () were selected. Then, weights for each source were derived by the inverse of detection completeness of each source as a function of brightness. The derived weighted numbers were summed, yielding a weighted total number of sample galaxies of for all seven sources. Finally, as none of the sample galaxies show Ly emission with , we estimated upper limit of the Ly fraction. Here, as an upper limit of the number of sources, we adopted a - upper confidence level (1.84) for the observed count zero based on the Poisson distribution (Gehrels, 1986). The were estimated by dividing this upper limit by the weighted total number of sample galaxies .
In this procedure, the completeness values for the four sources in the UltraVISTA field and one in the UDS field were taken from Bowler et al. (2014). We conducted a Monte Carlo simulation to determine the completeness of the other sources in the UDS fields (Section 2.3.1). Each simulation was performed by adding 1,000 artificial point sources with known magnitudes at random positions on the -band image, and detecting them again. The completeness was calculated as the fraction of recovered sources among the input sources. The simulations were repeated 20 times and the completeness of each simulation was averaged to determine the effective completeness. We confirmed that the completeness values from Bowler et al. (2014) and this study are consistent and the possible uncertainty if any should not change the following discussion. We did not correct for an effect of the OH skylines on detection of the Ly emission assuming the finding by Ono et al. (2012). Their simulation showed that over of simulated Ly lines were recovered and the effect could be ignored at the same wavelengths as those in this study. Moreover, even if B14-065666 were not a true Ly detection, the following results on Ly fraction would not be changed.
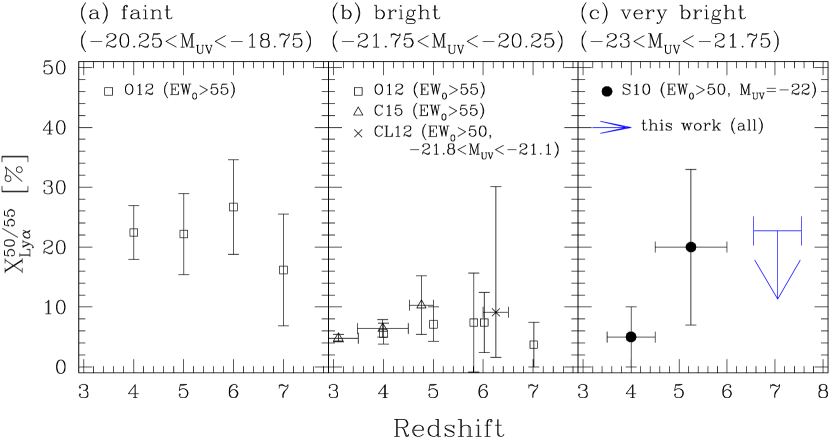
Figure 6 shows changes in the Ly fraction () over in the three different UV magnitude ranges: (a) faint (), (b) bright (), and (c) very bright (). Our data provide upper limits to the at in the very bright range for the first time. The following findings are obtained.
First, in the (c) very bright magnitude range, our data point at possibly implies that the Ly fraction at remains at a similar fraction or lower than that at , although the data points have large errors. In the same panel, the data points derived from Stark et al. (2010) may support a rapid increase in from to . Ono et al. (2012) suggested that the Ly fraction shows a significant decline at from , which is also seen in panels (a) and (b) at the fainter magnitudes. Our results are consistent with this finding even in the very bright magnitude range.
Second, in comparison between panels (b) and (c), our upper limit may indicate a weak trend of the Ly fraction in the very bright magnitude range () at consistently being at a similar level to that at fainter magnitudes. The possibility of a slightly higher Ly fraction at in the (c) very bright range than in the (b) bright range also cannot be excluded. This result seems to extend the relation at (Stark et al., 2010) where the Ly fraction at very bright magnitudes () is at the same level or slightly higher than that of fainter magnitudes (). A similar trend was suggested by Curtis-Lake et al. (2012) in their bright magnitude range () at . They suggested that the Ly fraction for the bright sample may be significantly higher (by or a factor of ) than that of the fainter sample (Stark et al., 2011). Our finding may present some hints of a different trend from that suggested by Ono et al. (2012), where the Ly fraction for the faint ((a) ) sample is consistently higher than that of the bright ((b) ) sample at .
Finally, our upper limit may imply that the Ly fraction in the (c) very bright magnitudes at is comparable to or lower than that in the (a) faint magnitude range at the same redshifts.
6. Discussion
6.1. Ly Fraction
The results in the previous section could provide only weak implications for the Ly fraction of bright galaxies due to the current large errors. Nevertheless, the trend seen in the Ly fraction may possibly imply the existence of physical mechanisms that cause the LBGs with large luminosities to have an Ly escape fraction similar to or higher than that of fainter LBGs (). For example, Bowler et al. (2014) discussed a possible excess at the bright end of the UV LF at by extrapolation of the conventional Schechter function. The similar excess of the Ly LFs has also been studied by Matthee et al. (2015). The excess in the very bright galaxies would require consideration of some special physical processes of galaxy formation, such as lack of an efficient mass-quenching mechanism (Peng et al., 2010) in this epoch. Bongiorno et al. (2016) implied that the feedback from a central active galactic nucleus (AGN) of galaxies, where star formation rate is suppressed by outflows from a luminous AGN, could be a mass-quenching mechanism. If the AGN feedback is weak in the bright galaxies at , destruction of the H ii regions associated with star formation would be reduced, which supports higher luminosities of Ly emission. At the lower redshifts, where the AGN feedback is thought to work more efficiently, star formation in bright galaxies is more suppressed than in faint galaxies. The bright galaxies would have higher metallicity in the gas, and possibly more dust than in the counterparts in ; hence, the Ly emission would be less efficient at the lower redshifts.
In addition, the outflow from a galaxy, if any, may help an increase in the Ly escape fraction, due to scattering of the Ly lines, e.g., Dijkstra et al. (2014b). Moreover, the very bright LBGs may be located in massive dark matter halos where the reionization progresses in an earlier epoch. This trend may lead to a higher transmission of the IGM than in less massive halos. Our result seems to be consistent with this trend.
It is difficult to clearly interpret the observation that the Ly fraction in the very bright range at is still higher than that in the bright range at the same redshifts. This could be in part accounted for by magnification of the sample galaxies due to gravitational lensing by their foreground galaxies (van der Burg et al., 2010), although the result cannot be fully explained.
We note that the above discussion depends on the uncertainty of measurements of the Ly fraction at each redshift. As the error bars for the very bright sample galaxies at both lower redshifts reported by Stark et al. (2010) and at examined in this study are still large, we cannot draw strong conclusions regarding the trend based only on the existing data, and further spectroscopic samples are necessary to obtain more reliable constraints.
6.2. Cosmic Neutral Hydrogen Fraction
Now that we have derived the Ly fraction in the unprecedentedly bright UV magnitude range, it is interesting to derive a new constraint on the neutral H i fraction () in the cosmic reionization epoch. The cumulative probability distribution function (PDF) of Ly , which is the probability of galaxies having a rest-frame larger than a given value, has been used to discuss the neutral H i fraction with faint spectroscopic samples of galaxies () at in previous studies (Pentericci et al., 2011; Ono et al., 2012). Ono et al. (2012) reported that the neutral H i fraction may be 0.6 to 0.9 by comparing their EW-PDF with the model of Dijkstra et al. (2011), which is consistent with those suggested by Schenker et al. (2012) and Pentericci et al. (2011). Caruana et al. (2014) obtained at with 22 relatively faint -dropout galaxies (), followed up by FORS2 of the Keck Telescope. The slight difference in resultant neutral H i fraction from that of Ono et al. (2012) may have been due to difference in the magnitude ranges studied.
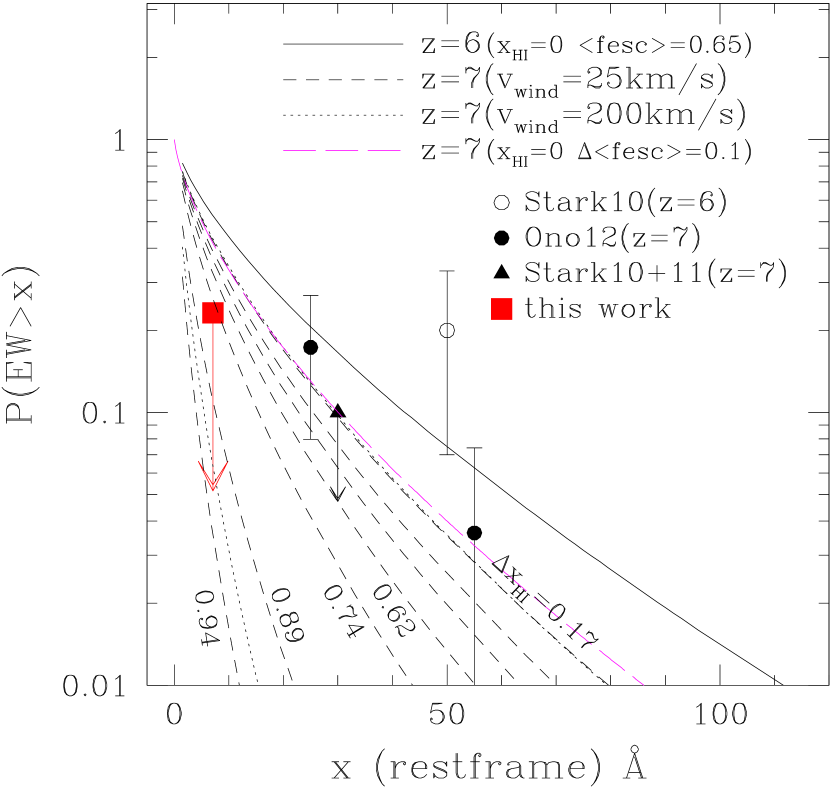
Figure 7 shows the resultant EW-PDF of our new spectroscopic sample in the very bright UV magnitude range (), compared with the results reported in the literature at the same redshift . We estimated the upper limit of EW-PDF at as follows. Of our seven spectroscopic sample galaxies in the very bright magnitude range (i.e., without B14-118717 and FH4-42903), the largest value of the observational upper limit of the was (FH2-48620; Table 3). Hence, we assume that the Ly emission with , if any, would be detected in the seven spectroscopic data, but none of the seven sources shows such an emission line. Therefore, the EW-PDF upper limit was derived by dividing the - upper limit by the weighted total number of sample galaxies , to EW-PDF() (filled square with downward arrow). Here, we assume the non-detection of EW to 3- significance based on the noise statistics averaged over the studied wavelength range, which includes both areas with and without OH emission. This assumption may be slightly optimistic for this small EW range, as there is a chance that possible lines, if any, would be located in the relatively noisier OH emission bands. Nevertheless, the essence of the following discussion is not changed by the uncertainty.
Although we assume for all the sample galaxies except of B14-065666, our discussions in this study would also not be changed by making use of in estimation of . The typical difference in the upper limits determined by and is sufficiently small ().
We compare our data with the model prediction of EW-PDF presented by Dijkstra et al. (2014a). Their model was generated by computing PDF of a fraction of Ly photons transmitted through the IGM, combining models of galactic shell-wind outflows with large-scale semi-numeric simulations of reionization. They determined the reference model EW-PDF at () to coincide with the median Ly fraction () at by Stark et al. (2010). The data point at by Stark et al. (2010) in the very bright magnitude bin at (open circle) is also plotted in Figure 7, which is still consistent with the reference EW-PDF within the error bars. We estimated the EW-PDF models for the various neutral H i fractions at by rescaling the reference EW-PDF (see caption of Figure 7). It is noted that the model of Dijkstra et al. (2014a) was calculated for the UV magnitude range , which is fainter than that of our data, due to the dark matter halo mass range considered in their calculation. Nevertheless, inclusion of more massive halos, which is naively interpreted as the inclusion of UV-brighter galaxies, should produce little if any change in the result (Mark Dijkstra, private communication). Hence, we simply compare their model with our data.
Our upper limit would not contradict the model curves of . Although this is a speculative comparison due to the large error and the small sample size, our data may possibly imply around to with the assumed escape fraction of . This is consistent with the report of Ono et al. (2012) in the fainter magnitude range. This result in the new very bright magnitude range may give further support to the findings discussed in previous studies that the reionization of the universe progresses rapidly from to . We examined the same comparison with the models at fainter magnitudes () using the data points in Ono et al. (2012), and found an inferred of . The combination of the results in the very bright and faint magnitudes may favor on the assumption of the escape fraction .
Based on our data together with the previous results of Ono et al. (2012) and Stark et al. (2010) at the same redshift, the possibility of lower cannot be excluded. As shown by the long-dashed curve (magenta), evolution of the escape fraction of ionizing photons from galaxies may contribute to the net change in EW-PDF. The possible increase in escape fraction may significantly reduce the Ly fraction under the same IGM transmission, which would lower the required to explain the observed EW-PDF at .
Moreover, Dijkstra et al. (2014a) mentioned the effect on their model of the possible existence of LBGs with Ly absorption () at high redshifts , which was reported by Shapley et al. (2003) for LBGs. They suggested that the EW-PDF model would be shifted by by considering LBGs with . Such a shift may explain the Ly fraction (, ) at of presented by Treu et al. (2013). If this is the case at in this study, the possible range would be further decreased to or lower. However, if we rescale the reference EW-PDF model to exactly match the data point of Stark et al. (2010) (open circle), even higher H i fractions than the would be favored. Together with the above discussion, the lack of any strong Ly, such as , in our spectroscopic sample may imply a hint of the unlikely very low at .
Thus, further investigations to gain a better understanding of the physical properties and evolution of galaxies at high redshifts are necessary to provide stringent constraints on . In addition, the number of spectroscopic samples of galaxies is still limited, and therefore future efforts to increase the size of the sample from low to high luminosity ranges, for reliably determining the Ly fraction will be indispensable.
7. Conclusions
We conducted a search for UV-bright LBGs in two legacy survey fields, UltraVISTA and UKIDSS-UDS, which cover an area of 1.65 sq.degree (). Very deep imaging observations on the two survey fields have been undertaken in the band (; 5, 2-arcsec aperture) with Subaru/Suprime-Cam.
We performed selection of candidates in the UDS field from the multi-waveband catalogs (; 5) with the updated -band data, based on the red color in , combined with relatively mild to red color in , and dropout in all optical bands. In the UDS field, we chose three candidates of possible UV-bright galaxies at . The 19 candidate sources in the UltraVISTA field and two sources in the UDS field at presented by Bowler et al. (2014) were combined with the three new sources in the UDS field, yielding 24 targets in total. The spectroscopic observations were obtained on nine sources of the candidates with Subaru/FOCAS. Only a single source B14-065666 shows possible Ly emission at , while the other eight sources show no emission line features. By measurements of noise fluctuations on the 2D spectra, the observational upper limits of the 3- upper limits of the Ly fluxes and were estimated based on these eight sources. The upper limits of Ly span to for these sources. The only source showing a possible Ly emission, B14-065666, has an estimated of with a UV magnitude of . This result supports a tendency for UV-bright galaxies to likely have small even at very bright magnitudes ().
The upper limits of Ly EW at were compared with those of previous studies at . Our new data provide clear upper limits to the (Ly) at in the very bright UV magnitude , implying that a considerable fraction of galaxies with very bright magnitudes () have low EW at .
Based on the upper limits of the Ly EW, the 1- upper limits of Ly fraction with thresholding () at was derived for the brightest magnitude range studied to date (). While the Ly fraction may support a rapid increase from to even in this bright magnitude range, it may possibly imply leveling off, remaining at the same level or below at . This result may support the findings at fainter magnitudes reported by Ono et al. (2012). Our data may also indicate a weak trend whereby the Ly fraction at may be similar to that of the fainter magnitudes at , possibly up to . A slightly higher fraction cannot be ruled out. With a large uncertainty, this result may witness the earlier progression of reionization in more massive dark matter halos, as well as a possible physical mechanism for providing a higher Ly escape fraction in the very UV-bright galaxies at redshift 7.
Finally, we discussed the Ly EW-PDF derived from the upper limits of the Ly fraction at , to provide a new constraint on the neutral H i fraction (). Our resultant EW-PDF at at the very bright magnitudes was combined with previous studies at fainter magnitudes by Stark et al. (2010, 2011) and Ono et al. (2012). We performed a speculative comparison of the observed EW-PDF with the model of Dijkstra et al. (2014a). Although the constraint is not strong given the large error bars, we derived the neutral H i fraction of favored by our data, leaving open the possibility of lower depending on evolution of the physical properties of galaxies, such as the escape fraction. The same comparison with EW-PDF for the fainter counterparts () may support , which is consistent with or below the value for the brighter galaxies. However, further compilation of spectroscopic observations is necessary to determine more reliable constraints on the Ly fraction and reionization at based on a firm understanding of the evolution of galaxies.
References
- Ando et al. (2006) Ando, M., Ohta, K., Iwata, I. et al., 2006, ApJ, 654, L9
- Becker et al. (2015) Becker, G. D., Bolton, J. S., Madau, P. et al. 2015, MNRAS, 447, 3402
- Bongiorno et al. (2016) Bongiorno, A., Schulze, A., & Merloni, A., et al. 2016, A&A, 588, A78
- Bouwens et al. (2014) Bouwens, R. J., Illingworth, G. D., Oesch, P. A. et al. 2014, ApJ, 793, 115
- Bouwens et al. (2015) Bouwens, R. J., Illingworth, G. D., Oesch, P. A. et al. 2015, ApJ, 803, 34
- Bowler et al. (2012) Bowler, R. A. A., Dunlop, J. S., McLure, R. J. et al. 2012, MNRAS, 426, 2772
- Bowler et al. (2014) Bowler, R. A. A., Dunlop, J. S., McLure, R. J. et al. 2014, MNRAS, 440, 2810
- Bowler et al. (2015) Bowler, R. A. A., Dunlop, J. S., McLure, R. J. et al. 2015, MNRAS, 452, 1817
- Capak et al. (2007) Capak, P., Aussel, H., Ajiki, M. et al. 2007, ApJS, 172, 99
- Casali et al. (2007) Casali, M., Adamson, A., & Alves de Oliveira, C., et al. 2007, A&A, 467, 777
- Cassata et al. (2011) Cassata, P., Le Fèvre, O., Garilli, B. et al. 2011, A&A, 525, A143
- Cassata et al. (2015) Cassata, P., Tasca, L. A. M., Le Fèvre, O. et al. 2015, A&A, 573, A24
- Caruana et al. (2014) Caruana, J., Bunker, A. J., Wilkins, S. M. et al. 2014, MNRAS, 443, 2831
- Curtis-Lake et al. (2012) Curtis-Lake, E., McLure, R. J., Pearce, H. J. et al. 2012, MNRAS, 422, 1425
- Dijkstra et al. (2011) Dijkstra, M., Mesinger, A., & Wyithe, J. S. B. et al. 2011, MNRAS, 414, 2139
- Dijkstra et al. (2014a) Dijkstra, M., Wyithe, S., Haiman, Z. et al. 2014a, MNRAS, 440, 3309
- Dijkstra et al. (2014b) Dijkstra, M. 2014b, PASA, 31, e040
- Dow-Hygelund et al. (2007) Dow-Hygelund, C. C., Holden, B. P., Bouwens, R. J. et al. 2007, ApJ, 660, 47
- Dunlop et al. (2013) Dunlop, J., Rogers, A. B., McLure, R. L. et al. 2013, MNRAS, 432, 3520
- Fan et al. (2006) Fan, X., Strauss, M. A., Becker, R. H. et al. 2006, AJ, 132, 117
- Furusawa et al. (2008) Furusawa, H., Kosugi, G., Akiyama, M. et al. 2008, ApJS, 176, 1
- Furusawa et al. (2011) Furusawa, J., Sekiguchi, K., Takata, T. et al. 2011, ApJ, 727, 111
- Fontana et al. (2010) Fontana, A., Vanzella, E., Pentericci, L. et al. 2010, ApJ, 725, L205
- Gehrels (1986) Gehrels, N. 1986, ApJ, 303, 336
- Hambly et al. (2008) Hambly, N. C., Collins, R. S., & Cross, N. J. G., et al. 2008, MNRAS, 384, 637
- Hartoog et al. (2015) Hartoog, O. E., Malesani, D., Fynbo, J. P. U. et al. 2015, A&A, 580, A139
- Hewett et al. (2006) Hewett, P. C., Warren, S. J., & Leggett, S. K., et al. 2006, MNRAS, 367, 454
- Hodgkin et al. (2009) Hodgkin, S. T., Irwin, M. J., & Hewett, P. C., et al. 2009, MNRAS, 394, 675
- Kashikawa et al. (2002) Kashikawa, N., Aoki, K., Asai, R. et al. 2002, PASJ, 54, 819
- Kashikawa et al. (2011) Kashikawa, N., Shimasaku, K., Matsuda, Y. et al. 2011, ApJ, 734, 119
- Kobayashi et al. (2010) Kobayashi, M. A. R., Totani, T., & Nagashima, M. 2010, ApJ, 708, 1119
- Konno et al. (2014) Konno, A., Ouchi, M., Ono, Y. et al. 2014, ApJ, 797, 16
- Lawrence et al. (2007) Lawrence, A., Warren, S. J., Almaini, O. et al. 2007, MNRAS, 379, 1599
- Le Fèvre et al. (2013) Le Fèvre, O., Cassata, P., Cucciati, O et al. 2013, A&A, 559, 14
- Matthee et al. (2015) Matthee, J., Sobral, D., Santos, S. et al. 2015, MNRAS, 451, 400
- McCracken et al. (2012) McCracken. H. J., Milvang-Jensen, B., Dunlop, J. S. et al. 2012, A&A, 544, A156
- McLure et al. (2013) McLure, R. J., Dunlop, J. S, Bowler, R. A. A. et al. 2013, MNRAS, 432, 2696
- McQuinn et al. (2007) McQuinn, M., Hernquist, L., Zaldarriaga, M. et al. 2007, MNRAS, 381, 75
- Miyazaki et al. (2002) Miyazaki, S., Komiyama, Y., Sekiguchi, M. et al. 2002, PASJ, 54, 833
- Monet et al. (2003) Monet, D. G., Levine, S. E., Canzian, B. et al. 2003, AJ, 125, 984
- Oesch et al. (2015) Oesch, P. A., van Dokkum, P. G., Illingworth, G. D., et al. 2015, ApJ, 804, L30
- Oke & Gunn (1983) Oke, J. B. & Gunn, J. E. 1983, ApJ, 266, 713
- Ono et al. (2012) Ono, Y., Ouchi, M., Mobasher, B. et al. 2012, ApJ, 744, 83
- Ouchi et al. (2004) Ouchi, M., Shimasaku, K., Okamura, S. et al., 2004, ApJ, 611, 660
- Ouchi et al. (2010) Ouchi, M., Shimasaku, K., Furusawa, H. et al. 2010, ApJ, 723, 869
- Peng et al. (2010) Peng, Y., Lilly, S. J., Kovač, K. et al. 2010, ApJ, 721, 193
- Pentericci et al. (2011) Pentericci, L., Fontana, A., Vanzella, E. et al. 2011, ApJ, 743, 132
- Planck Collaboration (2015) Planck Collaboration 2015, arXiv:1502.01589
- Roberts-Borsani et al. (2015) Roberts-Borsani, G. W., Bouwens, R. J., Oesch, P. A., et al. 2016, ApJ, in press (arXiv:1506.00854)
- Schenker et al. (2012) Schenker, M. A., Stark, D. P., Ellis, R. S. et al. 2012, ApJ, 744, 179
- Schmidt et al. (2016) Schmidt, K. B., Treu, T., Bradač, M., et al. 2016, ApJ, 818, 38
- Shapley et al. (2003) Shapley, A., E., Steidel, C. C., Pettini, M. et al. 2003, ApJ, 588, 65
- Shimasaku et al. (2006) Shimasaku, K., Kashikawa, N., Doi, M. et al. 2006, PASJ, 58, 313
- Stanway et al. (2007) Stanway, E. R., Bunker, A. J., Glazebrook, K., et al. 2007, MNRAS, 376, 727
- Stark et al. (2010) Stark, D. P., Ellis, R., Chiu, K. et al. 2010, MNRAS, 408, 1628
- Stark et al. (2011) Stark, D. P., Ellis, R., & Ouchi, M. 2011, ApJ, 728, L2
- Steidel et al. (2010) Steidel, C. C., Erb, D. K., Shapley, A. E. et al. 2010, ApJ, 717, 289
- Tilvi et al. (2014) Tilvi, V., Papovich, C., Finkelstein, S. L. et al., 2014, ApJ, 795, 5
- Totani et al. (2014) Totani, T., Aoki, K., Hattori, T. et al., 2014, PASJ, 66, 63
- Treu et al. (2013) Treu, T., Schmidt, K. B., Trenti, M. et al., 2013, ApJ, 775, L29
- van der Burg et al. (2010) van der Burg, R. F. J., Hildebrandt, H., Erben, T. et al. 2010, A&A, 523, A74
- Vanzella et al. (2011) Vanzella, E., Pentericci, L., Fontana, A., et al. 2011, ApJ, 730, L35
- Yagi et al. (2002) Yagi, M., Kashikawa, N., Sekiguchi, M. et al. 2002, AJ, 123, 66
- Yagi (2012) Yagi, M. 2012, PASP, 124, 1347
- Zitrin et al. (2015) Zitrin, A., Labbè, I., Belli, S. et al. 2015, ApJ, 810, L12


| Field Name | Total Exposure | Limiting Magnitude (5, ) | PSF FWHMaaThe FWHMs of PSF sizes in each image before geometric transformation. |
|---|---|---|---|
| (min) | (mag) | (arcsec) | |
| UltraVISTA1 | 1173 | 26.63 | 0.76 |
| UltraVISTA2 | 1096 | 26.46 | 0.84 |
| UltraVISTA3 | 1123 | 26.47 | 0.70 |
| UltraVISTA4 | 1250 | 26.75 | 0.82 |
| UDS1 | 701 | 26.30 | 0.75 |
| UDS2 | 970 | 26.57 | 0.81 |
| UDS3 | 703 | 26.60 | 0.78 |
| UDS4 | 928 | 26.58 | 0.81 |
| Object | RA(J2000) | Dec(J2000) | ||||||||
|---|---|---|---|---|---|---|---|---|---|---|
| FH2-22303 | 02:16:25.092 | 04:57:38.50 | 28.7a,ba,bfootnotemark: | 28.2 | 28.0 | 28.0 | 27.6 | |||
| FH2-48620 | 02:17:39.083 | 04:42:48.71 | 28.8 | 28.1 | 28.2 | 28.1 | 27.6 | |||
| FH4-42903 | 02:17:26.306 | 05:10:16.27 | 28.5 | 28.2 | 28.0 | 28.1 | 27.6 |
| Object | Total Exposure | Flux Limit (3) | Limit (3) | Limit (3) | |
|---|---|---|---|---|---|
| (s) | (erg s-1 cm-2) | (erg s-1) | (mag) | (Å) | |
| B14-169850 | 4800 | 4.7 | |||
| B14-065666 | 14400 | aaThe listed magnitudes are measured within 2-arcsec apertures. | aaMeasured values of the line flux rather than the upper limits. The flux error is estimated by a fluctuation of sky background counts for the wavelength range of the 2D spectra where the line profile is located. | bbThe upper limits in the optical bands are the 2- limiting magnitudes, which are derived from the public SXDS data (Furusawa et al., 2008) for the bands, and converted from Table 1 for the band. | |
| B14-304416 | 7200 | 2.6 | |||
| B14-238225 | 6000 | 6.5 | |||
| B14-035314 | 7200 | 4.7 | |||
| B14-118717 | 6740 | 7.1 | |||
| FH2-22303 | 19200 | 1.8 | |||
| FH2-48620 | 4800 | 7.1 | |||
| FH4-42903 | 7200 | 10.7 |