Progressive Red Shifts in the Late-Time Spectra of Type Ia Supernovae
Abstract
We examine the evolution of late-time, optical nebular features of Type Ia supernovae (SNe Ia) using a sample consisting of 160 spectra of 27 normal SNe Ia taken from the literature as well as unpublished spectra of SN 2008Q and ASASSN-14lp. Particular attention was given to nebular features between 40006000 Å in terms of temporal changes in width and central wavelength. Analysis of the prominent late-time 4700 Å feature shows a progressive central wavelength shift from 4600 Å to longer wavelengths out to at least day +300 for our entire sample. We find no evidence for the feature’s red-ward shift slowing or halting at an [Fe III] blend centroid 4700 Å as has been proposed. The width of this feature also steadily increases with a FWHM 170 Å at day +100 growing to 200 Å or more by day +350. Two weaker adjacent features at around 4850 and 5000 Å exhibit similar red shifts to that of the 4700 Å feature but show no change in width until very late times. We discuss possible causes for the observed red shifts of these late-time optical features including contribution from [Co II] emission at early nebular epochs and the emergence of additional features at later times. We conclude that the ubiquitous red shift of these common late-time SN Ia spectral features is not mainly due to a decrease in line velocities of forbidden Fe emissions, but the result of decreasing line velocities and opacity of permitted Fe absorption lines.
Subject headings:
Line Formation - Radiative Transfer - Supernovae: General1. Introduction
Type Ia supernovae (SNe Ia) have been instrumental in building our knowledge of the Universe, from standard candles on cosmological scales to iron enrichment of the interstellar medium (ISM) on a local scale. SNe Ia are thought to be the explosions of degenerate carbon-oxygen white dwarfs that undergo a thermonuclear runaway when they reach the Chandrasekhar limit (Hoyle & Fowler, 1960; Nomoto et al., 1984; Hillebrandt & Niemeyer, 2000). Although we currently do not have direct evidence of the progenitor system(s) that leads to type Ia supernovae, a number of possible progenitors have been proposed (see reviews by Howell 2011; Nugent et al. 2011; Blondin et al. 2012).
SN Ia light curves are powered by the decay of 56Ni into 56Co ( = 6.08 days) at early times, and then 56Co into 56Fe ( = 77.2 days) beginning some two months after outburst. Near maximum light, their spectra are characterized by strong permitted lines of intermediate-mass and iron-peak elements (Branch et al., 1993). SNe Ia are believed to undergo a transition from a photospheric phase to a nebular phase as the ejecta become transparent and the spectra are increasingly shaped by iron-group emission features some 70100 days past maximum brightness (Bowers et al., 1997; Branch et al., 2008; Friesen et al., 2014).
The homogeneity in the late-time optical spectra of normal SN Ia suggest a remarkably uniform and repeatable explosion model (Branch et al., 2008). While photospheric phase spectra of SNe Ia are numerous, so called nebular spectra obtained some 70 days or more past maximum light are still fairly rare, with less than 30 SNe Ia with optical spectra past day 200 (Childress et al., 2015). Consequently, the identification and evolution of some features in the nebular phase have not been firmly established.
Differences in late-time feature identification exist in synthetic models which match the observed late-time Ia spectra using: a) only forbidden lines mainly from [Fe II], [Fe III], [Ni II] and [Co III] (Axelrod, 1980; Bowers et al., 1997; Stritzinger et al., 2006; Mazzali et al., 2015; Childress et al., 2015), b) only permitted lines, mostly from Fe II and Cr II (Branch et al., 2008, 2009), or c) both permitted and forbidden lines (Friesen et al., 2014; Blondin et al., 2015). Uncertainty about the true nature of late-time spectral features limits our understanding regarding such parameters as the relative abundances, distribution and expansion velocities of Fe-peak element rich ejecta in SNe Ia.
The identification of even the most prominent feature in optical late-time SN Ia spectra between 4600 and 4700 Å, which dominates the optical and IR regions, is controversial. Maeda et al. (2011) and Silverman et al. (2013) report finding a gradual shift toward longer wavelengths of this feature in many late-time SNe Ia spectra which they interpret as a blueshift of to km s-1 blueshift of a 4701 Å blend of [Fe III] emission lines which decreases to 0 km s-1 when the feature red shifts to 4700 Å by day +300.
However, an [Fe III] blend interpretation has difficulty explaining the position of the feature at very late-times (day 300) when it can appear red-ward of 4700 Å (Pan et al., 2015). In addition, the progressive red shifting of other late-time SN Ia spectral features first reported by Minkowski (1939) has not been explained or adequately addressed in recent late-time SN Ia studies. Instead of a Doppler shift of forbidden line emission, Branch et al. (2009) argue that the 4700 Å feature may be photospheric emission shaped by permitted P-Cygni line absorptions that appear shortly after maximum and persist well into what is conventionally viewed as the nebular phase.
Here we present the results of an investigation of late-time optical spectra of 27 normal SNe Ia at multiple epochs with the goal of better understanding the evolution and nature of late-time spectral features. Our data set and observations are described in §2, results on the changes of central wavelengths for certain late-time features described in §3, with our discussion of these results given in §4. In §5 we discuss several computer model results concerning late-time, blue spectral features of SNe Ia, and summarize our findings and conclusions in §6.
2. Data Set
The centerpiece of our comparative analysis is the normal SN Ia 2011fe, whose post-maximum light phases were extensively observed between days 74 and 348. Our analysis of late-time optical spectral properties includes a compilation of rest-frame nebular SN Ia spectra taken from the literature, on-line databases, and a few new observations described below.
Several publicly available SN databases were used to develop a sample of high-quality, late-time Ia spectra. These databases include the on-line Supernova Spectrum archive (SUSPECT; Richardson et al. 2001), the Weizmann Interactive Supernova Data Repository (WISeREP; Yaron & Gal-Yam 2012), and the UC Berkeley Supernova Database (SNDB) which is a part of the Berkeley SN Ia Program, or BSNIP (Silverman et al., 2012).
Our archival sample of data contains 155 optical, late-time spectra of 26 ostensibly normal SNe Ia observed between days 60 and 400 from SUSPECT, WISeREP, and BISNP, and have been corrected for redshift. Some of the SNe Ia examined here are also included in the late-time samples of Maeda et al. (2010a), Blondin et al. (2012), and Silverman et al. (2013).
2.1. SN 2008Q
Our SN Ia sample includes three nebular observations of SN 2008Q which occurred in NGC 524 (z = 0.00802). A 1200s spectrum was taken on 28 August 2008 (day +203) with the 10m Keck telescope using the Low Resolution Imaging Spectrometer (LRIS). This spectrum was published in the study by Silverman et al. (2013). Two additional 1200s exposures of SN 2008Q presented here were taken on 30 September and 20 December 2008 (days 237 and 318) with the MMT 6.5m using the Blue Channel Spectrograph with the 300 lines mm-1 grating.
2.2. ASASSN-14lp
SN Ia ASASSN-14lp in NGC 4666 (z = 0.00510) was the second brightest SN of 2014, reaching a peak magnitude of V = 11.94 mag on 24 December 2014 with a m15 of 0.79 (Shappee et al., 2015). Moderate resolution spectra (R 20003000) of ASASSN-14lp were taken with exposure times of 2400s and 4000s in March and April 2015 at days 87, 114, respectively, with the MDM 2.4m using the Ohio State Multi-Object Spectrograph (OSMOS). A follow-up 900s spectrum was obtained in May 2015 (day 149) with the South African Large Telescope (SALT) using the Robert Stobie Spectrograph (RSS). Data reduction was done using iraf111IRAF is distributed by the National Optical Astronomy Observatories, which are operated by the Association of Universities for Research in Astronomy, Inc., under cooperative agreement with the National Science Foundation. and consisted of bias and background subtraction, wavelength calibration, aperture extraction, and host galaxy redshift correction.

3. Results
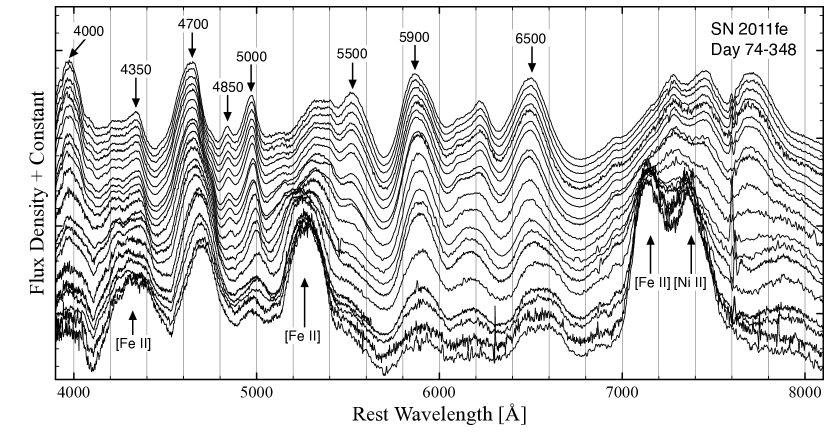
The general evolution of late-time optical SNe Ia spectra is illustrated in the data for SN 2011fe shown in Figure 1. SN 2011fe was well observed at late-times, making it a good case to investigate the late-time spectral evolution of a normal SNe Ia.
As can be seen in this figure, significant changes occur from the early nebular phase at day 74 out to late-times at day 348 (Matheson et al., 2008; Parrent et al., 2014). Some features present at early epochs weaken and fade, while other prominent features do not emerge until much later times.
Below we explore the evolution of a few selected features in the SN 2011fe and other late-time SN Ia spectra, focusing on the 4000 to 6000 Å region since it contains many of the brightest late-time optical features. We begin by investigating apparent red shifts of several late-time, blue spectral features.
3.1. Progressive Red Shifts of Features
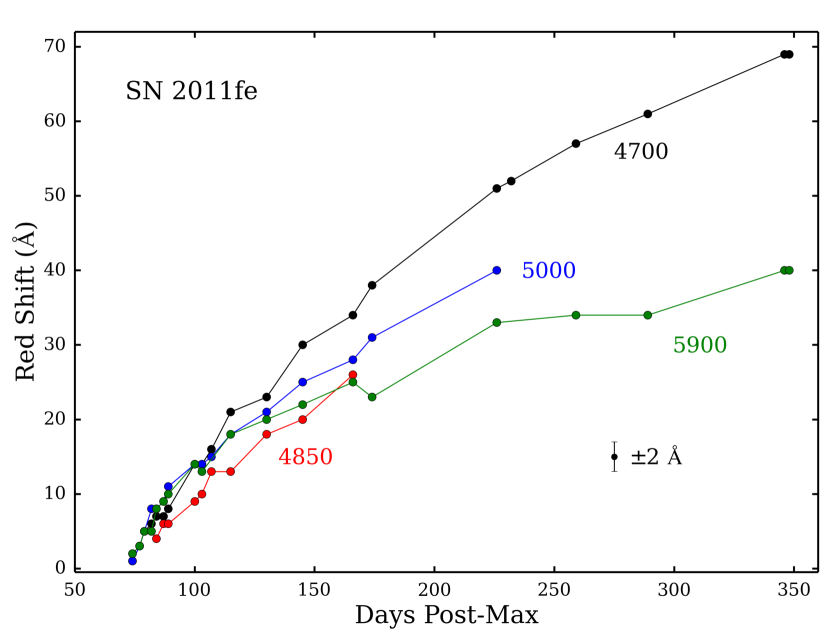
Progressive red shifts in the central wavelengths of four late-time features marked as 4350, 4700, 4850, and 5000 during the nebular phase of the spectra of SN 2011fe can be seen in Figure 2. Vertical lines mark the central wavelengths of these features at day 74. The 4350 Å feature is severely blended making it difficult to accurately measure changes in its central wavelength at late times. Thus, this feature is not included in this study. The other three features can be seen to not only shift toward the red but also move at seemingly similar rates. However, at around day 100 (marked in red) the red side of the 4700 Å feature shows the emergence of some additional emission which appears to play a role in red shifting this feature’s central wavelength. We discuss below the detailed properties and wavelength changes of each of these three features.
3.1.1 The 4700 Å Feature
One of the strongest late-time, optical spectral SN Ia features is seen between 4600 and 4700 Å and has most often been referred to as the 4700 Å feature. It is commonly identified as a blend of [Fe III] lines at 4658, 4702, 4734 Å centered near 4700 Å (Bowers et al. 1997; Mazzali et al. 2015; Childress et al. 2015, and references therein). However, there may be additional contributions from weaker [Fe III] emissions at 4755, 4769, and 4778 Å (Maeda et al., 2010a), [Fe II] 4814 Å (Mazzali et al., 2015), as well as [Co II] 4623 Å (Liu et al., 1997b)
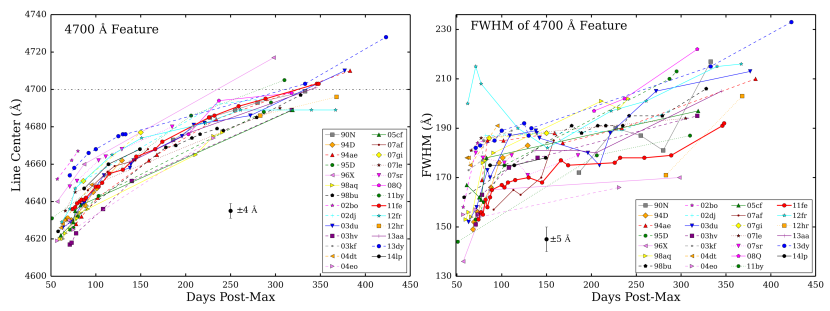
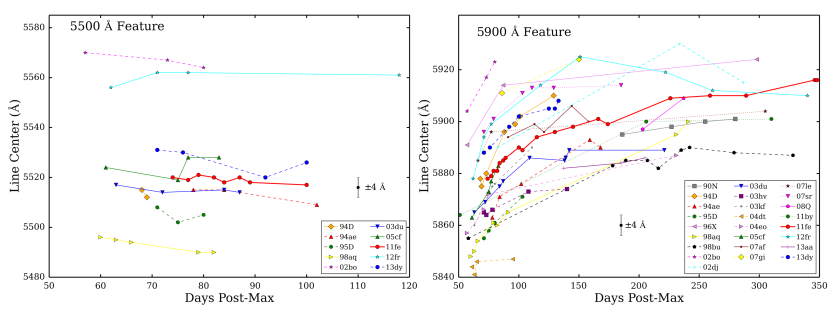
Measured line centers of the 4700 Å feature for the 27 SNe Ia in our sample show a systematic shift to longer wavelengths with time. This is shown in the left panel of Figure 3. In this work, the central wavelengths were measured with an estimated error for low S/N spectra of 4 Å by fitting a Gaussian to the feature using the Spectral Analysis Tool (SPLAT; Draper 2014). A table listing the measured line centers for each supernova can be found in the Appendix.
In the spectra of SN 2011fe, indicated by the thick red line in Figure 3, the feature appears centered around 4635 Å at day 74, shifting steadily towards 4700 Å by day 348. All 26 other SNe Ia in our sample show a similar red shift and rate of wavelength change.
Although the shift is continuous, it is not strictly linear with time. In the early nebular phase of SN 2011fe between days 50 and 125, the 4700 Å feature shifts 0.3 Å per day (20 km s-1 per day), slowing down to a nearly constant rate of 0.2 Å per day (12 km s-1 per day), in agreement with the findings of Maeda et al. (2011) and Silverman et al. (2013). This transition from 0.3 to 0.2 Å per day is not abrupt but occurs gradually during days 100-125. Although few SNe in our sample have spectra past 300 days, we find no indication that the late-time rate of 0.2 Å per day redshift changes past this date.
Along with a progressive red shift, the width of the 4700 Å feature is also seen to increase with time. The broadening of this feature in the spectrum of SN 2011fe can be readily seen in Figure 2. At around day 100, the red side shows the apparent emergence of some additional emission, which is not seen in the other neighboring features. This could explain the steady increase of the 4700 Å feature’s FWHM after day 100.
Measured FWHM values of the 4700 Å feature for all 27 SNe are plotted in the right hand panel of Figure 3. The FWHM was measured using SPLAT with respect to the base of the emission feature as it rises above adjacent continuum with an estimated error of 5 Å. Our values are some 20% to 30% smaller than reported values by Mazzali et al. (1998), Blondin et al. (2012), and Silverman et al. (2013), which is likely due to differences in chosen adjacent flux levels.
For all SNe in our sample, the FWHM of the 4700 Å feature appears to increase relatively rapidly between days 50 and 100, going from 150 to 175 Å (0.5 Å per day). This increase coincides with the feature’s rapid change in central wavelength. At later times, the FWHM continues to increase but at a slower rate of 0.1 Å per day out to day 400.
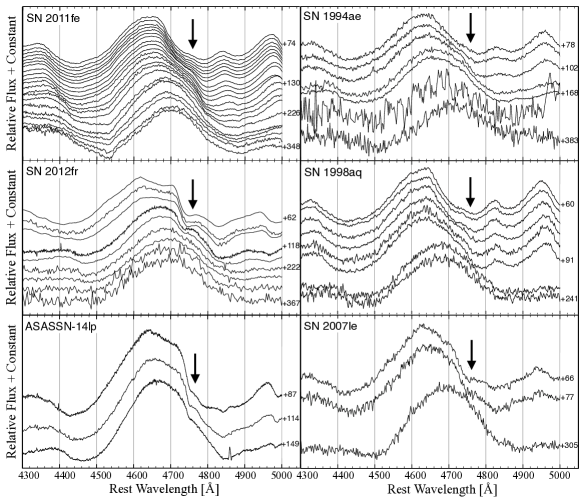
The widening of the 4700 Å feature caused by the emergence of added flux at day 100 may not be uncommon. Examination of other late-time SN Ia spectra in our sample revealed five other SNe exhibiting strong line blending on the red side of the 4700 Å line profile much like that seen in SN 2011fe.
In Figure 4, we show the region around the 4700 Å feature for SN 1994ae, SN 1998aq, SN 2007le, SN 2012fr, and ASASSN-14lp. Arrows mark the same rest wavelength of the additional flux as seen in SN 2011fe. The profile of the 4700 Å feature is strongly asymmetric for several of these SNe before the appearance of the additional red-ward emission. This is especially clear for SN 2012fr and ASASSN-14lp, and significantly influences the FWHM of this feature for SN 2012fr prior to day 100 (see Fig. 3). The emergence of this flux seems to occur earlier in some objects, around day +60 in some cases, compared to SN 2011fe.
3.1.2 The 4850 and 5000 Å Features
In normal late-time SNe Ia spectra, two relatively weak features appear red-ward of the 4700 Å feature, around 4850 and 5000 Å (see Fig. 1). Both emerge as early as day +7 (Matheson et al., 2008; Blondin et al., 2012; Parrent et al., 2014). The 4850 Å feature typically fades by around day +75 to +100, in contrast to the feature at 5000 Å which is a long-lived feature that can be seen out to day +1000 (Taubenberger et al., 2015; Graham et al., 2015). Although the 4850 Å feature has not been previously identified, the stronger feature at 5000 Å has been identified as [Fe II] (Mazzali et al., 2011) or [Fe III] (Mazzali et al., 2015) or a combination of both (Liu et al., 1997b; Bowers et al., 1997; Pastorello et al., 2007).
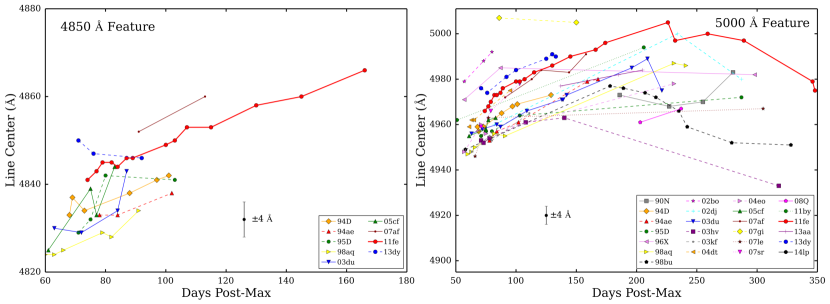
Similar to that seen for the 4700 Å feature, both the 4850 and 5000 Å features move progressively toward longer wavelengths with time, as shown in Figure 2. The 4850 Å feature shifts roughly 0.3 Å per day from day 50 to 100, much like the early red shift seen for the 4700 Å feature. This red shift can be seen in the left hand panel of Figure 5 where in SN 2011fe the feature moves roughly 20 Å between days 74 and 140. The long lived visibility of the 4850 Å feature in SN 2011fe seems to be an exception.
The 5000 Å feature likewise exhibits a substantial redshift where its line center shifts some 40 Å; from 4960 Å at day 74 to 5000 Å at day 200. The motion of this feature in 25 out of the 27 SN Ia from our sample is shown in the right hand panel of Figure 5. Although some SNe Ia were better observed at late-times than others, we estimate a wavelength shift 0.25 Å per day during from day 100 to 200.
After about day 200, the 5000 Å feature appears to stop moving red-ward and, in some cases, broadens with a line center shift toward shorter wavelengths. This apparent motion could signal the presence of weak emission visible only at very late times. The feature’s FWHM remains fairly constant during the early nebular phase with a width of 75 Å (70 days) but then increases to 100 Å at late times (200 days).
The three 4700, 4850, and 5000 Å features appear to drift towards longer wavelengths at virtually the same rate between days 50 to 150. This is shown in Figure 6 where the central wavelength shifts are overlain. While the red shift of these features are nearly identical at early times, the rate of red shift of the 4700 Å feature is relatively larger at later times, likely due to the appearance/disappearance of minor blended features after day 100, as mentioned above.
Finally, unlike the 4700 Å feature, the peaks of the 4850 and 5000 Å features are relatively narrow and do not show any obvious indication of line blending. This suggests that these features are showing a truer evolution of the line velocities compared to the 4700 Å feature. See §4.4 where we discuss the possibility that they are pseudo-emission features due to P-Cygni Fe II absorption and that the observed shift originates from decreasing line velocity and opacity of Fe II.
3.2. Emission at 5900 Å
Like the emission features between 4350 and 5100 Å, the strong late-time emission feature around 5900 Å also shifts to the red but at a significantly different rate. The 5900 Å feature shows a rapid change in wavelength of 0.4 Å per day from early nebular epochs to about day 100. At later times, this rate decreases to 0.1 Å or less per day, just half the rate of the 4700 Å blend. This difference can be seen in SN 2011fe, where its red shift is nearly identical to the 4700 and 5000 Å features but then slows down significantly past day 150 (see Fig. 6).
For many SNe in our sample, including SN 2011fe, the line center of the 5900 Å feature redshifts beyond 5890 Å, which is redward of the wavelengths of both [Co III] 5888 Å and Na I 5890, 5896 Å. In addition, the 5900 Å feature exhibits a larger range of line center wavelengths at a given epoch (see Figure 7).
Whereas the evolution of the 4700 Å feature spans roughly 20 Å for our sample, the 5900 Å feature shows a range of approximately 50 Å. Finally we note that there may be a weak correlation between the range in central wavelengths of the 5900 Å feature and the red/blueshifts seen in the [Fe II] 7155 Å and [Ni II] 7378 Å features noted by Maeda et al. (2010a, b, 2011).
The 5900 Å feature has been conventionally attributed to a blend of [Co III] 5888, 5907 Å along with possibly weak Na I 5890, 5896 Å emission, and recent models suggest that Na I may not significantly shape this feature at all (Dessart et al., 2014b; Childress et al., 2015). However, unlike the strong 4700 Å feature which disappears at very late times (day +500; Taubenberger et al. 2015; Graham et al. 2015), the 5900 Å feature remains present even at very late times (day +980; Graham et al. 2015) appearing at 5880 Å blue-ward of its center wavelength location of 5910 Å at day +350. Since there is little [Co III] expected at such late times, consistent with the decline of [Co III] emission at 6600 Å, some of the observed emission might be due to Na I 5890, 5896 Å emission (Graham et al., 2015).
4. Discussion
Several weeks after maximum, the optical spectra of SNe Ia mainly consist of strong features around 4000, 4600, 5900, 7400 and 8700 Å. The 4000 Å feature has been attributed to either P-Cygni Ca II H & K emission and/or [S II] 4072 Å while most of the other features have typically been attributed to forbidden lines of [Fe II], [Fe III], [Co II], and [Co III] (Bowers et al., 1997; Maeda et al., 2010a; Silverman et al., 2013; Mazzali et al., 2015). One year after maximum brightness, strong [Fe II] line blends at 4370, 5270, 7155, and 8617 Å plus emission from [Ni II] 7378 Å appear in the optical spectrum (see Fig. 1).
Nebular SN Ia spectra have most often been interpreted as mainly composed of forbidden lines of iron and cobalt (Meyerott, 1978, 1980; Axelrod, 1980; Branch, 1990) and early spectral modeling supported this idea with models that generated moderately good fits to observed spectra lines (e.g., SN 1991T; Spyromilio et al. 1992). Late-time spectral studies have shown the importance of optical and near-IR [Co II] and [Co III] lines and the dominance of singly and doubly ionized Fe in late-time SN Ia spectra up to at least day 300 (Bowers et al., 1997; Penney & Hoeflich, 2014; Childress et al., 2015).
However, because optical spectra of SNe Ia suffer from severe line blending, obtaining robust line profile measurements and accurate line identifications of some features has been difficult. This is true even at very late times and has led to studies focusing on the much fainter near-infrared (NIR) lines of [Fe II] and [Co II], which are more isolated and relatively unblended even when highly Doppler broadened.
The difficulty of determining firm line identifications for strong line blended, late-time optical features of SNe Ia has led to significant differences among several synthetic spectral models (e.g., Bowers et al. 1997; Blondin et al. 2015; Branch et al. 2009; Friesen et al. 2014). This, in turn, has naturally led to some uncertainty in the true composition of late-time optical SN Ia spectra. Furthermore, the lack of an explanation for the underlying cause for the large and progressive wavelength shifts of some late-time features seen in SN Ia spectra discussed above only adds to the problem of securing robust feature identification. Below we discuss the implications of the results of our study of late-time optical features in SN Ia spectra.
4.1. Previous Post-Maximum Red Shift Interpretations
Recent investigations of the nebular phase spectra of SNe Ia has revealed that certain features exhibit significant but fixed blue or red rest wavelength offsets (Mazzali et al., 1998; Motohara et al., 2006; Gerardy et al., 2007; Maeda et al., 2010a, b; Mazzali et al., 2015). This includes the late-time optical emission lines [Fe II] 7155 Å and [Ni II] 7378 Å (see Fig. 1). Such steady displacements of [Fe II] and [Ni II] emissions have been interpreted as Doppler shifts of up to 2000 km s-1 resulting from differences in viewing angles stemming from asymmetrical iron peak element rich ejecta in the center of the expanding SN debris (Maeda et al., 2011).
However, viewing angle cannot explain the progressive and universal line center red shifts seen for the 4700, 4850, and 5000 Å features in our SN Ia sample as discussed above. If the observed shifts were due to viewing angle, one would expect that all features in the late-time spectra would show red or blue shifts, a phenomena that is not observed.
Large red shifts for the 4700, 4850, and 5000 Å features in post-maximum SN Ia was first noted and described by Minkowski in a report on the late-time spectral evolution of the very bright and now recognized prototypical Ia event, SN 1937C in IC 4182, along with SN 1937D in NGC 1003 and two other SNe. He noted that below 5000 Å late-time SN Ia spectrum consists of several bands which shift “as a whole, gradually toward the red without any significant changes in its intensity distribution” (Minkowski, 1939). He also noticed a shift of the 5900 Å feature shift, though not to the extent shown here.
Minkowski further noted that the red shifts of four features at 4350, 4600, 4850, and 5000 Å to be large and virtually identical in the spectra of his four best studied SNe.222A pseudo 3D graphical representation showing Minkowski’s measured wavelengths of emission features with respect to post-maximum phase for SN 1937C in IC 4182 using shaded bands to indicate changes in intensity can be found in Zwicky (1965). Measured from maximum light, the especially broad and strong 4600 Å feature seen in SN 1937C moved from 4575 Å to around 4700 Å between day 0 and +339, amounting to a wavelength shift of some 125 Å.
Subsequent late-time nebular spectra of other SNe Ia made by a number of other observers confirmed Minkowski’s claim of progressive red shifting of features between 4000 and 5000 Å (Rosino & Bertola, 1960; van den Bergh & Henry, 1961; Bertola, 1962, 1965; Chincarini & Margoni, 1964; Kikuchi, 1971; Kirshner et al., 1973; Barbon et al., 1982). However, a detailed analysis of late-time spectra of the especially bright SN Ia event 1972E in NGC 5253 seem to show only the 4600 Å feature to drift in wavelength, with all other features fixed in wavelength (Kirshner et al., 1973).
Minkowski found that the size and rate of wavelength shifts of the four blue spectral features was so strikingly similar at a given post-maximum phase that he believed wavelengths measurements of these features could be used to accurately estimate when a supernova had reached its maximum brightness. This notion was actually employed by several subsequent observers for SNe Ia with poorly observed light curves.
Interestingly, few studies published between 1985 and 1995 on late-time SNe Ia spectra remark on the varying central wavelength of these blue spectral features. In fact, many late-time spectral studies make no mention of prior observations concerning progressive red shifting of any features. For example, in their analysis of fixed Doppler displacements of the [Fe II] and [Ni II] features in late-time spectra interpreted as due to view angle effects, Maeda et al. (2010a) state that the 4700 Å feature showed no Doppler shift away from an assumed [Fe III] blend at 4701 Å.
In subsequent papers, however, Maeda et al. (2011) reported a large red shift of the 4700 Å feature which they interpreted as a large initial blueshift velocity. They argued that in early nebular phases, the 4700 Å [Fe III] blend exhibits a blueshifted of some to km s-1 in SNe Ia which then steadily decreases to 0 km s-1 by day +200. Silverman et al. (2013) reported similar findings, noting the decrease in the assumed blueshift velocity was both slow and approximately linear with time, amounting to 10 to 20 km s-1 per day. In a late-time study of SN 2013dy, Pan et al. (2015) reported the [Fe III] 4700 Å emission blend to be redshifted by 1300 km s-1 at day +423. None of these studies offered an explanation for either the large initial blueshift of the 4700 Å feature or its change over to a redshift at very late times.
4.2. The Nature of the Progressive Red Shifts
Minkowski (1939) wrote at length concerning possible causes for the progressive and uniform post-max red shifts of blue spectral features he saw in the late-time spectra of SN 1937C and other type I supernovae. Although most red spectral features underwent significant changes in intensity with time, he noted that they showed no systematic change in their wavelengths like that seen in the blue. He concluded that a Doppler or gravitation effect was possibly responsible but cautioned that “no attempt at identification of the bands in the blue can give conclusive results so long as an explanation for the red shift is lacking”.
Payne-Gaposchkin & Whipple (1940) viewed the red shift as likely the result of increased ionization of the expanding material with time. Minkowski (1941) disagreed. McLaughlin (1963) puzzled over the nearly uniform patten of red shifting features and wondered if it was simply the result of decreasing blueshifted absorption features on a background continuum, but gave no details. While Mustel (1971) agreed that a steady red shift could result from the gradual deceleration of absorption lines, he argued that if true such a similar shift would then be expected for red features, contrary to the observations. He noted that the spectrum below 5000 Å likely contains highly complex blends, making the drawing of any kind of simple conclusions hazardous.
Meyerott (1978) suggested that the red shifts was simply a transparency effect (see also Friesen et al. 2012). That is, during the early post-maximum epochs emission lines such as from [Fe III] would only be observable from the approaching expanding hemisphere resulting in a blueshifted Doppler line which would be seen to decrease with time, in accord with observations.
4.2.1 Red Shifting of the 4700 Å Feature
As the strongest feature in the nebular phase, the 4700 Å feature naturally attracted special attention in many studies of late-time SN Ia spectra. Below we address the nature of the progressive red shifted feature by first discussing the properties of this feature.
Interpreting it as due to [Fe III] emission, Kuchner et al. (1994) used it to calibrate the decay timescale of [Co III] 5888, 5907 Å by means of the 4600/5900 flux ratio. Later, Mazzali et al. (1998) and Blondin et al. (2012) suggested its FWHM was anti-correlated with (B). However, this has been questioned by Mazzali & Hachinger (2012) and Silverman et al. (2013), and our investigation shows that the FWHM of the 4700 features varies with time, further undermining such a correlation.
For SN 2011fe, the red shift of the 4700 Å feature is substantial, amounting to 60 Å between days +70 to +350. As already noted above, while this feature has been widely attributed to mainly a blend of [Fe III] emission lines, there have been other identifications proposed.
In an attempt to model the late-time spectrum of the type Ia event SN 1994D, Liu et al. (1997a) found generally good agreement concerning the 4700 Å feature which they viewed as chiefly due to a blend of [Fe III] emission. However, because its observed strength was much stronger than the predicted spectrum before day +200, this led them to suspect other emissions might be contributing to this feature’s strength in early nebular phases.
Consequently, Liu et al. (1997b) proposed that the 4700 Å feature contained a significant contribution from radioactive Co on the feature’s blue side due to [Co II] 4623 Å emission. They suggested that as this Co line emission decayed with time, the central wavelength of the 4700 Å blend loses a strong contribution at bluer wavelengths, effectively pushing the blend of Co and Fe emission lines red-ward as observed.
In this way, their emission model can help explain the initial rapid 0.3 Å per day shift of the 4700 Å feature that is observed. The decreasing contribution from [Co II] 4623 Å, coupled with strengthening [Fe III] 4658 Å, will cause the feature to move to redder wavelengths more rapidly than compared to the other features until [Co II] emission no longer dominates the blue side of the 4700 Å feature.
Maeda et al. (2010a) noted that the 4700 Å feature showed no Doppler shift away from the presumed [Fe III] blend at 4701 Å and that the observed change in wavelength is caused by either blending due to Mg I] 4571 Å or a “radiation transfer effect”. They argued that the absence of a Doppler shift of the 4700 Å feature, in contrast to the displacement of the [Fe II] 7155 Å line emission, was consistent with a picture where outer, low density and higher ionization Fe++ zone in SNe Ia was more spherically symmetric.
Although attributing the 4700 Å feature to a blend of the D4,3,2 – F4,3,2 4658, 4702, and 4734 Å [Fe III] lines would seem quite likely given the strong presence of [Fe II] in very late-time nebular spectra, identifying the feature as mainly due to [Fe III] is not without difficulty. The strongest optical [Fe III] feature is the 4658 Å emission line and is always observed stronger than the combined strength of the [Fe III] lines 4702 Å and 4734 Å lines in both photoionzied H II regions (Esteban et al., 2004, 2013) and in the shock heated environment of supernova remnants (Fesen & Hurford, 1996), in agreement with theoretical predictions (Keenan et al., 1992, 2001; Deb & Hibbert, 2009). It is therefore surprising that the feature does not appear more asymmetric toward the blue at late-times.
Moreover, we find no evidence that the rate of change in the feature’s central wavelength is slowing down or stopping at 4700 Å in our 27 SN sample. Instead, the feature appears at wavelengths greater than 4700 Å for some SNe Ia at very late-times, e.g., SN 2013dy at 4728 Å at 423 days (see Fig. 3). At such late-times, the supposed [Fe III] blend is then centered more than 50 Å away from the strong [Fe III] 4658 Å line.
This does not mean that [Fe III] is absent from this feature. Late-time nebular spectra contains strong emission from [Fe II] (see Fig. 1), so it is reasonable for some [Fe III] emission to also be present. However, it appears that [Fe III] is not the main source for the 4700 Å feature’s intensity and central wavelength.
It is clear from our investigation that some of the observed redshifting of the 4700 Å feature may also be due to the emergence of additional emission on the red side starting around day 100. This added emission, which may not be uncommon (see Fig. 4), may also be responsible for the evolution of the 4700 Å feature’s width where it steadily increases. Additional [Fe III] emission lines at 4755, 4769, and 4778 Å may be responsible for some of this emission as suggested by Maeda et al. (2010a), but these relatively weak lines and would be expected to appear simultaneously with other [Fe III] lines.
4.2.2 Red Shifts of Other Nebular Features
Whatever the nature of the red-ward motion for the 4700 Å feature, neither the decay of [Co II] 4623 Å emission or a decreasing blueshift of a blend of [Fe III] line emission can easily explain the origin of the similar redshifting for neighboring features, namely those at 4850 and 5000 Å. Despite their near universal presence in late-time SNe Ia spectra, the 4850 Å feature is usually left unidentified, while the 5000 Å has been attributed to [Fe II] and/or [Fe III].
Although the 5900 Å feature also shifts towards longer wavelengths with time, it does so at a different rate than the blue spectral features at late times. After day 100 the emission drifts red-ward at half the rate of the 4700, 4850, and 5000 Å features. This suggests the cause of its red shift may be different than that seen in the blue. In addition, the central wavelength of the 5900 Å feature varies significantly across our sample of SN Ia, spanning 50 Å versus the 20 Å exhibited by the 4700 Å feature at the beginning of the nebular phase.
A slower red shift evolution might support the notion that this feature is primarily due to [Co III] 5888 Å (Dessart et al., 2014b). However, the line center evolves red-ward of 5888 Å after day 200, possibly indicating either the emergence of additional line emission, or an effect of a transparent, continuum-emitting core (Friesen et al., 2012).
It is interesting to note that some features that have been attributed to forbidden cobalt emission show no significant red shifts. For example, early nebular epochs show a strong emission at 5550 Å feature possibly from [Co II] 5544 Å (Liu et al., 1997b) which at late times blends with the broader 5300 Å feature as it decays. Prior to blending with the neighboring 5300 Å feature, the 5550 Å emission region shows little change in wavelength, as shown in the left panel of Figure 7. However, if the 5550 and 5900 Å features are both chiefly due to forbidden Co emission, it is strange that the 5900 Å feature drifts while the 5550 Å feature does not.
4.3. Progressive Red Shifts in Models of Late-Time SN Ia Spectra
Synthetic models provide a powerful avenue of investigation into late-time spectra of SN Ia, and in particular the phenomenon of the red-ward drifting features. Realistic models must be able to account for the movement of some features, the lack of movement of others, as well as include weak features like those of 4850 and 5000 Å, all of which is no easy task.
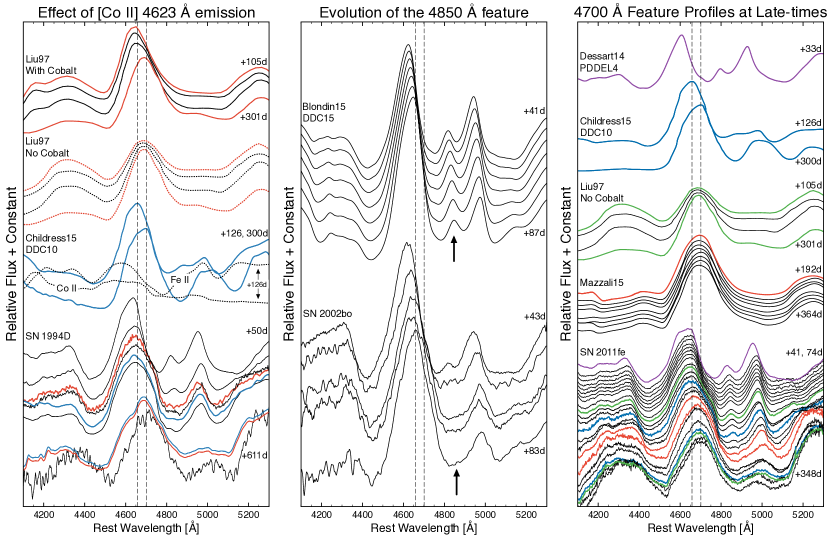
In Figure 8, late-time spectra of three SN Ia are plotted covering the 4100 to 5300 Å region and a sample of accompanying models. These SN include: SN 1994D (Patat et al., 1996; Gómez & López, 1998; Blondin et al., 2012), SN 2002bo (Benetti et al., 2004; Blondin et al., 2012; Silverman et al., 2012), and SN 2011fe (Pereira et al., 2013; Mazzali et al., 2014, 2015).
The five models shown in this figure include: a sub-Mch model with and without Co emission computed by Liu et al. (1997b) for SN 1994D; the delayed-detonation model, DDC10, on days 126 and 300, which were discussed in Childress et al. (2015) in comparison to SN 2011fe and 2012fr (see also Blondin et al. 2013); the delayed-detonation model, DDC15, from day 53 to day 104, which was favored by Blondin et al. (2015) for the broad-lined SN Ia 2002bo; the day 50 spectrum of the pulsational-delayed detonation (PDD) model, PDDEL4, which was favored by Dessart et al. (2014a) for SN 2011fe; and the late-nebular series produced by Mazzali et al. (2015) from a Mch-mass model for SN 2011fe. Spectra and models at similar epochs have been highlighted in Figure 8 for clarity.
While the emission between 4600 and 4700 Å is the strongest optical feature at late times, its progressive line center motion, increasing width, emergence of blended emission around day 100, and strong blending make this feature particularly difficult to model. Furthermore, the models shown in Figure 8 each have different prescriptions regarding the rate and reasons for the evolution of the 4700 Å feature.
The models computed by Liu et al. (1997b) (left panel), Blondin et al. (2015) (center panel), and Childress et al. (2015) (right panel) appear to capture the observed evolution of the 4700 Å feature as it moves red-ward with rates of roughly 0.23, 0.42, and 0.20 Å per day, respectively. Although, while these models show red shifts similar to that actually observed, the origins of the shift differ in terms of spectral decomposition.
For the Liu et al. model, the red-ward drift is primarily caused by both decreasing emission from [Co II] 4623 Å and increasing emission from lines of [Fe III]. This appears to be the case for the 4700 Å feature for both the Blondin et al. and Childress et al. models, in addition to minor contributions from permitted and/or forbidden Fe II emission. However, these models fail to reproduce the evolution of 4850 and 5000 Å features, which presumably stem from signatures of iron.
In contrast, the computed spectra of Mazzali et al. (2015), where the 4700 Å feature is dominated by [Fe III] emission at all epochs, does not show the redward progression from 4658 Å to 4701 Å. Instead, the peak of the 4700 Å feature oscillates up to 10 Å about 4701 Å.
Curiously, compared to the broad peak of the 4700 Å feature for SN 2011fe on day 41, the same region for the PDDEL4 model does not appear broad enough, suggesting an absence of unknown emission (see right panel of Fig. 8). Similarly, the peak of the 4700 Å feature for the DDC10 model on day 300 is asymmetric and leans toward 4701 Å. This exact shape is not observed for SN 2011fe during this phase, but this emission structure is possibly seen for SN 1994D.
Nevertheless, Figure 8 reveals that models without a significant contribution from P-Cygni Fe II and [Co II] 4623 Å emission show no drifting, while models that include contribution from Fe II and [Co II] not only predict a red-ward shifting 4700 Å feature, but appear to shift at the same rate as observed. Thus, an association between an [Fe III] emission blend at 4701 Å and the peak would appear weak. Given also the lack of significantly blue-shifted lines of Fe emission in the computed spectra of Liu et al. (1997b) between days 105 and 301, we find the 4700 Å feature cannot be used to infer evolving line-velocities of Fe.
As noted above, the minor features near 4850 Å and 5000 Å are generally not accurately predicted by late-time models. Of the models shown, only those of Dessart et al. (2014a) and Blondin et al. (2015) reasonably produce these features (see center and right panels of Fig. 8). Spectra for the corresponding PDDEL4 model have only been computed out to day 33, but we suspect the evolution of the 4850 Å is similar to that of the DDC15 model (Dessart et al., 2014a; Blondin et al., 2015).
The DDC15 model includes the constant red-ward drift seen in the 4700, 4850, and 5000 Å features. However, despite its prominence in this model, the 4850 Å feature, indicated by the arrows in Figure 8 is not strongly observed in SN 2002bo. Other broad-lined SNe Ia similarly reveal an apparent lack of this 4850 Å feature roughly two months since maximum light (see Figs. 811 of Parrent et al. 2014). Instead, the model from Blondin et al. (2015) predicts that these features shift in time with little change in relative line strengths between the 4850 and 5000 Å features.
4.4. Permitted Lines at Late-times?
While synthetic spectra built primarily from forbidden lines have been able to predict some aspects of observed spectra during late-nebular epochs, P-Cygni Fe II absorption features and forbidden emission may be present during the first couple hundred days post-maximum light. In fact, the models in Figure 8 that best recreate the observed late-time spectra include both permitted and forbidden lines (Blondin et al., 2015). A few other models also show that the NIR and optical features can be shaped, in part by, permitted lines (Friesen et al., 2014; Branch et al., 2008, 2009).
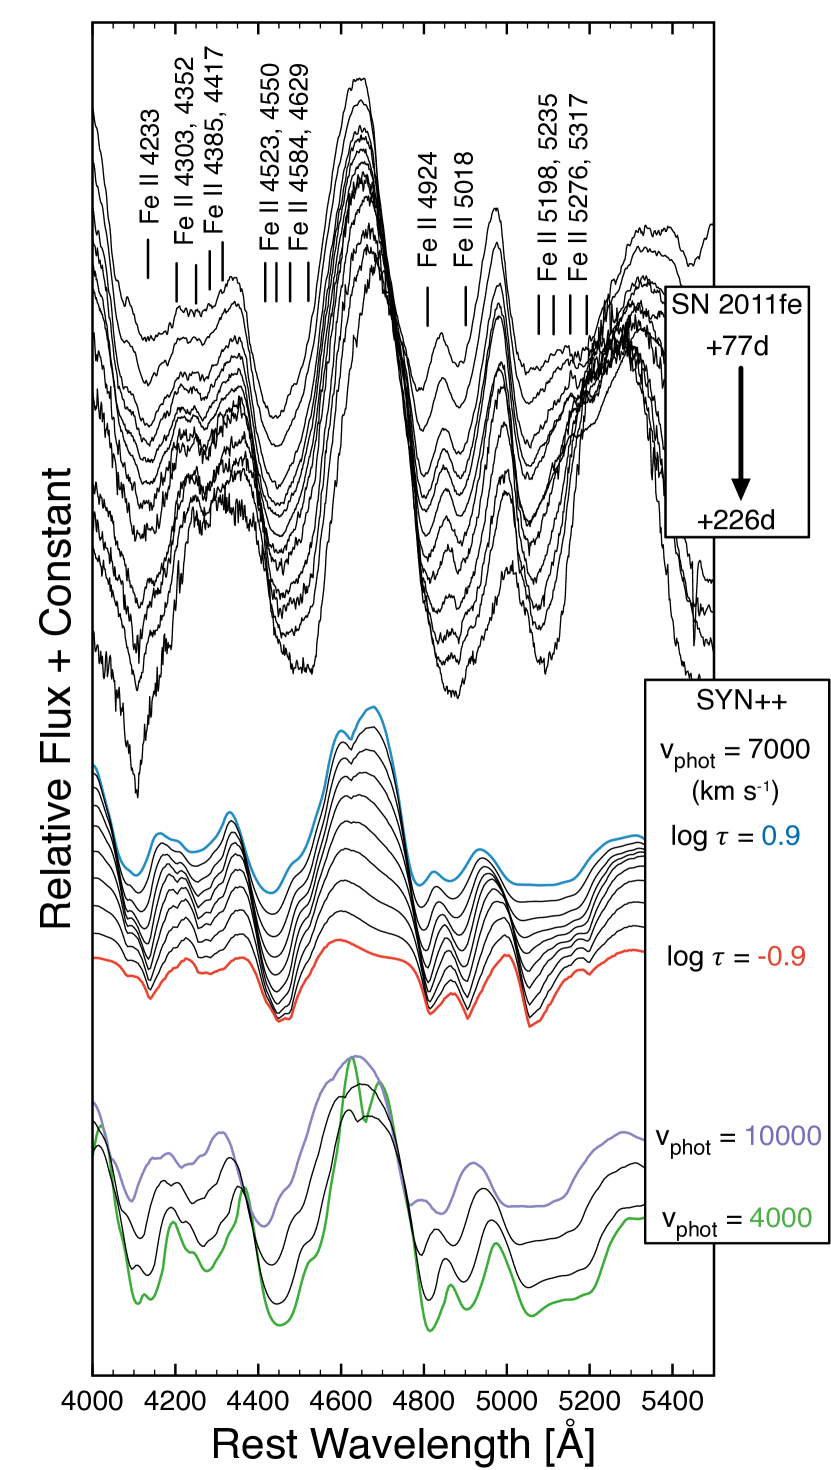
To examine the presence of permitted lines as a means of explaining some of the features and phenomena seen in late-time spectra, a simple spectral model was computed using SYN++ (Thomas et al., 2011). Figure 9 shows the late-time spectra of SN 2011fe compared to two toy models created with SYN++ using only permitted Fe II P-Cygni profiles. The first model, shown in the center of the figure, varied opacity with time while maintaining a constant photospheric velocity of 7000 km s-1. The second model, shown at the bottom of the figure, varied the velocity of the photosphere from 10,000 km s-1 to 4000 km s-1 while successively increasing the opacity to maintain relative line strengths.
Since both SYN++ models contain only permitted lines of Fe II, we caution that these computed spectra are not meant to be representative of the entire late-time evolution, as most features consist of blends, particularly for the 4700 Å. Rather, this exercise shows that not only can the two minor features at 4850 and 5000 Å be reproduced with the use of only permitted lines, but that the red-ward motion of these features can also be recreated through Doppler velocities and/or decreasing opacities.
As suggested by previous works, line velocities can be invoked to explain the red-ward motion of select features (Maeda et al., 2010a, 2011; Silverman et al., 2013). Using SYN++, in Figure 9 we show that a change in bulk line velocities of Fe II, starting near 10,000 km s-1 and evolving down to 4000 km s-1, can be used to follow the line centers for select features. However, under an assumption of a sharp photosphere, decreasing opacity for a fixed expansion velocity can also cause most features, e.g., near 4850 and 5000 Å, to shift to the red.
By reducing the opacity over time, our simplified SYN++ model with a sharp photosphere can mimic a red-ward evolution for both 4850 and 5000 Å features. Under the assumption of a transparent, continuum-emitting core, the emission peak of a profile is also predicted to move red-ward of the rest wavelength (Friesen et al., 2012). This suggests that the spectral evolution of some late-time features may be significantly influenced by declining opacities (Branch et al., 2008; Friesen et al., 2012).
5. Conclusions
We have compiled a sample of 27 normal SN Ia with a total of 160 spectra and plotted the central wavelength of the 4700, 4850, 5000, 5500, and 5900 Å features with respect to maximum brightness. We propose that the ubiquitous red shift of these common late-time, nebular SN Ia spectral features is not mainly due to a decrease in a blueshift of forbidden Fe lines as has been proposed but the result, in part, of decreasing velocity and/or opacity of P-Cygni Fe absorption. Specific findings of our study are the following:
(1) The late-time SN Ia spectral features at 4700, 4850, and 5000 Å all move to the red and do so at roughly the same rate from day +50 out to at least day +300. Such progressive red shifts appear characteristic of all normal Type Ia SNe and is key in understanding their correct identifications.
(2) The 4700 Å feature shows an initial red shift of 0.3 Å per day at the beginning of the nebular phase, slowing to a rate of 0.2 Å per day. This rate is maintained out to very late times (day 300+) with no indication of slowing down, contrary to expectations if due to an initial blueshift velocity of an [Fe III] blend centered at 4701 Å.
(3) The initial rapid shift seen in the 4700 Å feature is likely due to the decay of [Co II] 4623 Å and the strengthening of [Fe III] 4658 Å. However, our models of permitted Fe II absorption suggest that [Fe III] is not the main source for the 4700 Å feature’s intensity and central wavelength for all epochs during late-nebular phases. This does not imply that [Fe III] is absent from this feature, but rather that the contributions from [Fe III], as well as possibly [Fe II] and [Co II], are weaker than previous models suggest.
(4) The FWHM of the 4700 Å feature is found to increase significantly with time. Part of this increase appears to be due to the emergence of additional flux on its red side, and this increase may not be uncommon in SNe Ia. In contrast, however, the widths of the 4850 and 5000 Å features do not change until very late and show no evidence of blending.
(5) The feature at 5900 Å also shows a shift to the red, though not at the same rate as the three bluer features at late times. This feature moves at roughly 0.4 Å per day or less, slowing to about 0.1 Å after day 100. We find that this feature exhibits a large range in central wavelengths across our SN sample at both early and late times.
To better understand the evolution and composition of late-time SN Ia spectra, including the relative abundances and expansion velocities of the Fe-peak element rich ejecta, future theoretical models must take into account the observed red shifts of blue nebular features described here. Illustrating the limits of our comprehension of late-time spectral features are the large and currently mysterious red shifts of several optical features reported in the very late-time spectrum of the bright SN Ia event, SN 2011fe, out to day 1000 (Taubenberger et al., 2015; Graham et al., 2015). Investigating the cause behind the phenomenon of late-time red shifting will hopefully lead to better insights into the nature of the nebular phase of SNe Ia.
References
- Axelrod (1980) Axelrod, T. S. 1980, Ph.D. Thesis California Univ.
- Barbon et al. (1982) Barbon, R., Ciatti, F., Rosino, L., Ortolani, S., & Rafanelli, P. 1982, A&A, 116, 43
- Benetti et al. (2004) Benetti, S., Meikle, P., Stehle, M., et al. 2004, MNRAS, 348, 261
- Bertola (1962) Bertola, F. 1962, Mem. Soc. Astron. Italiana, 33, 77
- Bertola (1965) —. 1965, Mem. Soc. Astron. Italiana, 36, 299
- Blondin et al. (2015) Blondin, S., Dessart, L., & Hillier, D. J. 2015, MNRAS, 448, 2766
- Blondin et al. (2013) Blondin, S., Dessart, L., Hillier, D. J., & Khokhlov, A. M. 2013, MNRAS, 429, 2127
- Blondin et al. (2012) Blondin, S., Matheson, T., Kirshner, R. P., et al. 2012, AJ, 143, 126
- Bowers et al. (1997) Bowers, E. J. C., Meikle, W. P. S., Geballe, T. R., et al. 1997, MNRAS, 290, 663
- Branch (1990) Branch, D. 1990, Spectra of supernovae. (New York: Springer-Verlag), 30–58
- Branch et al. (2009) Branch, D., Dang, L. C., & Baron, E. 2009, PASP, 121, 238
- Branch et al. (1993) Branch, D., Fisher, A., & Nugent, P. 1993, AJ, 106, 2383
- Branch et al. (2008) Branch, D., Jeffery, D. J., Parrent, J., et al. 2008, PASP, 120, 135
- Childress et al. (2015) Childress, M. J., Hillier, D. J., Seitenzahl, I., et al. 2015, MNRAS, 454, 3816
- Chincarini & Margoni (1964) Chincarini, G., & Margoni, R. 1964, Mem. Soc. Astron. Italiana, 35, 129
- Deb & Hibbert (2009) Deb, N. C., & Hibbert, A. 2009, Journal of Physics B: Atomic, Molecular and Optical Physics, 42, 065003
- Dessart et al. (2014a) Dessart, L., Blondin, S., Hillier, D. J., & Khokhlov, A. 2014a, MNRAS, 441, 532
- Dessart et al. (2014b) Dessart, L., Hillier, D. J., Blondin, S., & Khokhlov, A. 2014b, MNRAS, 439, 3114
- Draper (2014) Draper, P. W. 2014, SPLAT: Spectral Analysis Tool, Astrophysics Source Code Library, ascl:1402.007
- Esteban et al. (2013) Esteban, C., Carigi, L., Copetti, M. V. F., et al. 2013, MNRAS, 433, 382
- Esteban et al. (2004) Esteban, C., Peimbert, M., García-Rojas, J., et al. 2004, MNRAS, 355, 229
- Fesen & Hurford (1996) Fesen, R. A., & Hurford, A. P. 1996, ApJS, 106, 563
- Friesen et al. (2012) Friesen, B., Baron, E., Branch, D., et al. 2012, ApJS, 203, 12
- Friesen et al. (2014) Friesen, B., Baron, E., Wisniewski, J. P., et al. 2014, ApJ, 792, 120
- Gerardy et al. (2007) Gerardy, C. L., Meikle, W. P. S., Kotak, R., et al. 2007, ApJ, 661, 995
- Gómez & López (1998) Gómez, G., & López, R. 1998, ApJ, 115, 1096
- Graham et al. (2015) Graham, M. L., Nugent, P. E., Sullivan, M., et al. 2015, MNRAS, 454, 1948
- Hillebrandt & Niemeyer (2000) Hillebrandt, W., & Niemeyer, J. C. 2000, Annual Review of A&A, 38, 191
- Howell (2011) Howell, D. A. 2011, Nature Communications, 2, 350
- Hoyle & Fowler (1960) Hoyle, F., & Fowler, W. A. 1960, ApJ, 132, 565
- Keenan et al. (2001) Keenan, F. P., Aller, L. H., Ryans, R. S. I., & Hyung, S. 2001, Proc. Natl. Acad. Sci. U. S. A., 98
- Keenan et al. (1992) Keenan, F. P., Berrington, K. A., Burke, P. G., et al. 1992, ApJ, 384, 385
- Kikuchi (1971) Kikuchi, S. 1971, PASJ, 23, 593
- Kirshner et al. (1973) Kirshner, R. P., Oke, J. B., Penston, M. V., & Searle, L. 1973, ApJ, 185, 303
- Kuchner et al. (1994) Kuchner, M. J., Kirshner, R. P., Pinto, P. A., & Leibundgut, B. 1994, ApJ, 426, L89
- Liu et al. (1997a) Liu, W., Jeffery, D. J., & Schultz, D. R. 1997a, ApJ, 483, L107
- Liu et al. (1997b) Liu, W., Jeffery, D. J., Schultz, D. R., et al. 1997b, ApJ, 489, L141
- Maeda et al. (2010a) Maeda, K., Taubenberger, S., Sollerman, J., et al. 2010a, ApJ, 708, 1703
- Maeda et al. (2010b) Maeda, K., Benetti, S., Stritzinger, M., et al. 2010b, Nature, 466, 82
- Maeda et al. (2011) Maeda, K., Leloudas, G., Taubenberger, S., et al. 2011, MNRAS, 413, 3075
- Matheson et al. (2008) Matheson, T., Kirshner, R. P., Challis, P., et al. 2008, AJ, 135, 1598
- Mazzali et al. (1998) Mazzali, P. A., Cappellaro, E., Danziger, I. J., Turatto, M., & Benetti, S. 1998, ApJ, 499, L49
- Mazzali & Hachinger (2012) Mazzali, P. A., & Hachinger, S. 2012, MNRAS, 424, 2926
- Mazzali et al. (2011) Mazzali, P. A., Maurer, I., Stritzinger, M., et al. 2011, MNRAS, 416, 881
- Mazzali et al. (2014) Mazzali, P. A., Sullivan, M., Hachinger, S., et al. 2014, MNRAS, 439, 1959
- Mazzali et al. (2015) Mazzali, P. A., Sullivan, M., Filippenko, A. V., et al. 2015, MNRAS, 450, 2631
- McLaughlin (1963) McLaughlin, D. B. 1963, PASP, 75, 133
- Meyerott (1978) Meyerott, R. E. 1978, ApJ, 221, 975
- Meyerott (1980) —. 1980, ApJ, 239, 257
- Minkowski (1939) Minkowski, R. 1939, ApJ, 89, 156
- Minkowski (1941) —. 1941, PASP, 53, 224
- Motohara et al. (2006) Motohara, K., Maeda, K., Gerardy, C. L., et al. 2006, ApJ, 652, L101
- Mustel (1971) Mustel, É. R. 1971, Soviet Ast., 15, 1
- Nomoto et al. (1984) Nomoto, K., Thielemann, F. K., & Yokoi, K. 1984, AJ, 286, 644
- Nugent et al. (2011) Nugent, P. E., Sullivan, M., Cenko, S. B., et al. 2011, Nature, 480, 344
- Pan et al. (2015) Pan, Y. C., Foley, R. J., Kromer, M., et al. 2015, MNRAS, 452, 4307
- Parrent et al. (2014) Parrent, J., Friesen, B., & Parthasarathy, M. 2014, Ap&SS, 351, 1
- Pastorello et al. (2007) Pastorello, A., Mazzali, P. A., Pignata, G., et al. 2007, MNRAS, 377, 1531
- Patat et al. (1996) Patat, F., Benetti, S., Cappellaro, E., et al. 1996, MNRAS, 278, 111
- Payne-Gaposchkin & Whipple (1940) Payne-Gaposchkin, C., & Whipple, F. L. 1940, Proc. Natl. Acad. Sci. U. S. A., 26, 264
- Penney & Hoeflich (2014) Penney, R., & Hoeflich, P. 2014, ApJ, 795, 84
- Pereira et al. (2013) Pereira, R., Thomas, R. C., Aldering, G., et al. 2013, A&A, 554, A27
- Richardson et al. (2001) Richardson, D., Thomas, R. C., Casebeer, D., et al. 2001, American Astronomical Society, 199, 1428
- Rosino & Bertola (1960) Rosino, L., & Bertola, F. 1960, Mem. Soc. Astron. Italiana, 31, 451
- Shappee et al. (2015) Shappee, B. J., Piro, A. L., Holoien, T. W. S., et al. 2015, arXiv:1507.04257
- Silverman et al. (2013) Silverman, J. M., Ganeshalingam, M., & Filippenko, A. V. 2013, MNRAS, 430, 1030
- Silverman et al. (2012) Silverman, J. M., Foley, R. J., Filippenko, A. V., et al. 2012, MNRAS, 425, 1789
- Spyromilio et al. (1992) Spyromilio, J., Meikle, W. P. S., Allen, D. A., & Graham, J. R. 1992, MNRAS, 258, 53P
- Stritzinger et al. (2006) Stritzinger, M., Mazzali, P. A., Sollerman, J., & Benetti, S. 2006, A&A, 460, 793
- Taubenberger et al. (2015) Taubenberger, S., Elias-Rosa, N., Kerzendorf, W. E., et al. 2015, MNRAS: Letters, 448, L48
- Thomas et al. (2011) Thomas, R. C., Nugent, P. E., & Meza, J. C. 2011, PASP, 123, 237
- van den Bergh & Henry (1961) van den Bergh, S., & Henry, R. C. 1961, JRASC, 55, 173
- Yaron & Gal-Yam (2012) Yaron, O., & Gal-Yam, A. 2012, PASP, 124, 668
- Zwicky (1965) Zwicky, F. 1965, , Stars and Stellar Systems: Compendium of Astronomy and Astrophysics: Stellar Structure Vol. 8 (Chicago: University of Chicago Press), 367
| SN | Post-Max | 4700 Å | 4700 Å FWHM | 4850 Å | 5000 Å | 5500 Å | 5900 Å |
|---|---|---|---|---|---|---|---|
| Epoch | (Å) | (Å) | (Å) | (Å) | (Å) | (Å) | |
| 1990N | 186 | 4673 | 172 | 4973 | 5895 | ||
| 227 | 4685 | 190 | 4968 | 5898 | |||
| 255 | 4689 | 187 | 4970 | 5900 | |||
| 280 | 4693 | 181 | 4983 | 5901 | |||
| 333 | 4699 | 217 | |||||
| 1994D | 068 | 4631 | 149 | 4833 | 4959 | 5515 | 5878 |
| 069 | 4631 | 152 | 4837 | 4957 | 5512 | 5875 | |
| 073 | 4630 | 156 | 4834 | 4959 | 5880 | ||
| 088 | 4638 | 166 | 4838 | 4965 | 5896 | ||
| 097 | 4645 | 176 | 4841 | 4968 | 5899 | ||
| 101 | 4647 | 178 | 4842 | 4969 | 5902 | ||
| 129 | 4662 | 183 | 4973 | 5910 | |||
| 1994ae | 078 | 4628 | 169 | 4833 | 4953 | 5515 | 5863 |
| 084 | 4632 | 185 | 4833 | 4957 | 5515 | 5871 | |
| 102 | 4642 | 185 | 4838 | 4961 | 5509 | 5876 | |
| 159 | 4662 | 188 | 4979 | 5893 | |||
| 168 | 4665 | 184 | 4980 | 5890 | |||
| 234 | 4684 | 190 | |||||
| 383 | 4710 | 210 | |||||
| 1995D | 071 | 4625 | 153 | 4829 | 4955 | 5508 | 5855 |
| 075 | 4626 | 155 | 4832 | 4957 | 5502 | 5858 | |
| 080 | 4632 | 160 | 4842 | 4957 | 5505 | 5861 | |
| 103 | 4643 | 175 | 4841 | 4964 | 5871 | ||
| 287 | 4688 | 210 | 4972 | ||||
| 295 | 4693 | 213 | |||||
| 1996X | 057 | 4640 | 136 | 4971 | 5891 | ||
| 087 | 4660 | 165 | 4985 | 5914 | |||
| 298 | 4717 | 170 | 4982 | 5924 | |||
| 1998aq | 060 | 4620 | 153 | 4824 | 4947 | 5496 | 5848 |
| 063 | 4620 | 156 | 4824 | 4948 | 5495 | 5850 | |
| 066 | 4623 | 154 | 4825 | 4950 | 5494 | 5854 | |
| 079 | 4631 | 176 | 4829 | 4954 | 5490 | 5861 | |
| 082 | 4634 | 177 | 4828 | 4956 | 5490 | 5860 | |
| 091 | 4636 | 180 | 4834 | 4955 | 5865 | ||
| 211 | 4665 | 201 | |||||
| 231 | 4675 | 198 | 4987 | 5895 | |||
| 241 | 4677 | 202 | 4986 | 5900 | |||
| 1998bu | 058 | 4624 | 162 | 4826 | 4949 | 5506 | 5855 |
| 178 | 4669 | 191 | 4977 | 5883 | |||
| 189 | 4670 | 188 | 4976 | 5885 | |||
| 207 | 4674 | 191 | 4974 | 5885 | |||
| 216 | 4676 | 191 | 4972 | 5882 | |||
| 235 | 4679 | 191 | 4966 | 5889 | |||
| 242 | 4678 | 195 | 4959 | 5890 | |||
| 279 | 4685 | 195 | 4952 | 5905 | |||
| 328 | 4697 | 206 | 4951 | 5903 | |||
| 2002bo | 057 | 4652 | 158 | 4979 | 5570 | 5904 | |
| 073 | 4662 | 184 | 4988 | 5567 | 5917 | ||
| 080 | 4667 | 185 | 4992 | 5564 | 5923 | ||
| 2002dj | 082 | 4650 | 187 | 4960 | 5547 | 5890 | |
| 234 | 4692 | 189 | 5000 | 5930 | |||
| 2002dj | 287 | 4695 | 197 | 4980 | 5915 | ||
| 2003du | 063 | 4626 | 152 | 4830 | 4956 | 5517 | 5865 |
| 072 | 4629 | 158 | 4829 | 4958 | 5514 | 5869 | |
| 084 | 4638 | 173 | 4834 | 4960 | 5515 | 5875 | |
| 087 | 4639 | 170 | 4843 | 4959 | 5514 | 5877 | |
| 109 | 4654 | 187 | 4966 | 5886 | |||
| 138 | 4658 | 189 | 4971 | 5885 | |||
| 139 | 4660 | 188 | 4971 | 5886 | |||
| 142 | 4662 | 186 | 4973 | 5889 | |||
| 196 | 4675 | 180 | 4985 | ||||
| 209 | 4681 | 175 | 4989 | ||||
| 221 | 4682 | 188 | 4975 | 5889 | |||
| 272 | 4686 | 205 | |||||
| 377 | 4710 | 213 | |||||
| 2003hv | 071 | 4617 | 151 | 4835 | 4953 | 5865 | |
| 073 | 4618 | 155 | 4834 | 4952 | 5864 | ||
| 078 | 4623 | 163 | 4834 | 4954 | 5866 | ||
| 108 | 4636 | 174 | 4961 | 5873 | |||
| 140 | 4651 | 178 | 4963 | 5874 | |||
| 318 | 4689 | 195 | 4933 | ||||
| 2003kf | 063 | 4620 | 173 | 4824 | 4948 | 5524 | 5860 |
| 078 | 4634 | 177 | 4824 | 4955 | 5522 | 5875 | |
| 080 | 4634 | 185 | 4823 | 4953 | 5524 | 5876 | |
| 111 | 4654 | 189 | 4965 | 5523 | 5890 | ||
| 2004dt | 061 | 4626 | 178 | 4840 | 4959 | 5508 | 5844 |
| 063 | 4628 | 178 | 4843 | 4962 | 5507 | 5841 | |
| 065 | 4630 | 175 | 4850 | 4962 | 5505 | 5846 | |
| 095 | 4649 | 191 | 4852 | 4975 | 5496 | 5847 | |
| 2004eo | 057 | 4619 | 155 | 4824 | 4948 | 5522 | 5857 |
| 071 | 4630 | 157 | 4830 | 4960 | 5522 | 5866 | |
| 075 | 4625 | 154 | 4835 | 4956 | 5514 | 5872 | |
| 231 | 4674 | 166 | 4978 | 5887 | |||
| 2005cf | 061 | 4622 | 167 | 4825 | 4955 | 5524 | 5863 |
| 075 | 4629 | 162 | 4839 | 4958 | 5519 | 5873 | |
| 077 | 4635 | 161 | 4833 | 4962 | 5528 | 5877 | |
| 083 | 4638 | 178 | 4844 | 4963 | 5528 | 5883 | |
| 319 | 4689 | 197 | |||||
| 2007af | 091 | 4646 | 157 | 4852 | 4972 | 5529 | 5894 |
| 113 | 4656 | 165 | 4860 | 4980 | 5899 | ||
| 121 | 4659 | 163 | 4984 | 5896 | |||
| 144 | 4662 | 170 | 4983 | 5906 | |||
| 158 | 4668 | 185 | 4991 | 5900 | |||
| 2007gi | 086 | 4651 | 186 | 5007 | 5911 | ||
| 150 | 4677 | 188 | 5005 | 5924 | |||
| 2007le | 066 | 4635 | 181 | 4946 | 5589 | 5885 | |
| 077 | 4645 | 186 | 4963 | 5553 | 5896 | ||
| 305 | 4690 | 194 | 4967 | 5904 | |||
| 2007sr | 071 | 4648 | 180 | 4959 | 5549 | 5896 | |
| 079 | 4651 | 178 | 4966 | 5547 | 5901 | ||
| 103 | 4662 | 176 | 4978 | 5911 | |||
| 111 | 4664 | 179 | 5913 | ||||
| 129 | 4668 | 171 | 5913 | ||||
| 185 | 4680 | 179 | 5914 | ||||
| 2008Q aaOur day +237 and +318 spectra of SN2008Q are available on WISeREP. | 203 | 4676 | 197 | 4961 | 5897 | ||
| 237 | 4694 | 202 | 4967 | 5909 | |||
| 318 | 4698 | 222 | |||||
| 2011by | 051 | 4631 | 144 | 4838 | 4962 | 5527 | 5864 |
| 206 | 4686 | 179 | 4994 | 5900 | |||
| 310 | 4705 | 187 | 5901 | ||||
| 2011fe | 074 | 4636 | 153 | 4841 | 4966 | 5520 | 5878 |
| 077 | 4637 | 156 | 4843 | 4968 | 5519 | 5879 | |
| 079 | 4639 | 155 | 4845 | 4970 | 5521 | 5881 | |
| 082 | 4640 | 161 | 4845 | 4973 | 5520 | 5881 | |
| 084 | 4641 | 158 | 4844 | 4973 | 5518 | 5884 | |
| 087 | 4641 | 162 | 4846 | 4974 | 5520 | 5885 | |
| 089 | 4642 | 165 | 4846 | 4976 | 5518 | 5886 | |
| 100 | 4648 | 167 | 4849 | 4979 | 5517 | 5890 | |
| 103 | 4648 | 166 | 4850 | 4979 | 5889 | ||
| 107 | 4650 | 168 | 4853 | 4980 | |||
| 115 | 4655 | 169 | 4853 | 4983 | 5894 | ||
| 130 | 4657 | 170 | 4858 | 4986 | 5896 | ||
| 145 | 4664 | 168 | 4860 | 4990 | 5898 | ||
| 166 | 4668 | 177 | 4866 | 4993 | 5901 | ||
| 174 | 4672 | 175 | 4996 | 5899 | |||
| 226 | 4685 | 176 | 5005 | 5909 | |||
| 2011fe | 232 | 4686 | 178 | 4997 | |||
| 259 | 4691 | 178 | 5000 | 5910 | |||
| 289 | 4695 | 179 | 4997 | 5910 | |||
| 346 | 4703 | 191 | 4979 | 5916 | |||
| 348 | 4703 | 192 | 4975 | 5916 | |||
| 2012fr | 062 | 4629 | 200 | 4957 | 5556 | 5878 | |
| 071 | 4636 | 215 | 4928 | 5562 | 5894 | ||
| 077 | 4647 | 208 | 4929 | 5562 | 5899 | ||
| 118 | 4665 | 190 | 4919 | 5561 | 5914 | ||
| 151 | 4674 | 182 | 4926 | 5925 | |||
| 222 | 4682 | 197 | 5011 | 5919 | |||
| 261 | 4689 | 201 | 4991 | 5912 | |||
| 340 | 4689 | 215 | 5910 | ||||
| 367 | 4689 | 216 | |||||
| 2012hr | 283 | 4686 | 171 | 4971 | 5904 | ||
| 368 | 4696 | 203 | |||||
| 2013aa | 137 | 4661 | 181 | 4977 | 5882 | ||
| 185 | 4672 | 181 | 4982 | 5884 | |||
| 205 | 4677 | 180 | 4984 | 5886 | |||
| 345 | 4701 | 205 | |||||
| 2013dy | 071 | 4654 | 182 | 4850 | 4976 | 5531 | 5888 |
| 076 | 4658 | 183 | 4847 | 4974 | 5530 | 5890 | |
| 092 | 4666 | 185 | 4846 | 4981 | 5520 | 5898 | |
| 100 | 4668 | 189 | 4984 | 5526 | 5902 | ||
| 125 | 4675 | 192 | 4989 | 5905 | |||
| 130 | 4676 | 187 | 4991 | 5905 | |||
| 133 | 4676 | 190 | 4990 | 5908 | |||
| 333 | 4703 | 215 | |||||
| 423 | 4728 | 233 | |||||
| 2014lp | 087 | 4647 | 175 | 4958 | 5000 | 5543 | |
| 114 | 4660 | 175 | 5005 | ||||
| 149 | 4668 | 178 | 5016 |
Note. — Errors for the measured central wavelengths and FWHM are 4 Å and 5 Å respectively.