Bolometric Flux Estimation for Cool Evolved Stars
Abstract
Estimation of bolometric fluxes is an essential component of stellar effective temperature determination with optical and near-infrared interferometry. Reliable estimation of simply from broad-band -band photometry data is a useful tool in those cases were contemporaneous and/or wide-range photometry is unavailable for a detailed spectral energy distribution (SED) fit, as was demonstrated in Dyck et al. (1974). Recalibrating the intrinsic versus observed relationship of that study with modern SED fitting routines, which incorporate the significantly non-blackbody, empirical spectral templates of the INGS spectral library (an update of the library in Pickles, 1998) and estimation of reddening, serves to greatly improve the accuracy and observational utility of this relationship. We find that values predicted are roughly 11% less than the corresponding values predicted in Dyck et al. (1974), indicating the effects of SED absorption features across bolometric flux curves.
Subject headings:
stars: fundamental parameters (radii, temperatures); stars: distances; stars: carbon; instrumentation: high angular resolution; instrumentation: interferometers; infrared: starsDraft:
I. Introduction
A substantial number of angular sizes of cool, evolved stars have been measured over the past two decades with increasingly sophisticated optical interferometry facilities operating in both the near-infrared (taken here to be 1.0-2.5 ) and the optical (0.3-1.0 ). However, without ancillary measurements, these apparent sizes are of limited utility. When combined with distance , a linear size may be obtained; when combined with a measurement of bolometric flux , the effective temperature may be measured. The latter comes from the definition of luminosity , relating it to stellar radius and (and the usual mathematical / physical constants):
| (1) |
Dividing both sides by reduces this to the relationship:
| (2) |
where the Rosseland angular size is in units of milliarcseconds (mas), and is given as ergs cm-2 sec-1; the resultant is in Kelvin (K). The Rosseland mean angular size is the wavelength-averaged angular size incorporating the wavelength-weighted Rosseland mean opacity – effectively, the mean radiating surface of the star (definitional discussions can be found in Seaton et al., 1994; Seaton & Badnell, 2004). The value for is to be taken as the flux arriving at Earth from the observed star, assuming no intervening extinction between it and the observer.
Unfortunately, many interferometric size determinations are not done in direct conjunction with matching measures of or . In the case of distance, this (relatively) invariant parameter can be measured long after (or before) the corresponding measure of takes place, with no significant effect upon the ultimately determined linear size, .
For bolometric flux, the situation is more challenging. Complete characterizations of the total flux output from the shortest to longest wavelengths are rarely done for most objects, and even simple photometry is rarely carried out at the time of the interferometric observations. Many of the coolest objects that are of particular interest to interferometry vary in brightness substantially on time periods short compared to the lag between flux and size measurements. For the bandpasses where they are brightest – in the near-infrared – instrumentation tends to be available only on larger telescopes, meaning these objects saturate detectors and fall squarely in a surprising ‘blind spot’ of modern astronomy. To complicate matters further, many of these objects are distant, which means a correction for interstellar reddening must be taken into account as well. An important piece of the solution is the fact that interferometers typically collect measurements of the incoherent flux levels111The light at the end of the tunnel, as it were. at their wavelengths of operations – typically -band – in addition to measures of interference during their observations.
Historically, effective use of these data was directly affected by the advent of useful infrared detectors in the 1960’s, which resulted in the seminal Two Micron Sky Survey (Neugebauer & Leighton, 1969) and the dissertation work of Wing (1967). The ensuing work by Dyck et al. (1974, hereafter DLC74) demonstrated relationships between band-to-bolometric flux ratios and spectral type, at 0.55, 1.04, and m (see Figure 6 of DLC74 in particular), for ‘relatively normal’ Mira variables and giants. Spectral types in the DLC74 study were determined contemporaneously to account for this parameter appearing to change with variable star phase. For the ratio, the relationship was essentially flat for spectral types M0 through M6; for , the ratio changes slowly and in a linear fashion from M0 all the way out to M10.
However, with a number of recent advances, the specific results of DLC74 bear a revisit and recalibration. The spectral template library of Pickles (1998) allows for a much more fine-grained fitting of spectral energy distributions to the the photometry present in DLC74 - e.g. see Figures 1-3 in that paper, which effectively does a simple Riemann sum as a function of wavelength to determine their values for . Such a sum approximates a blackbody curve, and does not account for absorption features present between photometric bands – which, particularly for the later-type stars, can be considerable (non-)contributions of the stellar spectral energy distribution (SED) curve. Current sophisticated SED fitting codes can make use of the unreddened Pickles templates, constrain them by the photometry in DLC74 – which remain high-quality measurements – and also incorporate reddening corrections.
II. Photometry and Data Reduction
II.1. Targets and Photometric Data
The target data come from 84 observations of 60 objects found in DLC74, all of which are cool evolved stars at spectral types M4.0III and later. Two objects have measurements at 4 separate epochs, three objects have 3 epochs, and 11 have 2 epochs. These 60 objects include contemporaneous flux measurements in (in W cm-2 m-1) across up to 12 bands from 0.55m to 10.2m, along with epoch-specific spectral type determinations for 70 of the 84 observations, and 34 determinations. Broad-band filters representing the and passbands were used, along with narrowband filters at 0.78, 0.87, 0.88, 1.04 and 1.05 m with filter-specific properties listed in Table 1. Further details on the narrowband system can be found in DLC94, along with Lockwood & Wing (1971); Lockwood (1972, 1973); Wing & Lockwood (1973).
| Designation |
|
|
|
||||||||
|---|---|---|---|---|---|---|---|---|---|---|---|
| 78 | 7817 | 90 | TiO | ||||||||
| 87 | 8778 | 82 | Continuum | ||||||||
| (TiO after M5) | |||||||||||
| 88 | 8884 | 114 | TiO | ||||||||
| 104 | 10351 | 125 | Continuum | ||||||||
| 105 | 10506 | 100 | VO |
For the purposes of this study, we have taken the data in DLC74 and converted it into Janskys (Jy), which can be found in Table 2. Spectral types listed in this table for each of the stars were determined contemporaneously by DLC74 using the TiO and VO band strengths in the narrowband photometry, using the color indices calibration and technique found in Lockwood (1972). The color indices found in Lockwood (1972) were used to type stars in integer subtypes between M1 and M3, half-integer subtypes between M4.0 and M8.0, and quarter-integer subtypes between M8.0 and M10.
DLC74 cite their photometry errors as “2-3 percent” for their narrowband data, “5 percent or less” for 1-4m, and “10 percent or slightly greater” for their 5 and 10.2 m data points; no error is given for -band data, except to note that their stars are “extremely faint” (and imply that larger errors result). From the numerical modeling presented in the next section, this appears to correspond to a median measurement values of W cm-2 m-1. In practice, we found that inflating these errors by a factor of was necessary to achieve average reduced values approaching 1.0 in the next section. We additionally found that for the latest type stars (M7.5III), data from the 3 shortest wavelength filters was also “extremely faint” (also W cm-2 m-1) and that 2-3% errors for these data were underestimates.
II.2. Spectral Energy Distribution Fitting with sedFit
For SED fitting, we used the sedFit code that we have employed on previous occasions (e.g. van Belle et al., 2007, 2008; van Belle & von Braun, 2009) for determination of bolometric flux and other relevant stellar parameters. The flux data from DLC74 were matched against a grid of M-giant template spectra; for comparison, the epoch-specific spectral types determined in DLC74 were also specifically evaluated.
The template spectra were based upon the INGS (IUE / NGSL / SpeX) library of Pickles222http://lcogt.net/user/apickles/dev/INGS/, an update of the earlier catalog of Pickles (1998). The INGS combines IUE data (Heck et al., 1984), NGSL data (Heap & Lindler, 2011), and SpeX data (Rayner et al., 2009) to produce a compendium of 143 stellar spectra, and significantly improves the late-type spectra relative to Pickles (1998). This is primarily due to the later spectra being now observationally based, in contrast to Pickles (1998) which used the theoretical spectra from Fluks et al. (1994) for the late M giant spectra. A search grid was developed from the 11 subtype templates found in the INGS between M0III and M10III, with half-subtypes generated by interpolating between those 11 templates. This grid of these spectra were searched by chi-squared minimization by fitting, for each template, the bolometric flux level and wavelength-dependent reddening. For all but 3 of the 84 flux data sets, a slightly different spectral subtype from the grid search fit better than the indicated DLC74 spectral type; typically this was roughly one subtype bluer than DLC74.
In combination with an effective temperature estimate that assigned to each spectral type (based upon the values in – interpolated or extraopolated where necessary – van Belle et al., 1999), an estimate of the angular sizes of these objects was produced as a potentially useful secondary data product. Reddening corrections were based upon the empirical reddening determination by Cardelli et al. (1989), which differs little from van de Hulst’s theoretical reddening curve No. 15 (Johnson, 1968; Dyck et al., 1996). Zero-magnitude flux density calibrations for broadband photometry data points were based upon the values given in Fukugita et al. (1995) and Cox (2000). In contrast to similar earlier SED efforts of ours, no literature photometry (such as Stromgren or 2MASS data in Rufener, 1976; Cutri et al., 2003) was utilized herein, given the non-contemporaneous nature of those data sets.
The -band data were not used in the SED fitting for a number of reasons. Principally, the more variable stars (e.g. the Miras) have variations in and , and dust production which causes up to 8 magnitudes of variation in , rendering data in this bandpass useless for SED fitting. Additionally, the weighting on the data points was unclear given the non-numerical quantification of the signal-to-noise in DLC74. As such, the data had a disproportionate effect in determination of reddening, even when given low statistical weight. Determination of reddening was still well-characterized for these stars given the inclusion of the shorter-wavelength narrow-band filters (LW , , ). For determination of the intrinsic bolometric flux () below, it is important to be as unbiased as possible in characterizing reddening. Contributions longwards (m) of the data presented in the template spectra were estimated via a Rayleigh-Jeans tail and typically were a minor (%) contribution.
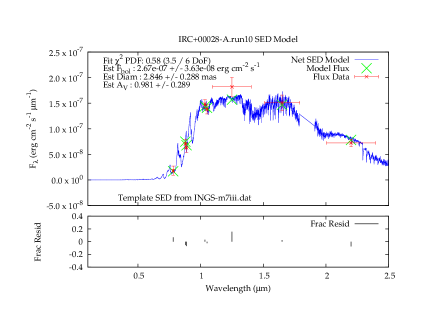
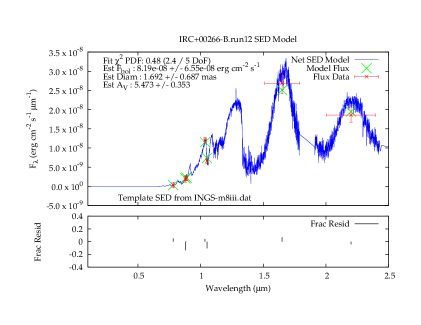
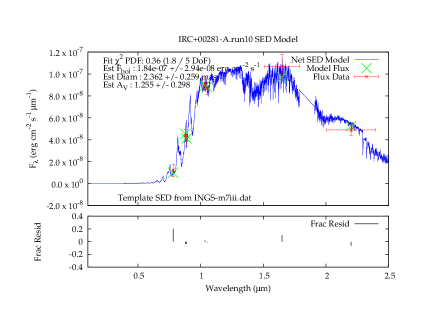
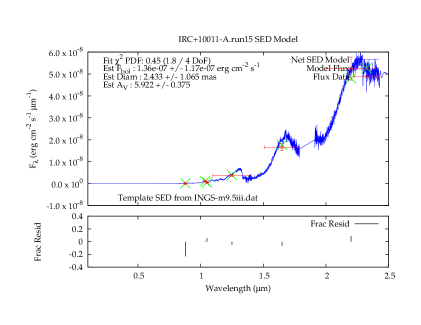
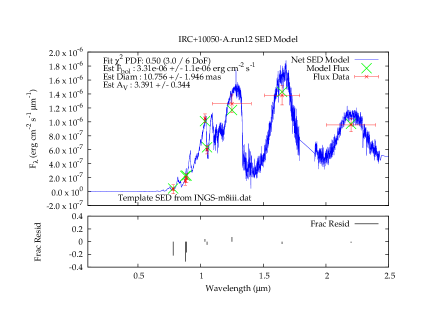
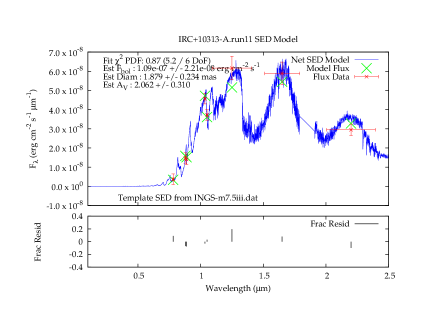
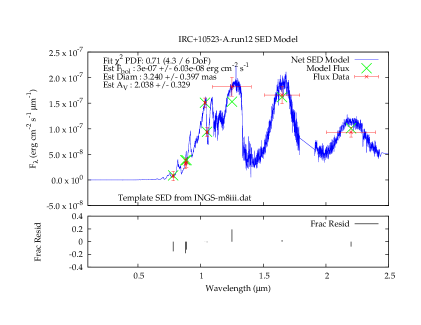
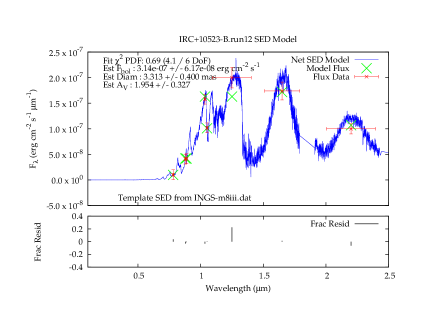
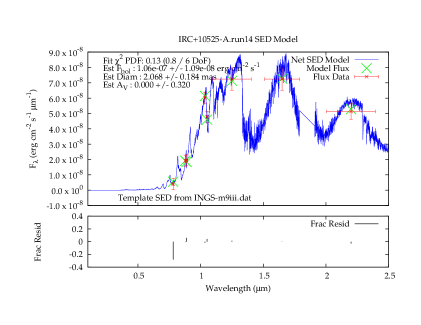
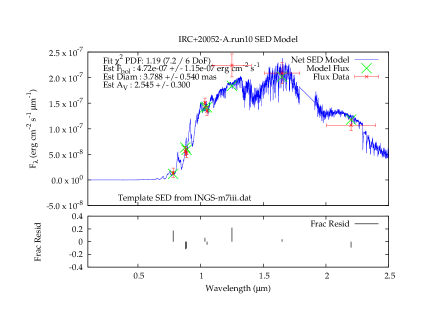
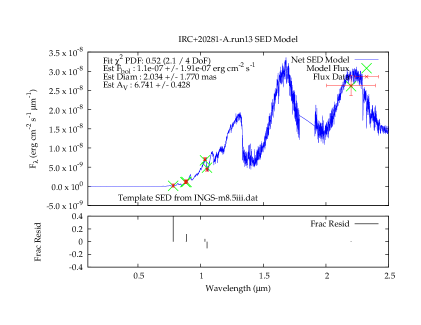
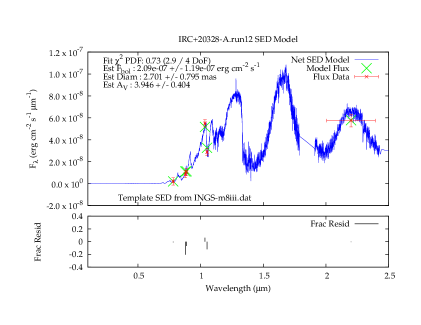
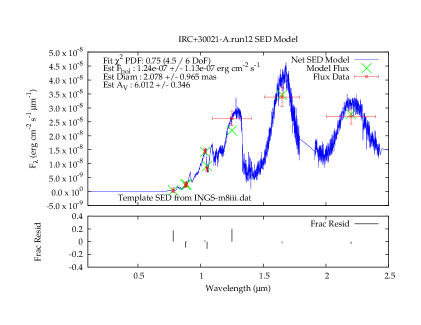
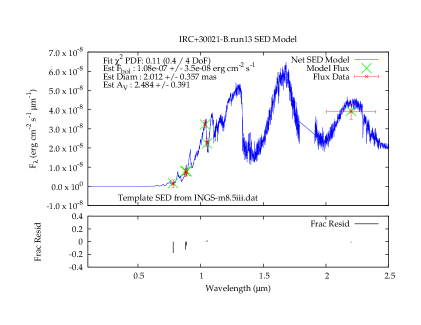
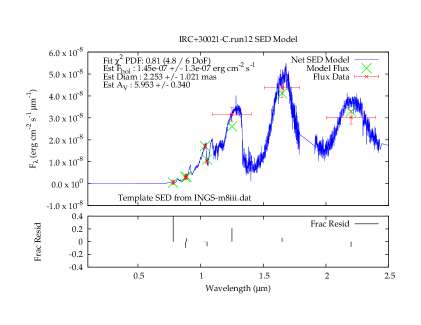
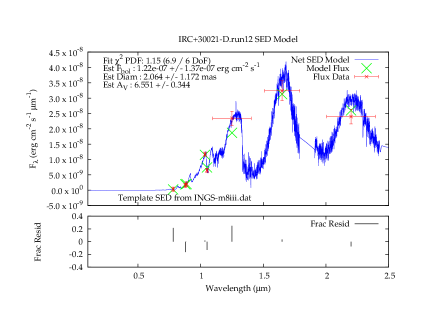
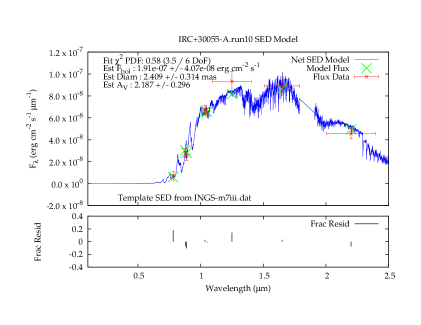
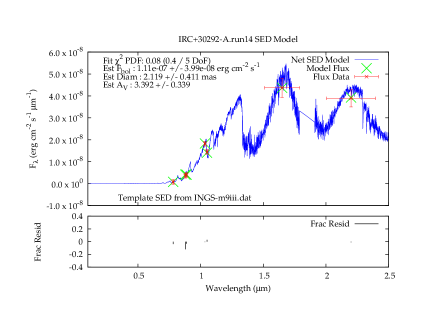
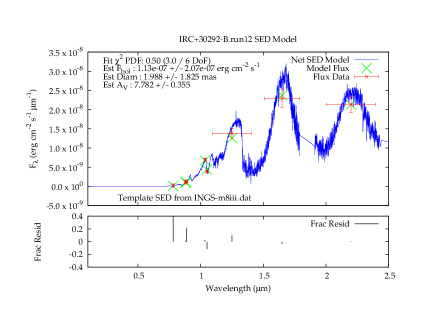
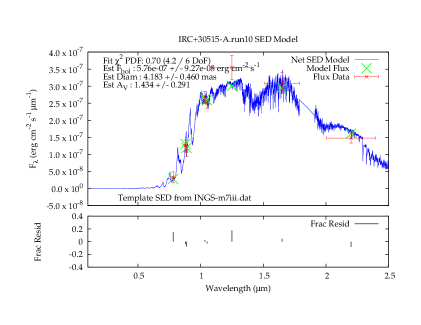
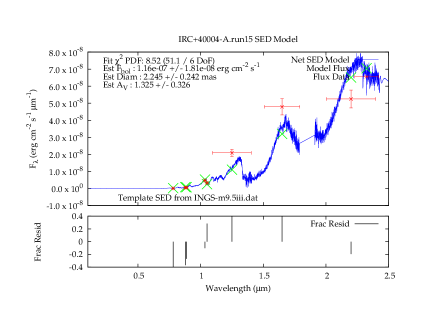
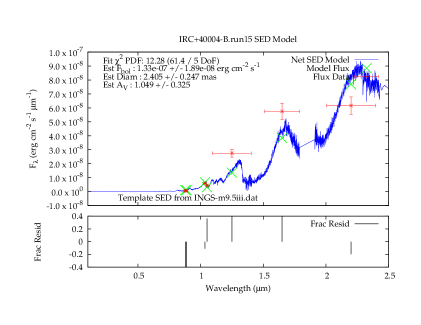
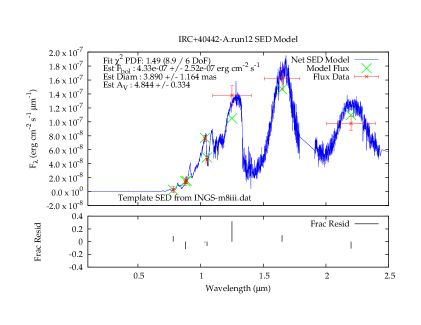
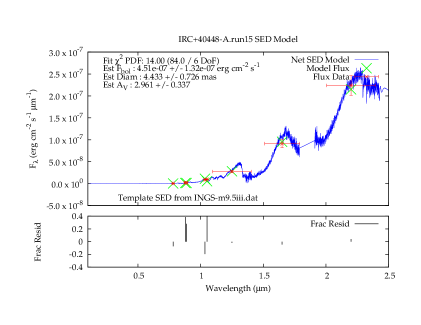
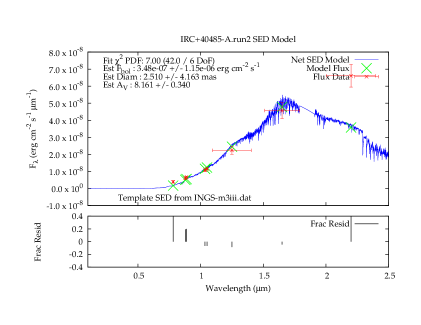
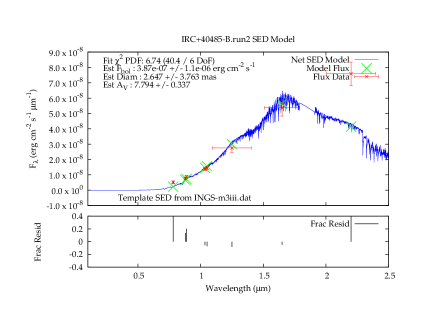
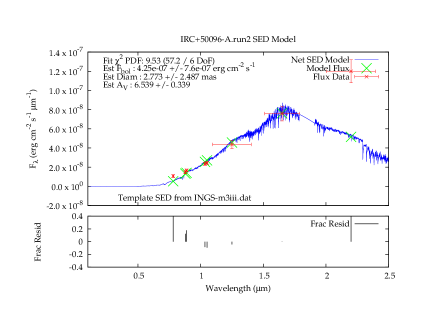
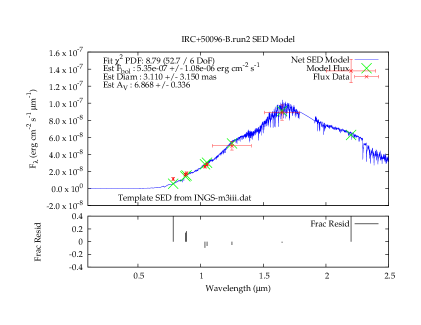
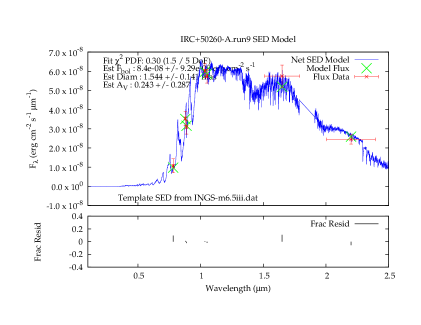
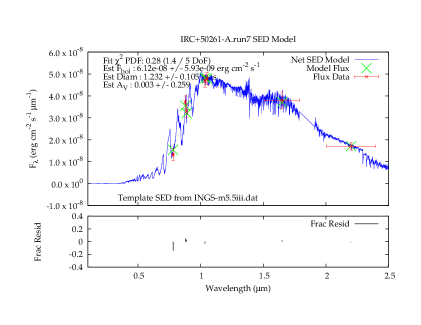
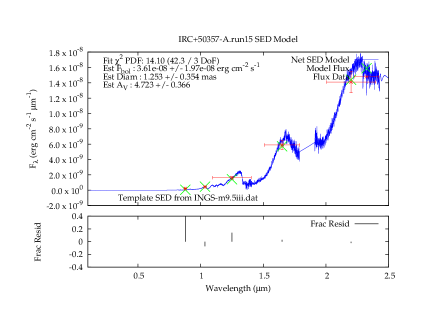
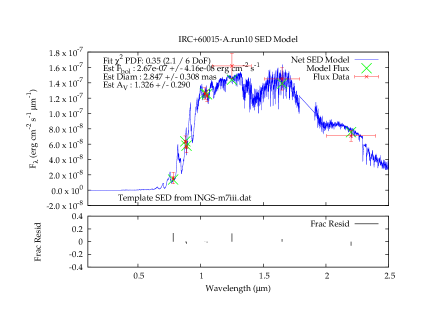
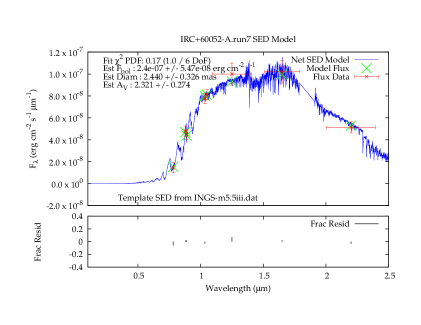
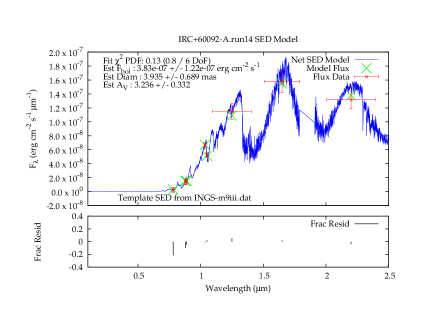
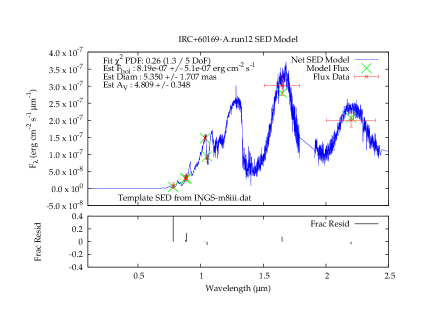
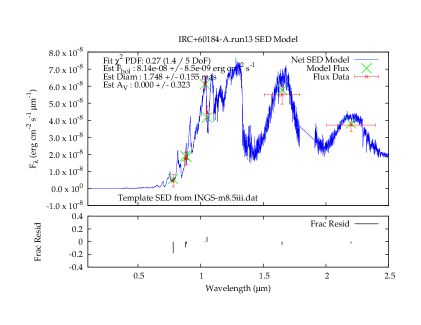
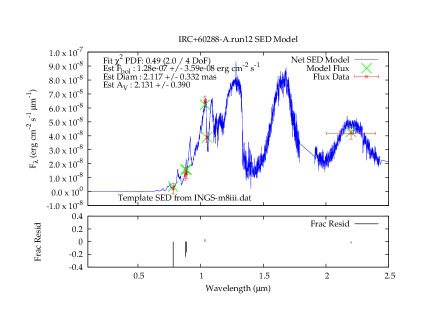
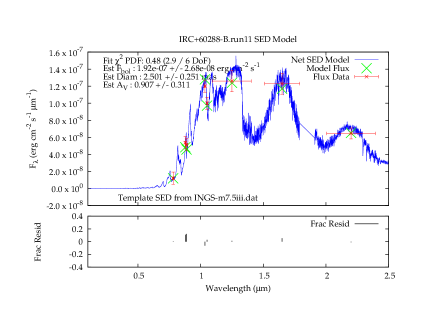
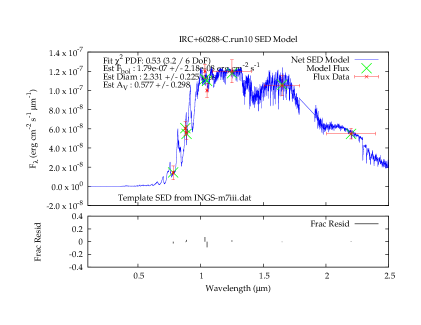
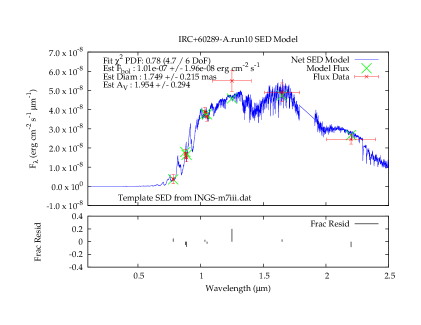
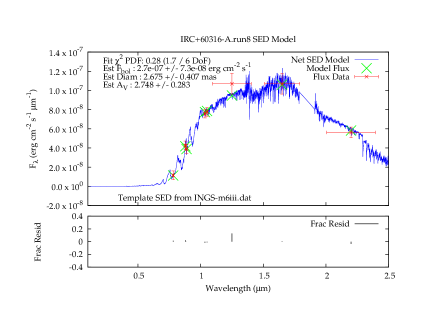
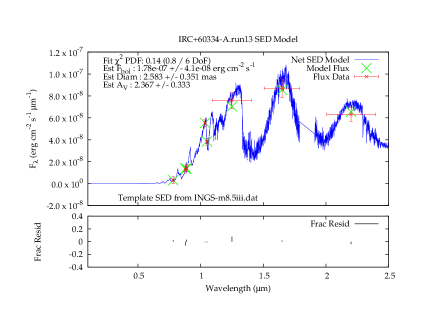
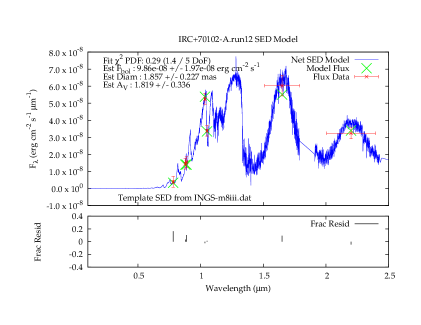
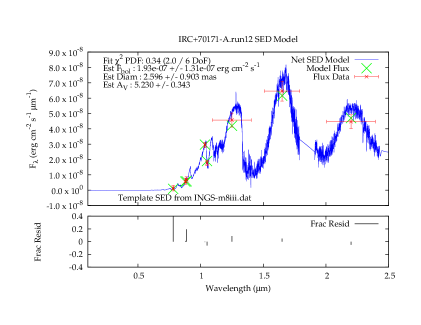
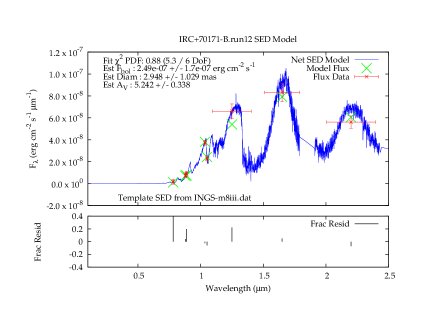
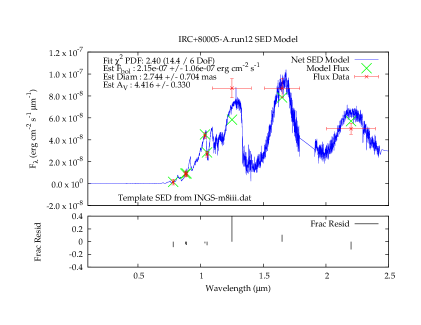
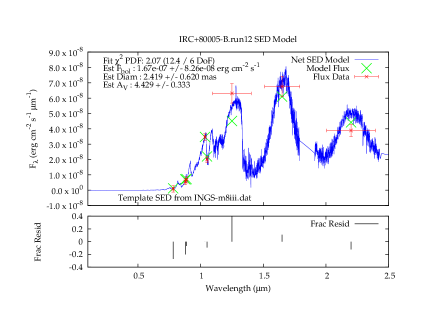
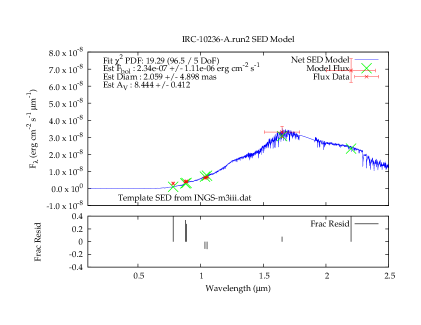
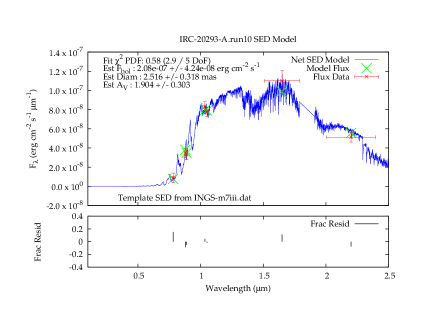
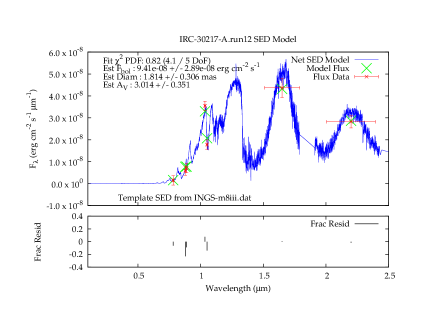
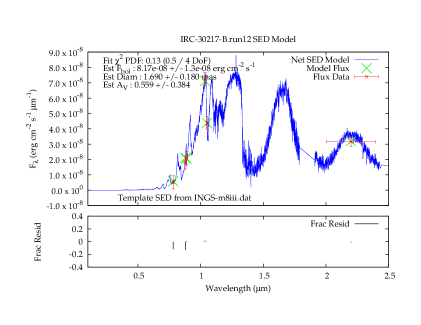
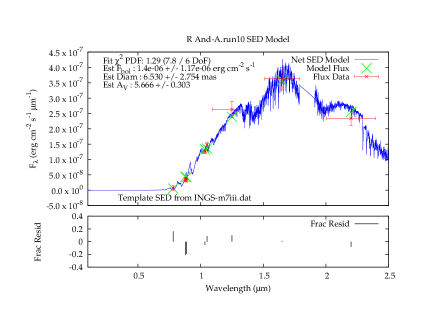
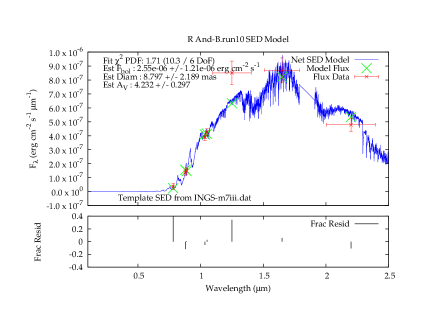
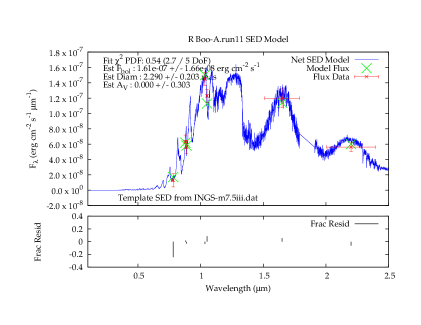
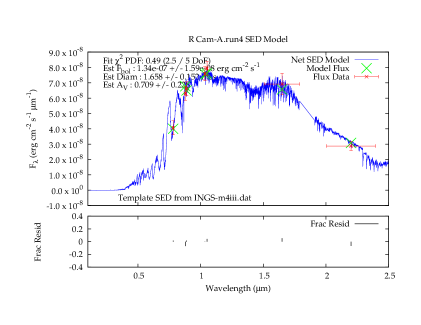
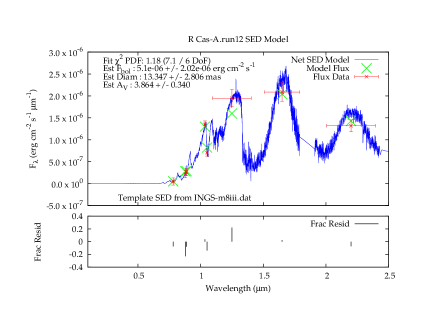
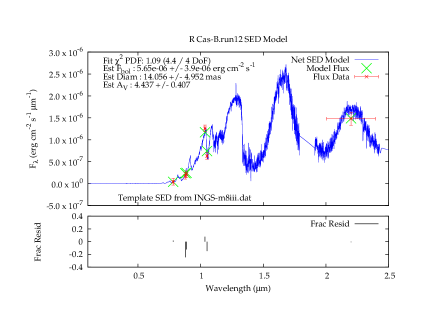
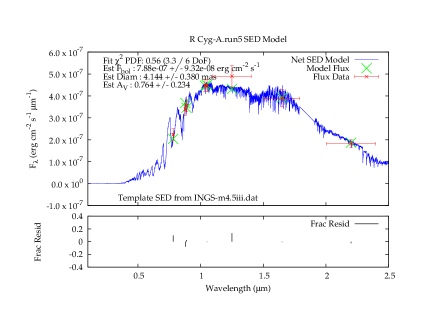
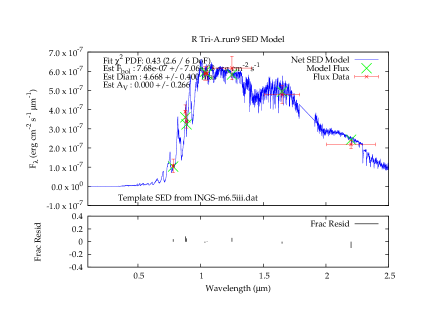
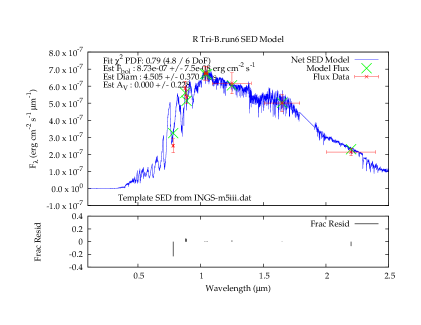
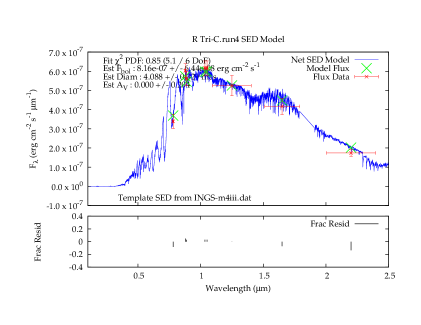
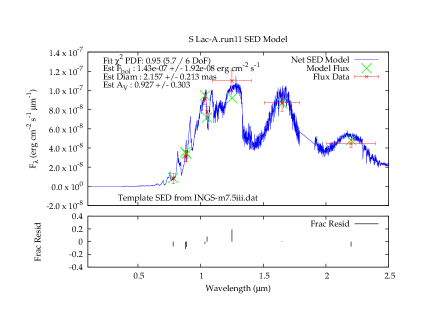
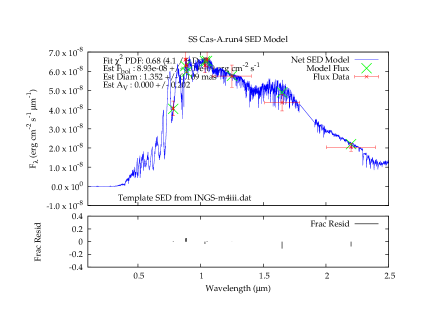
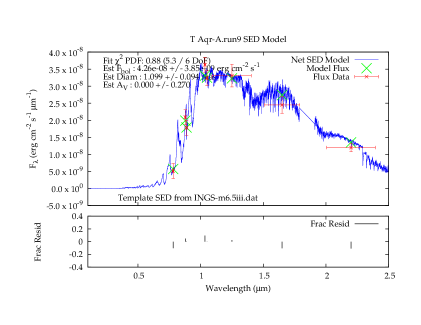
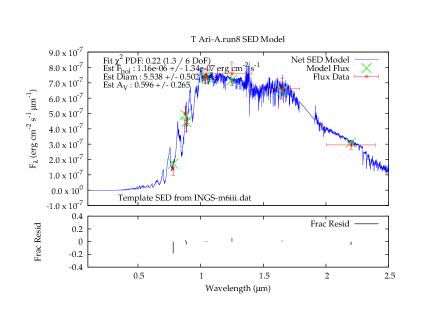
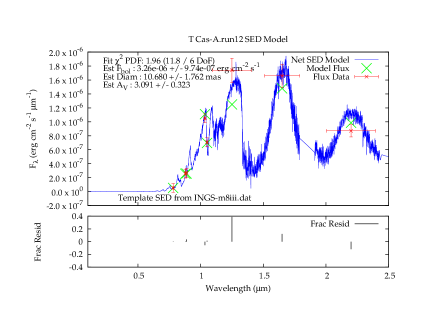
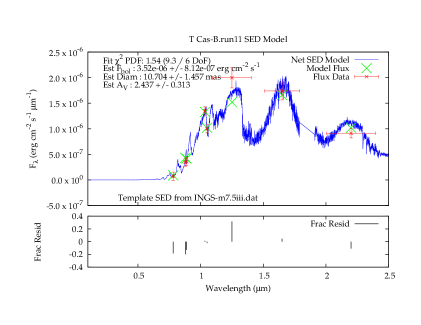
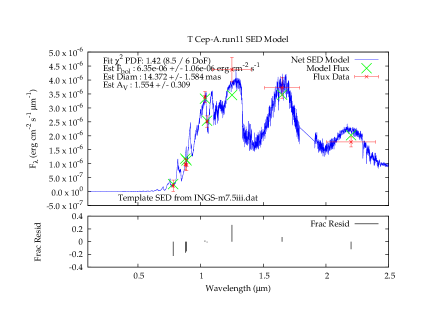
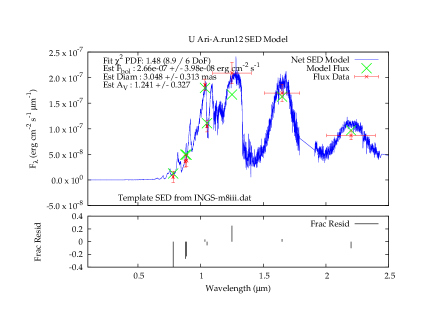
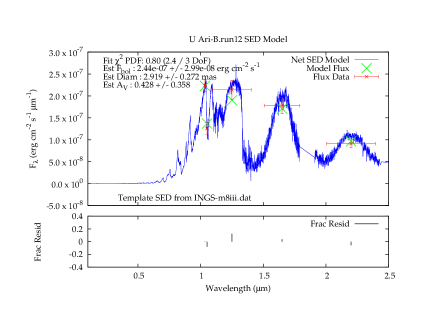
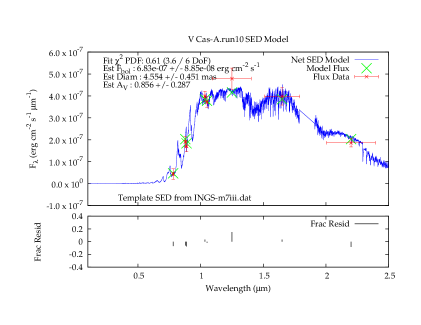
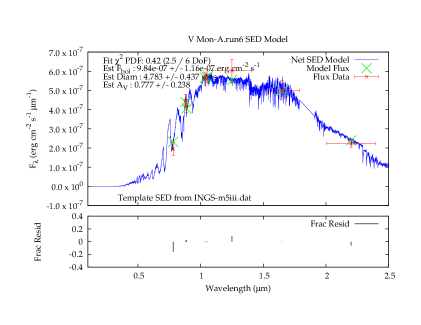
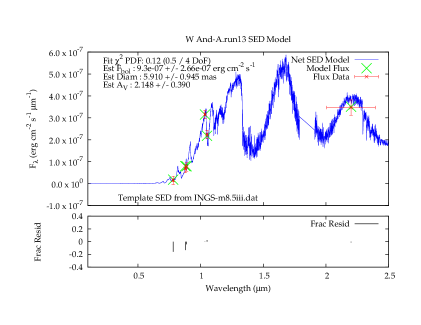
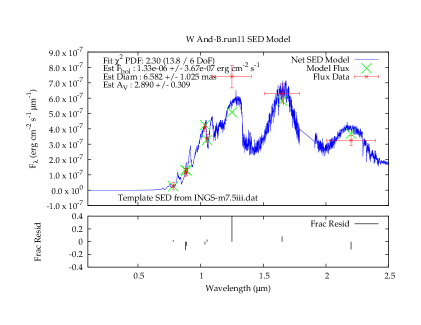
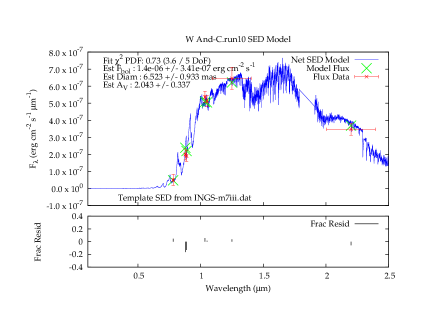
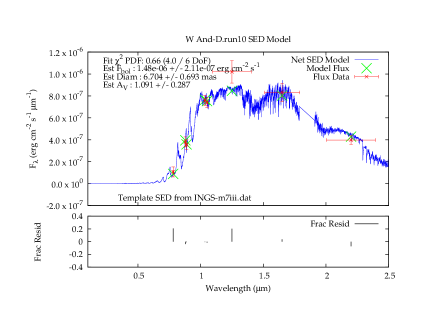
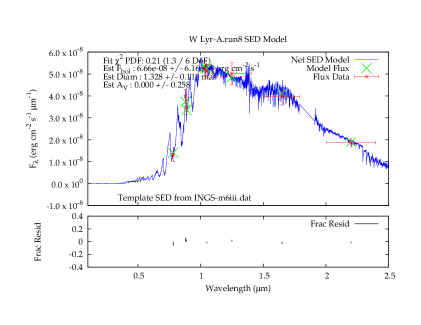
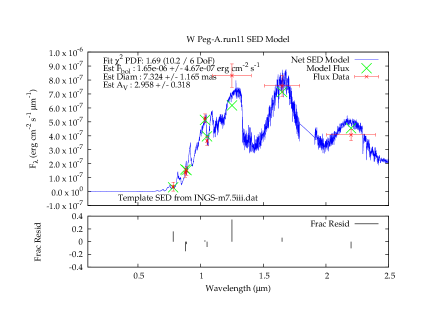
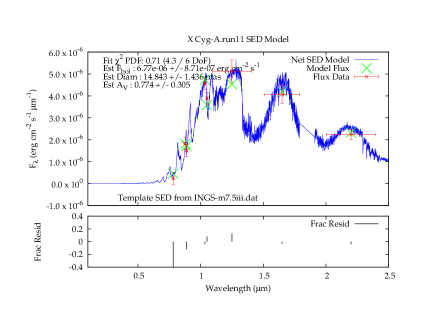
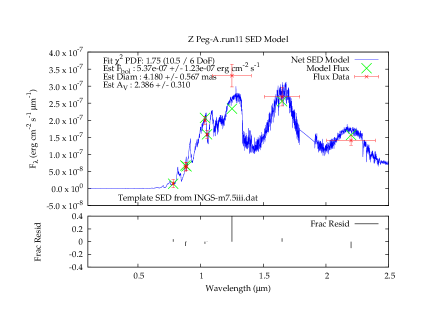
The results from the SED fitting can be seen in Table 3, including estimates for reddening, angular size, and bolometric flux. The full set of summary sedFit output plots can be seen in the Appendix in Figures A1-A14. Six objects had abnormally large per degree-of-freedom values () and were not considered in the ensuing analyses. Unsurprisingly, four of these six (IRC-10236, IRC+40485, IRC+50096, IRC+50357) are those objects noted in DLC74 as carbon stars; the remaining two (IRC+40004, IRC+40448) are M-type in DLC74 but had sufficiently spurious fits that they were set aside. Interestingly, all objects designed in DLC74 as S-type (R And, R Cam, R Cyg) had SED fits with reasonable values indistinguishable from the M-type stars.
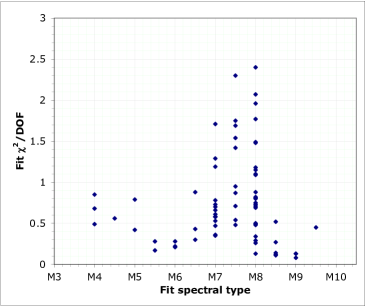
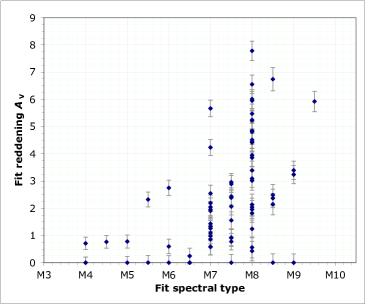
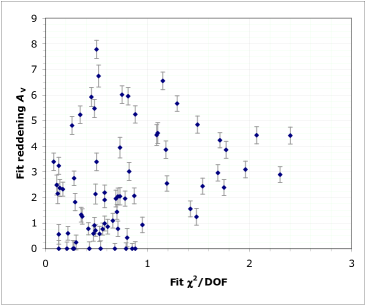
For the remaining objects the values for the SED fits have a median value of 0.64, with a maximum of 2.4.333An earlier investigation utilizing the Pickles (1998) templates in like manner to the INGS templates had median values of 4, with a significant increasing trend in versus spectral subtype; it is on this basis that we find that the INGS templates are significantly better for the later subtypes. All values are based upon employing the error bars discussed at the end of §II.1. There is a correlation between these values, seen in Figure 1, with a significant increase in for the redder stars, beginning at M7.5III. Similarly, we see an increase in the range of reddening fit values in Figure 2 for the later spectral types, also beginning at M7.5III, and possibly one-half subtype earlier. However, considering versus (Figure 3), there is quite a bit of scatter between these parameters.
Taken together, Figures 1, 2, and 3 lead us to the following conclusions: first, the spectral type templates of the Pickles INGS are somewhat problematic for spectral types around M8III, for those bandpasses found in the narrowband filters of Lockwood & Wing (1971). Second, increasing values of for the later spectral types are associated with increasing amounts of circumstellar, rather than interstellar, dust, given the known increase in mass loss rates with increasing spectral type (Dupree, 1986; Guandalini, 2010). Third, the slight trend in versus towards increasing for indicates that poorness of fit – potentially due to a lack of sufficient granularity in the INGS spectral template grid – might result a increased value for .
Objects with Anomalous Results. As noted above, a number of objects explicitly identified as carbon stars were presented in DLC74 (IRC-10236, IRC+40485, IRC+50357, IRC+50096), and fits using M10III templates were attempted, under the notion that these latest spectral types would be most analogous to the carbon stars. However, as seen in the summary plots in the Appendix, this approach failed: SEDs for these object exhibit a distinctive, almost linear increase in flux with increasing wavelength. Additionally, stars IRC+40004, and IRC+40448 were assigned M-type subtypes in DLC74 (M9III, and M7III, respectively) but exhibited photometry reminiscent of the carbon star phenomenon. None of these objects that exhibited carbon behavior were included in Figures 1-3 or utilized in the discussion of §III. A cursory attempt was made to compare the data to model SED templates for the carbon stars (e.g. Aringer et al., 2009), but this was not successful; fits to carbon star SEDs remain an interesting and involved challenge (e.g. see extensive discussion in the recent work by Rau et al., 2015).
III. Discussion
III.1. Bolometric Flux Relationships
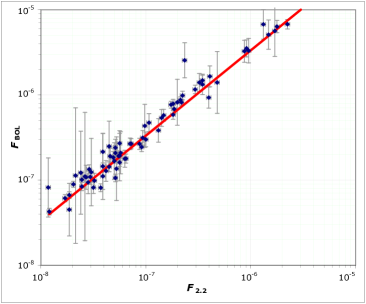
As inspired by DLC74 (particularly Figure 6 in that article), we examined the intrinsic bolometric flux () versus observed 2.2 m flux () in Figure 4, and found the simple relationship fit:
| (3) |
in erg cm-2 s-2, with a reduced of 1.66. Direct comparison of this fit for against the values from the SED fitting indicates a median intrinsic scatter of this relationship, across the range of bolometric fluxes in question, of 17%. It is important to emphasize that this is the relationship between observed 2.2 m flux versus intrinsic bolometric flux – the influence of reddening is considered in transforming from to using this relationship. As such, this is a relationship of significant observational utility, but of limited value for understanding the underlying astrophysics.
We can leverage the estimate for found in Table 3 to “correct” the observed 2.2m flux for the intrinsic 2.2m flux , which modifies the previous relationship to:
| (4) |
in erg cm-2 s-2, with a reduced of 1.55; as expected, this decreases the slope of the linear fit – the amount of intrinsic 2.2m flux relative to the overall intrinsic bolometric flux is greater than the reddening-decreased apparent 2.2m flux.
III.2. Comparison to DLC74
The intent of this investigation is to expand and update the intrinsic versus relationship presented in DLC74. In particular, the use of specific Pickles INGS spectral templates, with the inclusion of significant absorption bands, along with an estimate of reddening, is expected to refine the values obtained for . Inspection of how the fits compare to data in DLC74 is warranted before examining that derived quantity. The most direct comparison is that of spectral type. DLC74 determined their spectral types by referencing the Lockwood & Wing narrowband fluxes against the color calibrations of Lockwood (1972); spectral types in this investigation were fixed to those values.
For completeness, we also explored fitting the photometry data for each star against subtypes fixed to those types found in DLC74. We found significantly poorer values (as seen in Table 3) for these types which were, on average, 1 subtype later than the template found from searching a grid of INGS templates. Interestingly, the resultant values were still comparable between fits using a DLC74-fixed subtype, versus a grid fitted subtype value, differing only at the 6% level.
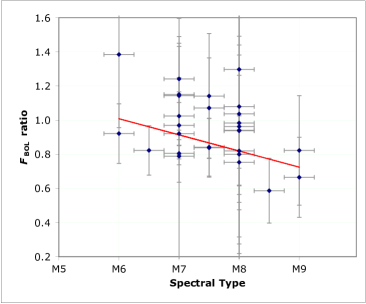
Overall, the inclusion of reddening in our SED fitting has the effect of increasing the indicated intrinsic on a star-by-star basis, when the extinguishing effect of that phenomenon is taken into account. The competing effect of major near-infrared ‘gaps’ (due to absorption features in the spectra) in the SED leading to a lower integrated relative to a obtained from a simple Riemann sum (cf. consider the areas under the curve of our summary sedFit figures in the Appendix, and Figures 1, 2, or 3 of DLC74) will diminish the indicated . This second effect should increase for increasingly redder spectral types, and this is borne out by examination of the ratio of DLC74 values versus those determined herein (Figure 5). A fit to these data points gives
| (5) |
with a reduced ; where is the ratio, , and ST the M-class spectral subtype value; not every star in the previous figures is seen in this plot, because DLC74 did not provide a for every one of their stars.
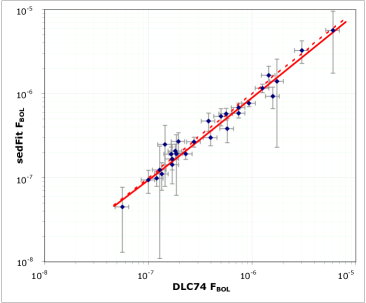
A separate way of looking at the effects of reddening and near-infrared absorption is to compare directly the derived values from DLC74 and our work (Figure 6). Fitting for the relationship between the two sets of values gives:
| (6) |
in units of ergs cm-2 s-1 with a of 0.39. On average, our values are 11% lower than those found in DLC74.
III.3. Further Improvement upon Empirical Determination of
As seen in DLC74, a second-order correction to the relationship between observed 2.2m flux and overall intrinsic can be considered. For DLC74, they present this as a weak spectral-type dependency (see their Figure 6 and discussion in §V.a). Unfortunately, in the notional observational scenario we are considering – angular size measurements contemporaneous with only -band, and possibly -band, measurements – contemporaneous spectral typing is not available. As such, development of a modern refinement of such a relationship seems of limited utility, particularly given the complications of spectral type discussed in §III.2.
Instead of spectral type, a more directly quantitative index such as can be considered. However, a cursory examination of the ratio of to shows no significant improvement in determination of over the 17% uncertainty found for Equation 3 – which provides no motivation for the complication introduced by now levying a requirement for contemporaneous -band data in conjunction with the -band data.
Incorporating our SED fitting fit values into this analysis, to index with unreddened values, i.e. versus , shows a reduction in the predictive uncertainty for decreasing to 9%. While this is a significant improvement, it is a rather unrealistic one, presuming some knowledge of which is not obtained without the complication of (and requirements for contemporaneous observational data over a wide bandpass) a full SED fit.
III.4. Empirical (non-)Determination of
While this investigation has emphasized determination of , we do not see it of direct utility in determining effective temperature . As noted in §II.2, a is assigned to each spectral template, based upon the earlier calibration found in van Belle et al. (1999); this enabled an estimate of angular size to be derived from this SED fitting exercise. A recalibration of the versus spectral type (or other index, such as - color) would be useful and is in fact part of a larger effort on the part of the authors. However, the necessary new information – namely direct measures of angular sizes for highly evolved stars – will be part of a forthcoming publication; as such, any recalibration is deferred until that investigation. This investigation directly enables that work by providing the photometrically-based determination of for Equation 2.
IV. Conclusions
Evaluation of the photometric data of DLC74 with current computing techniques, against empirical spectral templates, makes considerable utility of this still-impressive dataset. Refinement of the intrinsic versus observed relationship, first noted in DLC74, provides observers with a useful tool in deducing the fundamental stellar parameter of of these stars, even with limited observational data. This approach has considerable merit in further application against other early but high-quality photoelectric photometry, such as the extensive Wing (1967) data set.
References
- Aringer et al. (2009) Aringer, B., Girardi, L., Nowotny, W., Marigo, P., & Lederer, M. T. 2009, A&A, 503, 913
- Cardelli et al. (1989) Cardelli, J. A., Clayton, G. C., & Mathis, J. S. 1989, ApJ, 345, 245
- Cox (2000) Cox, A. N. 2000, Allen’s astrophysical quantities (Allen’s astrophysical quantities, 4th ed. Publisher: New York: AIP Press; Springer, 2000. Editedy by Arthur N. Cox. ISBN: 0387987460)
- Cutri et al. (2003) Cutri, R. M., Skrutskie, M. F., van Dyk, S., Beichman, C. A., Carpenter, J. M., Chester, T., Cambresy, L., Evans, T., Fowler, J., Gizis, J., Howard, E., Huchra, J., Jarrett, T., Kopan, E. L., Kirkpatrick, J. D., Light, R. M., Marsh, K. A., McCallon, H., Schneider, S., Stiening, R., Sykes, M., Weinberg, M., Wheaton, W. A., Wheelock, S., & Zacarias, N. 2003, 2MASS All Sky Catalog of point sources.
- Dupree (1986) Dupree, A. K. 1986, ARA&A, 24, 377
- Dyck et al. (1996) Dyck, H. M., Benson, J. A., van Belle, G. T., & Ridgway, S. T. 1996, AJ, 111, 1705
- Dyck et al. (1974) Dyck, H. M., Lockwood, G. W., & Capps, R. W. 1974, ApJ, 189, 89
- Fluks et al. (1994) Fluks, M. A., Plez, B., The, P. S., de Winter, D., Westerlund, B. E., & Steenman, H. C. 1994, A&AS, 105
- Fukugita et al. (1995) Fukugita, M., Shimasaku, K., & Ichikawa, T. 1995, PASP, 107, 945
- Guandalini (2010) Guandalini, R. 2010, A&A, 513, A4
- Heap & Lindler (2011) Heap, S. R. & Lindler, D. 2011, in Astronomical Society of the Pacific Conference Series, Vol. 448, 16th Cambridge Workshop on Cool Stars, Stellar Systems, and the Sun, ed. C. Johns-Krull, M. K. Browning, & A. A. West, 887
- Heck et al. (1984) Heck, A., Egret, D., Jaschek, M., Jaschek, C., & Battrick, B., eds. 1984, ESA Special Publication, Vol. 1052, IUE low dispersion spectra reference atlas. Part 1: Normal stars
- Johnson (1968) Johnson, H. L. Interstellar Extinction, ed. B. M. Middlehurst & L. H. Aller (the University of Chicago Press), 167
- Lockwood (1972) Lockwood, G. W. 1972, ApJS, 24, 375
- Lockwood (1973) —. 1973, ApJ, 180, 845
- Lockwood & Wing (1971) Lockwood, G. W. & Wing, R. F. 1971, ApJ, 169, 63
- Mermilliod et al. (1997) Mermilliod, J.-C., Mermilliod, M., & Hauck, B. 1997, A&AS, 124, 349
- Neugebauer & Leighton (1969) Neugebauer, G. & Leighton, R. B. 1969, Two-micron sky survey. A preliminary catalogue
- Ochsenbein et al. (2000) Ochsenbein, F., Bauer, P., & Marcout, J. 2000, A&AS, 143, 23
- Pickles (1998) Pickles, A. J. 1998, PASP, 110, 863
- Rau et al. (2015) Rau, G., Paladini, C., Hron, J., Aringer, B., Groenewegen, M. A. T., & Nowotny, W. 2015, ArXiv e-prints
- Rayner et al. (2009) Rayner, J. T., Cushing, M. C., & Vacca, W. D. 2009, ApJS, 185, 289
- Rufener (1976) Rufener, F. 1976, A&AS, 26, 275
- Seaton & Badnell (2004) Seaton, M. J. & Badnell, N. R. 2004, MNRAS, 354, 457
- Seaton et al. (1994) Seaton, M. J., Yan, Y., Mihalas, D., & Pradhan, A. K. 1994, MNRAS, 266, 805
- van Belle et al. (2007) van Belle, G. T., Ciardi, D. R., & Boden, A. F. 2007, ApJ, 657, 1058
- van Belle et al. (1999) van Belle, G. T., Lane, B. F., Thompson, R. R., Boden, A. F., Colavita, M. M., Dumont, P. J., Mobley, D. W., Palmer, D., Shao, M., Vasisht, G. X., Wallace, J. K., Creech-Eakman, M. J., Koresko, C. D., Kulkarni, S. R., Pan, X. P., & Gubler, J. 1999, AJ, 117, 521
- van Belle et al. (2008) van Belle, G. T., van Belle, G., Creech-Eakman, M. J., Coyne, J., Boden, A. F., Akeson, R. L., Ciardi, D. R., Rykoski, K. M., Thompson, R. R., Lane, B. F., & PTI Collaboration. 2008, ApJS, 176, 276
- van Belle & von Braun (2009) van Belle, G. T. & von Braun, K. 2009, ApJ, 694, 1085
- Wing (1967) Wing, R. F. 1967, PhD thesis, University of California, Berkeley.
- Wing & Lockwood (1973) Wing, R. F. & Lockwood, G. W. 1973, ApJ, 184, 873
Star JD 2440000+ Spectral Type 0.55m 78 87 88 104 105 1.25m 1.65m 2.2m 3.4m 5.0m 10.2m IRC-30217 1050 M9.8 -14 0.0019 0.301 1.51 1.86 12.67 6.54 39.61 45.47 46.33 34.90 IRC-30217 1107 M9.3 0.0124 1.043 4.67 5.50 25.87 16.06 51.02 58.32 49.07 54.06 IRC-20293 1051 M7.9 -13.74 0.0580 1.813 8.91 8.71 29.71 28.56 99.51 82.74 59.68 10.07 IRC-10236 1049 c 0.0171 0.600 1.02 1.10 2.20 2.43 30.05 111.62 376.56 516.27 IRC+00028 1215 M7.9 -13.56 0.1752 3.702 18.18 16.60 52.83 50.79 94.78 137.36 116.88 76.88 40.81 31.11 IRC+00266 1050 M9.6 -14.25 0.0006 0.069 0.47 0.58 4.29 2.43 24.43 30.04 30.61 19.18 IRC+00266 1107 M9.9 0.0003 0.045 0.35 0.44 3.49 1.80 18.96 20.22 IRC+00281 1049 M7.8 0.1158 2.446 11.21 10.47 32.57 32.04 97.24 79.02 47.41 IRC+10011 1251 0.02 0.40 0.22 1.94 15.06 84.67 367.99 IRC+10050 1277 M9.5 0.0450 7.053 39.78 50.13 373.98 221.69 655.69 1252.70 1540.72 2117.56 IRC+10313 1215 M8.4 0.0206 0.756 3.80 3.72 16.32 13.67 32.11 53.44 47.61 33.56 IRC+10523 1215 M9.1 -13.4 0.0298 2.082 10.46 10.97 56.60 37.65 103.92 157.71 161.33 153.40 138.30 220.23 IRC+10523 1251 M9.2 0.0211 1.543 8.12 8.91 54.06 34.34 94.78 150.61 150.57 143.16 IRC+10525 1251 M8.5 0.0061 0.810 4.89 5.13 21.52 17.61 37.73 65.74 82.74 111.13 148.89 IRC+20052 1215 M8.1 -13.42 0.0820 2.873 14.44 13.81 54.06 49.63 116.60 189.60 172.87 124.69 76.00 41.01 IRC+20281 1109 M9.3 0.0006 0.043 0.28 0.34 2.53 1.61 42.43 78.67 87.68 IRC+20328 1106 M9.8 0.0030 0.406 2.24 2.75 19.63 10.61 92.84 116.37 87.68 IRC+30021 1106 M8.9 0.0016 0.287 1.78 1.95 11.56 8.43 62.77 75.13 67.74 138.96 IRC+30021 1214 M9.4 -13.89 0.125 0.69 0.87 6.07 3.76 16.47 39.61 48.72 58.32 89.29 126.73 IRC+30021 1251 M9.6 0.0004 0.085 0.58 0.69 5.16 2.99 13.70 30.75 43.42 53.19 IRC+30021 1277 M9.7 0.063 0.41 0.52 4.20 2.38 12.21 29.37 38.70 47.41 IRC+30055 1215 M7.9 -13.78 0.0401 1.440 7.24 6.61 24.15 23.75 48.61 80.88 73.74 50.80 43.73 24.71 IRC+30292 1074 M8.6 -13.87 0.154 0.93 1.05 6.50 5.32 39.61 62.77 90.33 63.21 121.03 IRC+30292 1215 M9.6 -14.06 0.039 0.26 0.34 2.47 1.43 7.19 20.79 34.49 48.51 66.19 89.72 IRC+30515 1215 M7.9 -13.25 0.2475 6.583 32.33 28.85 96.13 92.42 184.80 280.44 238.63 156.98 109.85 59.28 IRC+40004 1215 -13.51 0.13 0.15 2.10 1.61 14.34 52.22 99.48 176.13 295.68 460.13 IRC+40004 1251 M9.1 0.0006 0.011 0.13 0.15 1.67 1.19 10.88 43.44 84.67 149.91 290.32 IRC+40442 1251 M9.3 0.0045 0.548 3.39 4.07 27.09 16.82 71.90 147.18 157.66 133.61 49.30 IRC+40448 1215 M7.0 -12.63 0.059 0.50 0.48 3.18 3.60 14.34 82.76 361.18 1367.21 2635.23 6499.48 IRC+40485 1215 c -13.47 0.0175 0.791 1.55 1.74 3.83 4.22 11.66 41.48 106.59 211.76 363.76 304.00 IRC+40485 1251 c 0.0253 1.043 1.95 2.29 4.93 5.32 14.34 48.74 122.38 232.19 215.22 IRC+50096 1215 c -13.13 0.0899 2.180 3.80 4.37 8.37 9.03 22.74 68.84 193.97 485.11 814.36 918.08 IRC+50096 1251 c 0.1056 2.282 4.17 4.68 9.18 10.37 26.10 80.88 222.70 556.98 IRC+50260 1054 M7.0 0.2257 2.180 9.11 8.13 21.17 52.22 39.60 24.31 IRC+50261 1078 M6.0 0.1712 2.682 9.54 8.71 16.70 17.61 34.50 27.40 19.31 IRC+50357 1215 c -13.83 0.05 0.15 0.84 5.34 22.79 88.27 209.32 200.85 IRC+60015 1251 M7.8 0.1392 3.224 16.21 14.79 44.96 45.26 84.47 131.17 114.22 75.13 18.74 IRC+60052 1251 M6.0 0.0985 2.940 12.29 11.75 27.72 29.91 52.08 92.86 82.74 58.32 21.03 IRC+60092 1215 M8.6 -13.24 0.477 3.55 3.80 23.60 19.31 59.80 143.83 212.68 299.11 408.15 799.61 IRC+60169 1054 M9.3 0.0127 1.543 7.58 8.91 52.83 32.79 274.06 321.90 343.43 460.13 IRC+60184 1054 M8.8 0.0175 0.930 4.46 4.68 22.02 16.43 49.87 59.94 47.41 IRC+60288 1106 M9.3 0.0040 0.435 3.09 3.47 23.06 14.31 67.25 62.49 47.95 33.33 IRC+60288 1214 M8.2 -13.64 2.873 15.48 14.79 42.94 36.79 62.62 95.03 88.66 82.38 66.19 68.06 IRC+60288 1251 M8.2 0.0430 2.446 13.79 13.49 42.94 36.79 65.57 111.65 104.17 92.44 IRC+60289 1215 M7.9 0.0221 0.773 4.36 3.98 13.89 13.36 28.62 44.45 39.60 27.91 24.59 IRC+60316 1215 M6.0 -13.71 0.0608 2.336 10.96 10.24 27.09 28.56 55.81 97.24 90.72 63.95 36.38 24.71 IRC+60334 1251 M8.9 0.0076 0.629 3.31 3.72 19.63 13.99 39.51 79.04 101.79 111.13 78.14 IRC+70102 1052 M9.0 -13.92 0.0111 0.791 3.71 4.07 18.74 12.47 54.68 52.21 50.80 39.16 IRC+70171 1215 M9.2 -13.73 0.0023 0.338 1.90 2.34 13.27 8.43 34.41 75.48 90.72 90.33 70.93 74.62 IRC+70171 1251 M9.3 -13.84 0.0016 0.262 1.44 1.82 10.54 6.54 23.81 58.59 72.06 71.75 62.07 IRC+80005 1050 M9.5 0.0011 0.181 1.44 1.78 12.38 7.34 32.86 61.35 62.77 51.98 IRC+80005 1215 M9.2 -13.77 0.0007 0.294 2.24 2.34 15.59 9.90 45.36 79.04 80.86 66.96 51.38 24.15 R And 1214 -12.76 0.0878 7.386 35.45 38.91 138.95 156.95 443.30 790.40 772.19 717.52 603.70 680.58 R And 1277 0.0136 1.344 8.91 8.91 44.96 54.42 136.99 329.49 378.20 422.51 W And 1215 M6.5 -12.8 1.2990 21.797 97.65 93.35 270.92 272.74 532.97 754.83 642.28 474.06 331.76 225.36 W And 1251 M7.9 0.2419 10.195 51.25 50.13 191.80 188.69 336.28 559.40 432.35 W And 1277 M8.3 0.1056 5.351 29.49 31.63 145.49 124.67 386.10 572.59 522.06 412.89 W And 1302 M8.9 0.0505 3.079 17.77 19.96 112.94 82.37 559.40 496.41 T Aqr 1251 M8.0 0.0259 1.043 5.37 4.68 12.97 11.91 17.25 22.28 19.40 15.34 T Ari 1214 M7.0 -12.9 1.3292 28.734 128.73 112.23 264.75 272.74 395.09 599.58 476.13 335.61 240.34 103.01 U Ari 1251 M9.5 0.0094 1.226 9.33 10.00 66.50 38.53 108.82 154.12 140.52 136.72 U Ari 1277 0.0164 79.95 46.32 111.35 161.38 147.14 133.61 R Boo 1078 MB.l 0.0783 2.621 16.21 14.79 51.62 45.26 109.11 90.72 70.12 R Cam 1078 0.3417 8.287 16.21 17.38 27.09 29.22 62.78 46.53 32.05 R Cas 1214 M9.3 -12.22 0.1635 16.159 89.06 104.74 606.52 367.92 1537.09 2617.26 2739.83 2487.92 1999.03 2008.53 R Cas 1251 M9.7 0.0783 9.737 54.91 69.20 481.77 260.47 1015.54 1896.04 2126.79 1931.24 1078.65 R Cas 1302 M9.9 0.0783 8.480 45.67 56.25 449.62 232.14 2386.29 2545.87 T Cas 1214 M8.9 -12.52 0.1131 10.676 66.02 70.81 373.98 260.47 905.10 1506.08 1405.15 1061.30 742.71 481.81 T Cas 1251 M8.7 0.1752 14.737 89.06 95.52 481.77 367.92 1039.20 1577.05 1471.38 1163.69 325.75 V Cas 1214 M7.9 -13.13 0.3263 8.880 48.94 44.68 142.18 136.70 249.29 361.28 300.42 221.74 135.15 62.07 Y Cas 1214 MB.l -13.13 0.3496 11.979 48.94 47.87 138.95 121.83 202.63 307.50 293.58 254.59 195.35 170.95 SS Cas 1277 M4.0 1.2405 8.287 16.97 16.60 22.53 24.31 29.97 39.61 32.94 25.46 T Cep 1214 M8.6 0.8782 42.501 251.00 251.24 1210.16 924.17 2273.52 3371.68 2868.96 2117.56 R Cyg 1214 1.9213 45.541 87.03 93.35 159.53 164.34 255.09 353.06 293.58 254.59 X Cyg 1214 M8.2 0.4504 49.935 467.38 398.20 1632.46 1431.38 2671.15 3696.98 3611.80 3434.29 S Lac 1251 M8.2 -13.77 0.0517 1.653 8.12 8.13 32.57 28.56 57.11 79.04 72.06 53.19 12.67 R Leo 1109 15770.54 122383.85 10135.30 5634.02 3333.33 W Lyr 1214 M6.5 0.1835 2.682 10.23 9.12 18.74 18.87 26.10 36.13 30.04 23.76 V Mon 1277 M5.0 2.9081 39.665 114.73 109.67 200.84 211.72 313.83 454.83 361.18 266.59 R Tri 1214 M5.0 -13.03 10.3182 68.929 154.76 147.94 220.21 226.86 273.34 378.31 280.37 211.76 178.16 78.14 R Tri 1251 M5.5 5.0536 51.098 151.24 141.28 241.46 248.74 321.14 454.83 344.92 248.79 R Tri 1277 M7.0 1.3602 21.797 99.92 89.14 210.30 216.65 321.14 434.36 352.96 254.59 W Peg 1214 M8.9 -12.84 0.1185 7.218 34.65 38.91 187.43 133.58 433.21 688.41 657.24 519.80 363.76 241.48 Z Peg 1214 M8.5 -13.3 0.0529 2.940 16.21 16.99 71.26 58.31 172.46 244.26 227.89 176.13 91.37 52.83
SED Fitting Results Star JD 2440000+ DLC74 SpType Fit SpType DLC74 DOF Fit DOF (mag) DLC74 IRC-30217 1050 M9.8 M8III 428.16 0.82 1107 M9.3 M8III 549.87 0.13 IRC-20293 1051 M7.9 M7III 33.41 0.58 IRC-10236 1049 c M2III 355.15 18.15 IRC+00028 1215 M7.9 M7III 31.44 0.58 IRC+00266 1050 M9.9 M8III 421.87 0.48 1107 M9.6 M8III 298.95 1.10 IRC+00281 1049 M7.8 M7III 41.11 0.36 IRC+10011 1251 M8.5 M9.5III 319.69 0.45 IRC+10050 1277 M9.5 M8III 405.86 0.50 IRC+10313 1215 M8.4 M7.5III 11.12 0.87 IRC+10523 1215 M9.2 M8III 11.87 0.69 1251 M9.1 M8III 9.46 0.71 IRC+10525 1251 M8.5 M9III 2.70 0.13 IRC+20052 1215 M8.1 M7III 25.20 1.19 IRC+20281 1109 M9.3 M8.5III 157.80 0.52 IRC+20328 1106 M9.8 M8III 450.70 0.73 IRC+30021 1106 M9.6 M8.5III 272.57 0.11 1214 M8.9 M8III 2.18 0.81 1251 M9.4 M8III 278.96 0.75 1277 M9.7 M8III 241.15 1.15 IRC+30055 1215 M7.9 M7III 31.15 0.58 IRC+30292 1074 M8.6 M9III 1.88 0.08 1215 M9.6 M8III 156.50 0.50 IRC+30515 1215 M7.9 M7III 32.94 0.70 IRC+40004 1215 M9.1 M9.5III 8.38 12.28 1251 M9.0 M9.5III 10.62 8.52 IRC+40442 1251 M9.3 M8III 355.87 1.49 IRC+40448 1215 M7.0 M9.5III 204.46 14.00 IRC+40485 1215 c M2III 350.92 6.39 1251 c M2III 388.18 6.13 IRC+50096 1215 c M2III 463.34 8.76 1251 c M2III 425.89 8.06 IRC+50260 1054 M7.0 M6.5III 2.45 0.30 IRC+50261 1078 M6.0 M5.5III 2.35 0.28 IRC+50357 1215 c M9.5III 89.99 14.10 IRC+60015 1251 M7.8 M7III 40.14 0.35 IRC+60052 1251 M6.0 M5.5III 1.63 0.17 IRC+60092 1215 M8.6 M9III 2.00 0.13 IRC+60169 1054 M9.3 M8III 347.40 0.26 IRC+60184 1054 M8.8 M8.5III 18.37 0.27 1106 M9.3 M8III 496.80 0.49 IRC+60288 1214 M8.2 M7III 17.24 0.53 1251 M8.2 M7.5III 20.50 0.48 IRC+60289 1215 M7.9 M7III 32.03 0.78 IRC+60316 1215 M6.0 M6III 2.52 0.28 IRC+60334 1251 M8.9 M8.5III 1.96 0.14 IRC+70102 1052 M9.0 M8III 8.50 0.29 IRC+70171 1215 M9.3 M8III 308.81 0.88 1251 M9.2 M8III 11.22 0.34 IRC+80005 1050 M9.2 M8III 28.41 2.07 1215 M9.5 M8III 388.53 2.40 R And-A 1214 S-type M10III 476.42 1.71 1277 S-type M10III 629.77 1.29 W And-A 1215 M8.9 M9III 2.16 0.66 1251 M8.3 M8.5III 24.07 0.73 1277 M7.9 M8III 29.15 2.30 1302 M6.5 M6.5III 5.25 0.12 T Aqr-A 1251 M8.0 M8III 40.41 0.88 T Ari-A 1214 M7.0 M7III 3.32 0.22 U Ari-A 1251 M9.5 M9.5III 478.73 1.48 1277 mid M? M9.5III 948.13 0.80 R Boo-A 1078 M8.1 M8III 17.42 0.54 R Cam-A 1078 S-type M10III 1169.95 0.49 R Cas-A 1214 M9.7 M9.5III 394.35 1.77 1251 M9.9 M10III 423.20 1.18 1302 M9.3 M9.5III 428.99 1.09 T Cas-A 1214 M8.9 M9III 18.51 1.96 1251 M8.7 M8III 13.98 1.54 V Cas-A 1214 M7.9 M8III 31.07 0.61 Y Cas-A 1214 M8.1 M8III 21.31 0.47 SS Cas-A 1277 M4.0 M4III 3.44 0.68 T Cep-A 1214 M8.6 M8III 11.20 1.42 R Cyg-A 1214 S-type M10III 1056.44 0.56 X Cyg-A 1214 M8.2 M8III 15.39 0.71 S Lac-A 1251 M8.2 M8III 16.18 0.95 W Lyr-A 1214 M6.5 M6.5III 13.15 0.21 V Mon-A 1277 M5.0 M5III 2.24 0.42 R Tri-A 1214 M7.0 M7III 3.52 0.85 1251 M5.5 M5.5III 8.62 0.79 1277 M5.0 M5III 13.95 0.43 W Peg-A 1214 M8.9 M9III 15.10 1.69 Z Peg-A 1214 M8.5 M8.5III 19.11 1.75
Appendix A sedFit Plots
The summary spectral energy distribution fitting plots from sedFit for each of the stars discussed in §II.2 are presented in Figures A1-A14.