∎
Pfaffenwaldring 57, D-70550 Stuttgart, Germany
Tel.: +49-711-685 64946
Fax: +49-711-685 64886
22email: dressel@pi1.physik.uni-stuttgart.de
Molecular Dynamics at Electrical- and Optical-Driven Phase Transitions
Abstract
The time-dependent optical properties of molecular systems are investigated by step-scan Fourier-transform spectroscopy in order to explore the dynamics at phase transitions and molecular orientation in the milli- and microsecond range. The electrical switching of liquid crystals traced by vibrational spectroscopy reveals a rotation of the molecules with a relaxation time of 2 ms. The photo-induced neutral-ionic transition in TTF-CA takes place by a suppression of the dimerization in the ionic phase and creation of neutral domains. The time-dependent infrared spectra depend on temperature and laser pulse intensity; the relaxation of the spectra follows a stretched-exponential decay with relaxation times in the microsecond range strongly dependent on temperature and laser intensity. We present all details of the experimental setups and thoroughly discuss the technical challenges.
Keywords:
Fourier-transform infrared spectroscopy step-scan technique time dependent phenomena vibrational spectroscopy liquid crystals photo-induced phase transition1 Introduction
Fourier-transform infrared (FTIR) spectroscopy is a widely utilized method to investigate the optical response of gasses, liquids and solids Bell72 ; Gremlich03 ; Griffiths07 ; Smith11 . In general, steady-state properties are measured, however, numerous approaches have been developed over the years to explore time-dependent phenomena by Fourier-transform interferometry Sloan89 ; Smith02 , many of them optimized for a certain time regime. Standard rapid-scan techniques are limited by the mirror velocity to a fraction of a second (typically 10 ms), depending on the spectral resolution required: . Since this is often not sufficient, step-scanning is nowadays implemented in several high-end commercial Fourier-transform instruments because there is no inherent time limit. It covers the largest dynamical range with a time resolution of the order of nanoseconds determined by the current detector and electronics technology Smith02 ; Laubereau85 ; Griffiths99 and still achieving a high spectral resolution cm-1. The only restriction is the repeatability of the process: depending on the resolution, spectral range and desired signal-to-noise ratio, it has to be executed hundreds of times.
In contrast to the continuously moving interferometer mirror in the rapid-scan configuration, the advantage of the step-scan method is the continuous recording of the signal at a fixed mirror position. This is repeated after the mirror has moved to the next position, eventually composing the complete interferogram. The step-scan technique is mainly applied in biophysics and polymer chemistry where, for instance, the photolysis processes of chemical reactions Johnson93 , bacteria systems Uhmann91 ; Hessling97 ; Rammelsberg97 ; Rammelsberg99 ; Schleeger09 and the time-dependent reorientation of liquid crystals under the influence of a short electric field Gregoriou91 ; Katayama95 ; Katayama97 ; Verma01 ; Huang06 are studied. But also temperature- and light-induced phase transitions can be investigated Peterseim15 ; Peterseim16 . Furthermore, it is used to examine the characteristics of lasers and their mode spectra Johnson93 and for photo-reflection measurements of semiconducting materials as well as quantum wells Shao06 ; Shao07 .
Here we want to present and discuss our experimental setups employed to investigate the dynamics of phase transitions. Tracing the vibrational spectra of molecules, we probe the configurational changes after the transition has been triggered either by a short laser pulse (Sec. 4) or by an electrical pulse (Sec. 3).
2 Trigger and Data Acquisition
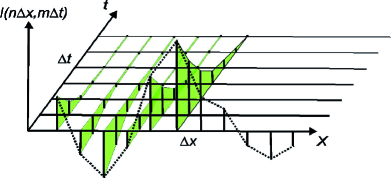
In the left panel of Fig. 1 the data acquisition of a step-scan measurement is schematically depicted. At each mirror position along the traveling distance of the mirror the temporal varying reflection signal is recorded. The complete interferogram is sampled for various times and retardations by successive stepwise moving of the mirror. A subsequent Fourier transformation for each measured time point in the intensity “matrix” derives the time-resolved spectrum . The process can be repeated several times to improve the signal-to-noise ratio whereas at each position the time-dependent signal is averaged (typically 10 to 50 times). Additionally, the stability of the mirror influences the signal-to-noise ratio significantly Uhmann91 ; Rodig99 , therefore, one must take care that the spectrometer is located in a vibration-free and silent environment. For this reason we place our FTIR-spectrometer on a heavy optical bench mounted on air attenuators to decouple the system from the environment. Furthermore, the vacuum pumps were placed in a separated room to reduce vibrations and acoustic noise. This way we reached a mirror stability better than 3 nm.

Since the data acquisition at each mirror position has to start always at the same time, the data recording must be synchronized with the external stimulation source (laser or pulse generator). Thus, the trigger signal sequence is very important and crucial in a step-scan measurement. The temporal sequence of the TTL control signals is visualized in the right panel of Fig. 1. An external or an internal trigger signal T1, which is correlated with the beginning of the reaction, controls the data acquisition. Yet, before the recording starts, the spectrometer sends a signal T2 to the interferometer, so that the mirror is moved to the next position. There, it is stabilized for a few milliseconds. After the stabilization procedure ( ms) the next arising trigger signal T1 is used as a starting signal for the record window T3. The signal T3 stays high for the total recording time ( total number of time slices) which is defined at the beginning of each measurement. As soon as the signal T3 is on, at each TTL-signal T4 the detector signal is captured. Depending on the number of averaging spectra this procedure is repeated several times starting again with the T3 signal. Subsequently, the mirror moves to the next position.
The time resolution depends mainly on the response time of the detector. Standard PC-MCT-detectors, operating in the photo-current mode, have a minimum response time of s. Their disadvantage is that the measured current becomes nonlinear above a certain incident threshold intensity. A photovoltaic (PV) detector has a two order of magnitudes shorter response time due to the small detector area. Furthermore, the measured signal is always proportional to the incident light intensity. For the measurement a PC-MCT of the model D316 (Bruker Optics, Ettlingen) with a time resolution of about 1 s and a PV-MCT KMPV11-11-1-J1 from Kolmar Technologies with a theoretical rise time of 25 ns are utilized. The time resolution also depends on the amplifier and the A/D-converter. There are two amplifiers, the build-in amplifier of the spectrometer and the KA100-A1 from Kolmar Technologies with a bandwidth of 250 MHz. As an A/D-converter the internal converter of the spectrometer with its time resolution of 6 s, with a dynamical range of 24 bit and a maximal input voltage of V, can be used, or a transient recorder M3i.4142 from Spectrum Systementwicklung Microelectronic GmbH, Grosshansdorf with a bandwidth of 400 MHz at 16 bit and V.
The standard interferogram of a Fourier-transform spectrometer consists of an ac- and dc-component: while only the ac-signal contains the important spectral information the dc-signal is usually removed by an electronic high-pass filter. The phase correction can only be performed directly for a rapid-scan measurement. In a step-scan experiment the spectrum can include positive as well as negative features. Thus, a phase correction with the raw time-resolved ac-signal does not work. Two options exist to resolve this complication: first, the simultaneously recording of the dc-signal and the ac-signal; the dc-component provides the right phase correction for the ac-component. The second possibility is to use the phase of a previous rapid-scan measurement Griffiths07 ; Herres84 ; Peterseim15d .
3 Electrical Switching
Electrically induced phenomena occur mainly in semiconductor leading to non-linear conductivity or negative differential resistance Sze07 ; Yu10 . High electric fields can also trigger phase transitions, for instance in charge-density wave systems Gruner94 or correlated insulators Asamitsu97 ; Sawa08 . In organic conductors electrical switching is subject of research for quite some time Potember79 ; Tokura88 ; Kumai99 ; Inagak04 ; Mori07 ; Ivek12 ; Peterseim16 .
As an example of electric switching, we here have investigated the polarization-dependent vibrational modes of liquid crystals, which allow us to trace the orientation of the molecule upon applying a voltage by time-resolved infrared measurements. In these molecules several vibrational modes exist which can be assigned to different parts of the molecules. By static and time-resolved polarization-dependent measurements we gain on the one hand information about the orientation of the individual molecular building blocks in static positions and on the other hand about the temporal evolution of the electric switching process. Hence, we learn about the rotation of the different molecular constituents with the electric field.
3.1 Liquid Crystals
Liquid crystals are widely used for electronic displays due to the possibility to manipulate the orientation of the complex organic molecules by applying an electric field and this way to control the transmitted light. We have chosen the FELIX 017/100 mixture from the Clariant as a ferroelectric liquid crystal that constitutes a chiral smectic C phase (SmC∗) at ambient conditions creating a helical structure with , as depicted in Fig. 2(a). The spontaneous electric polarization is perpendicular to the director vector and the layer normal vector . While in general the different orientations average and the total polarization is zero, a uniaxial rubbed surface aligns the molecules parallel to each other, leading to a net polarization, sketched in Fig. 2(b). The whole procedure is well-known as “surface stabilized ferroelectric liquid crystal” (SSFLC) Clark80 . Two energetically equal configurations exist with arranged in opposite directions, but perpendicular to the surface with the same tilting angle . An applied electric field can now induce the transition between the two polarization states by changing the orientation of the molecule.
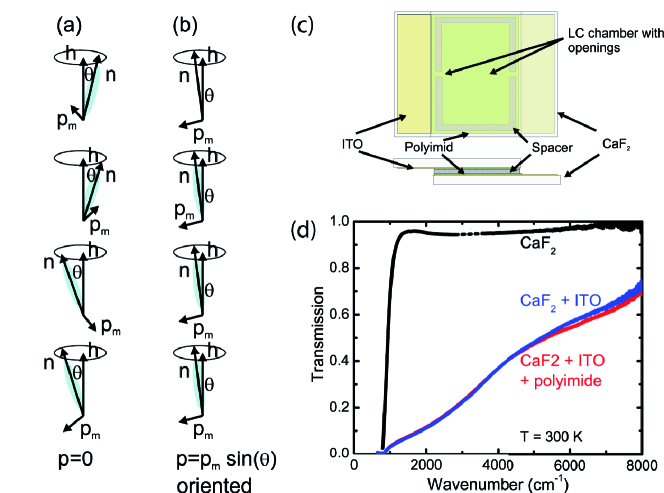
While standard liquid-crystal cells consist of glass windows transparent in the visible, we have constructed a cell with two CaF2 windows suitable for the infrared spectral range from 1000 cm-1 to 50 000 cm-1 Palik09 . In Fig. 2(d) the transmission spectrum of a CaF2 window is plotted in the mid-infrared frequency range. Compared to alternative window materials, such as KBr, it is not hydroscopic, and with has a much lower refractive index than Ge (), for instance, reducing the reflection losses considerably. The CaF2 windows ( mm2, thickness of mm, purchased from Korth Kristalle GmbH, Kiel) are polished optically to get the optimal surface quality for the optical experiments.
Both CaF2 windows are sputtered with a thin film of indium tin oxide (ITO) commonly used as an electrode material for displays because it is lucent over a broad energy range and at the same time conductive. However, optical measurements plotted in Fig. 2(d) reveal that the transmission decreases rapidly towards low frequencies Biswas03 . In the range of interesting for the C=C double bond vibrations the transmission is between 5 and 20%, which is still sufficient for our experiment. In order to preorient the liquid-crystal molecules a very thin film of polyimide was deposited on top of the ITO layer by using the spin-coating technique which was rubbed afterwards unidirectional [Fig. 2(c)]. As soon as the molecules were placed on the surface, they align themselves along the rubbing direction Sakamoto94 . As demonstrated in Fig. 2(d) the very thin layer of polyimide does not affect the overall light transmission of the system in the relevant frequency range in agreement with previous results Gregoriou91 ; Verma97 ; Huang06 . Both plates have been clued together with a UV glue mixed with small macroscopic plastic spheres with a diameter of m which serve as spacer to keep the windows on a constant distance, as sketched in Fig. 2(c). After the glue was cured, the cell was heated up above C so that the liquid-crystal mixture transformed in the isotropic phase with a reduced viscosity. The liquid crystals were sucked in the chamber due to the capillary action. Afterwards, the temperature of the melt was slowly lowered so that a single domain was formed. Due to the large dimension of the cell the distance of the two plates was not constant and reduces to the center of the cell causing Newton’s rings. It changes again, when placed in a vacumm spectrometer. The contact wires were made out of copper and fixed on the exposed ITO side areas with indium; they are connected to a Philips-PM 5768B pulse generator to switch the liquid crystals. The generator sends during the measurement simultaneously to the switching voltage pulse a second TTL signal to the spectrometer to start the data acquiring process.
The cell is placed in a Bruker Vertex 66v/s Fourier-transform infrared spectrometer together with a suitable infrared polarizer. The absorption becomes maximal if the infrared light is polarized parallel to the electronic transition dipole moment of the molecular vibrational mode. As soon as the external electric field is switched on, a force acts on the liquid crystal. In general, the switching process takes a few microseconds until most of the molecules are reoriented. The new orientation of the molecules and its director change the direction of the transition dipole moment leading to an increase or decrease of the absorption signal.
If the electric field is switched on, the directors shown in Fig. 2(b) spin collectively in one direction and therefore, the azimuthal angle changes. The switching velocity and -time can be derived from the equation of motion Clark83 ; Handschy88 ; Goodby14 :
| (1) |
with the damping due the viscosity of the liquid, is the angle between the electric field and the polarization of the molecule, is the coordinate along the direction perpendicular to the window, and the elasticity constant. Due to the large moment of inertia kg/m the equation can be simplified to and solved for small angles
| (2) |
with m as the spacing between the two cell windows. We can extract two time constants, for rise with the field and for fall after the electric field is turned off:
| (3) |
The switching time for the here examined material FELIX 017/100 can be estimated using Ns/cm2, nC/cm2, N, kV/cm, and m to yield s and ms.
3.2 Steady-State Optical Properties
The mid-infrared transmission spectrum of the liquid crystal cell filled with FELIX is displayed Fig. 3.
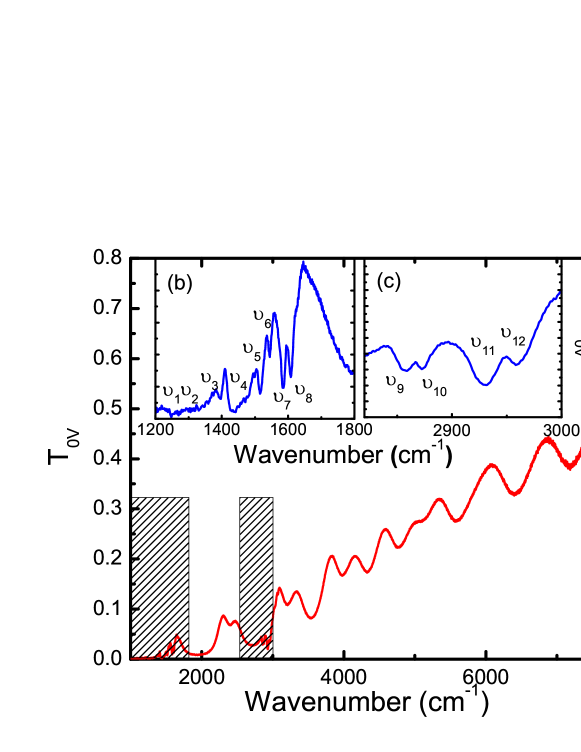
The dips in the spectrum between 1000 cm-1 and 1700 cm-1 as well as between 2800 and 3000 cm-1, enlarged in the insets (b) and(c), be assigned to the vibrational modes of the liquid-crystal molecules. The features are stretching modes of CH2- and CH3 end group. The modes are connected with the vibrations of the C=C double bonds belonging to the center part of the molecules. The features at 1439 and 1395 cm-1 can be referred to the wiggling and torsion of the CH3 group. The low-lying resonances at 1269 and 1243 cm-1 belong to an asymmetric stretch oscillation of the C-O-C bond. The position of the detected features perfectly coincides with the resonance frequencies determined by Huang and Shih Huang06 .
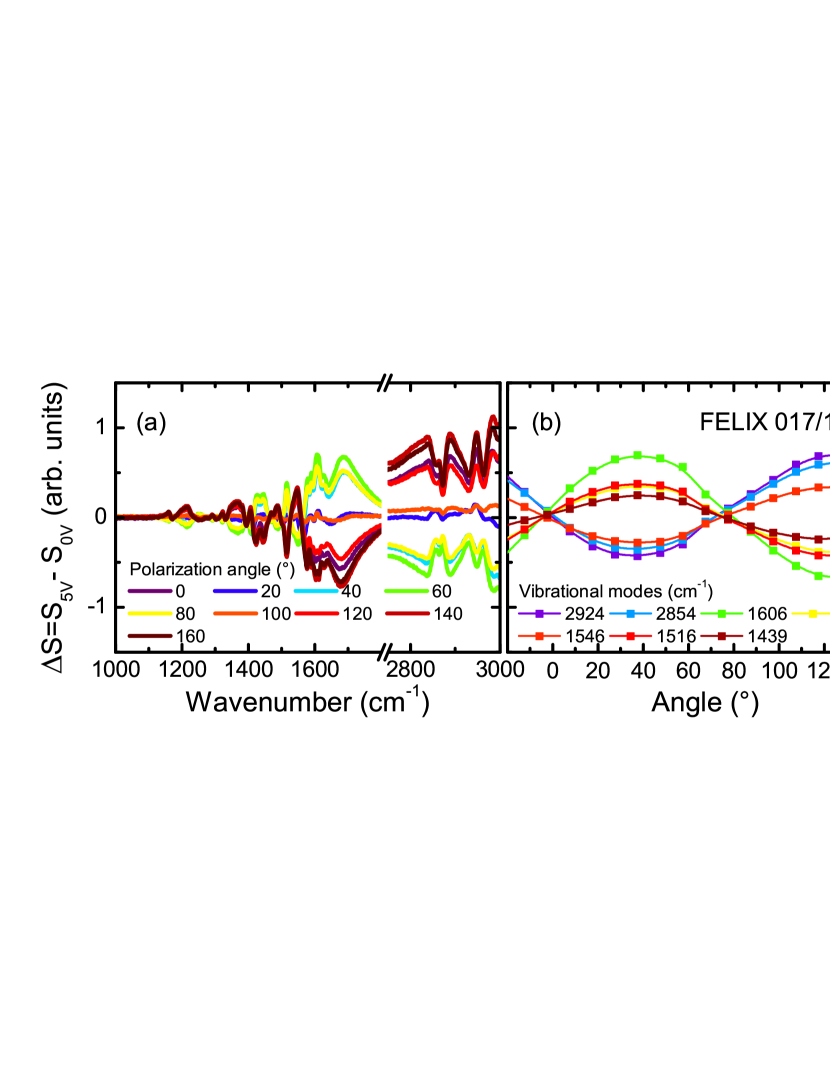
Fig. 4 shows a change of the infrared spectra when an electric field of V is applied. All measurements were performed at C. Due to the rearrangement of the liquid-crystal molecules a strong modification of the intensity could be observed. We can can deduce two different-oriented transition dipole moments: the first belongs to the vibrational mode of the rigid body of the molecule and the other points out from the molecule axis related to the end groups. The modes containing the CH2 and CH3 bonds exhibit a minimum at and a maximum at , correspondingly. The minimum of the modes belonging to the molecule body are slightly shifted and can be found at . The green curve, for instance, belongs to a vibrational mode with an aligned dipole moment parallel to the central molecular frame. At it reaches a maximum for a voltage of 5 V, this means that the dipole moment rotates away from the electric field vector of the infrared light. Hence, the transmitted intensity increases at this specific wavelength. In contrast, the intensity of the dipole moments related to the end groups of the molecule is reduced because the transition dipole moments are aligned parallel to the incident radiation.
3.3 Time-Dependent Optical Behavior
In order to investigate the dynamics of the liquid-crystal switching process the polarizer was fixed at an angle of , and voltages between 4 and 6 V applied between the two plates. The time-dependent infrared signal is presented in a contour plot in Fig. 5. The rectangular voltage pulse had a width of 2 ms with a repetition rate of 30 Hz and the signal was recorded for a period of 4 ms. To improve the signal-to-noise ratio, five spectra were averaged. The time resolution was set to 25 s and the spectral resolution was 2 cm-1. We can conclude that the liquid crystal molecules rotate and reorient like a stiff body under the influence of an external electric field.
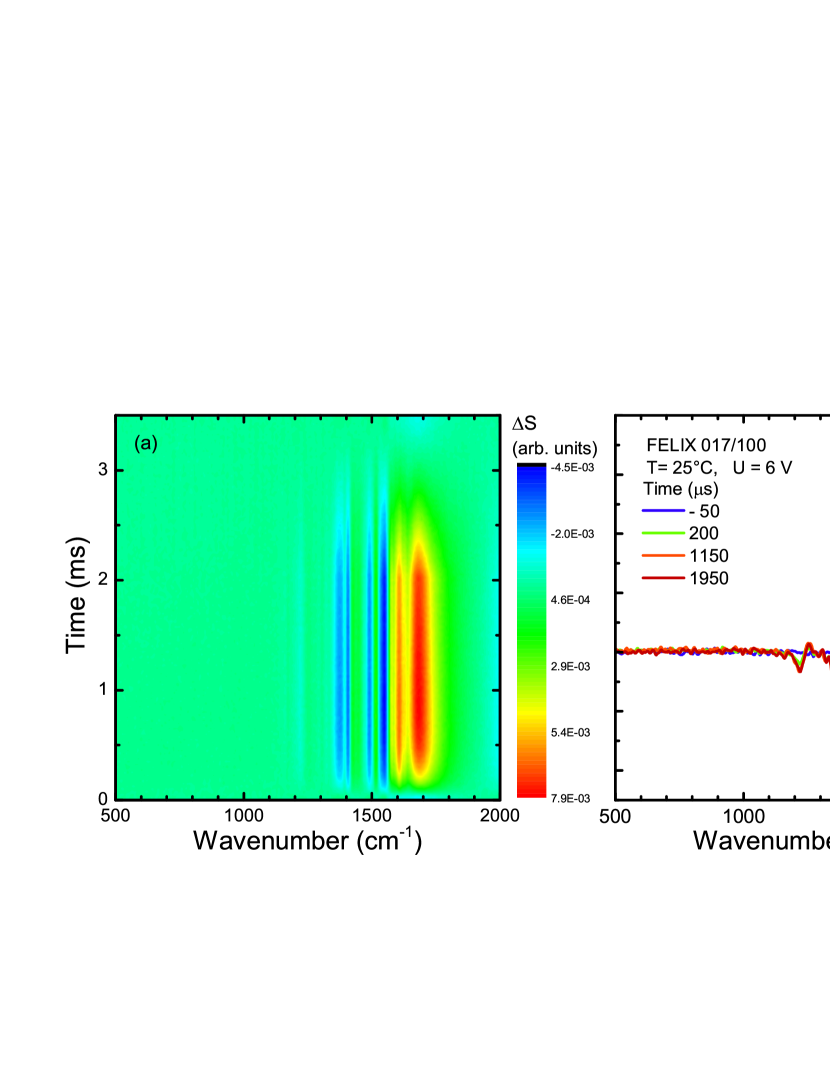
The extreme values of are displayed in blue or in red in the contour plot. The transition dipole moments are aligned parallel to lead to a reduced and, hence to a negative signal whereas in contrast for a positive is turned away from . This becomes more obvious in Fig. 5(b) where spectra at different times are plotted. As a check, data were taken s before the pulse; no variation of the vibrational modes and no shift is observed. After applying the voltage pulse, however, the spectrum dramatically alters and reveals the feature exactly as in Fig. 4(a) which marks the final state. Also the absolute values of the change are the same. In accord with Fig. 3(a) and 4(a) no variation can be identified below 1000 cm-1 because the ITO layer absorbs most of the incident light. The switching process is completed after about 1 ms and the signal stays constant over a period of 800 s.
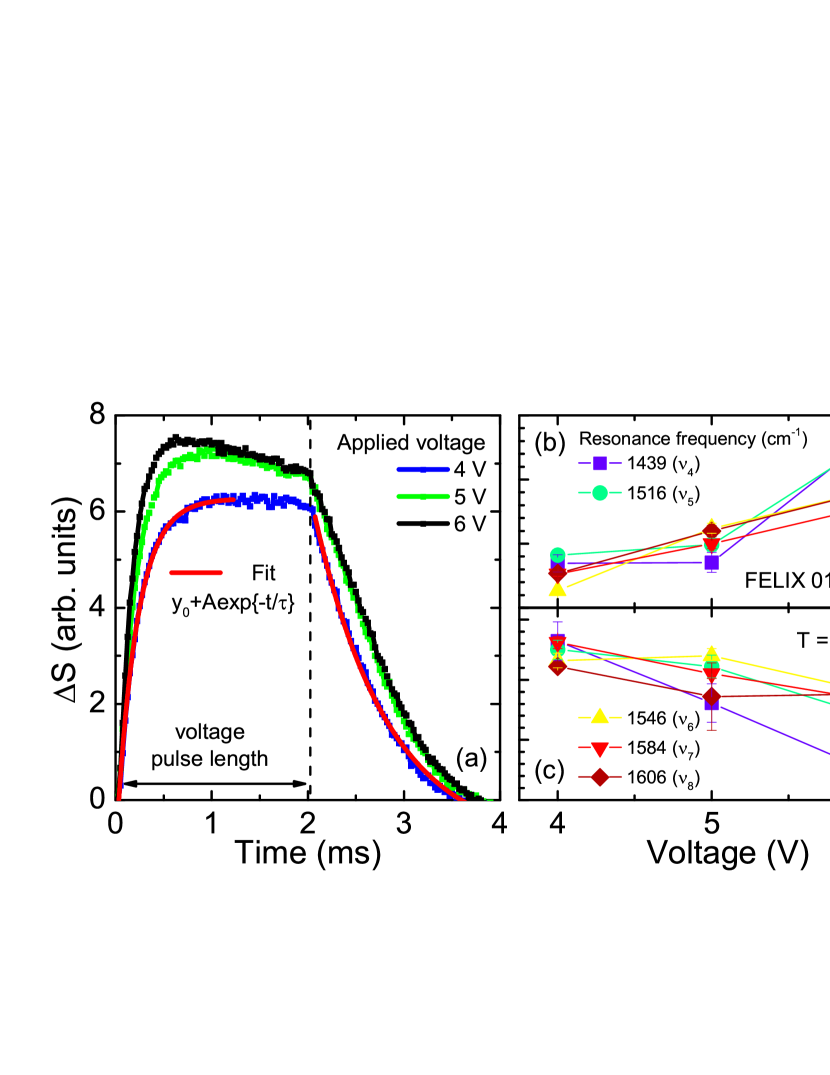
To determine the rise and fall time, the temporal evolution of of five vibrational modes were used. The change of the intensity of the mode is plotted as a function of time in Fig. 6(a) for three different voltages. With a rise time of less than 10 ns, the voltage pulse basically has a rectangular shape; however, the infrared signal reacts slowly and requires several hundreds of microsecond until it saturates. Due to the viscosity of the liquid crystals the molecules react with a certain delay to the electric field. The switching time diminishes with rising voltage whereas the amplitude increases slightly. However, the signal overshoots at the beginning for 6 V and relapses back to the value of the 5 V pulse. The rise time can be determined by fitting the experimental data with a single exponential function . The extracted values of are summarized in Fig. 6(b) and (c) as a function of the applied voltage. At the end of the pulse the signal relaxes slowly back to its initial values within 2 ms and is at least by a factor of four larger than the rise time . The time for reorientation can be determined from the temporal evolution of the recovery process by a single exponential function.
At a voltage of 4 V almost all vibrational modes reveal a switching time between 210 s and 230 s; with increasing voltage this range enlarges to maximum 70 s for 6 V whereas the values are between 190 s and 120 s. The various time constants imply that constituents of the molecules react differently on the electric field. The vibrational modes related to the molecule body (-mode) rotate slower than the ones (-mode) which are connected to the end groups. The theoretically calculated value for s (for 5 V) derived from Eq. (3) agrees very well with the experimentally determined which is of about 200 s. The reason for the small discrepancy may be due to uncertainties in the distance of the spacer plates or in the material specific parameters and ; they all depend strongly on temperature. From our limited data set, we cannot verify the predicted characteristic of the rise time; our data indicate a constant time. Probably, exhibits the expected field dependence and the divergent behavior for smaller voltages.
As it was expected from the theoretical calculations of the relaxation times in Fig. 6(c) are larger than the switching time. A time constant of 40 ms was predicted but not overserved. Furthermore, the relaxation rate is a function of the applied voltage but according to Eq. (3) it should be independent of any external parameter. One possible explanation therefor is the stronger tilting of the molecules with increasing voltage as well as the total amount of realigned molecules increases as well. Thereby, the layer of oriented molecules increases which leads to a kind of self-stabilization effect resulting in the extended decay. For this reason, the relaxation rate is not a function of the intrinsic elastic constant , but also of the external eclectic field.
4 Optical Switching
Over the last decades photo-induced phase transitions were investigated in several material classes, for instance, polymers Koshihara90a , organic charge-transfer salts Koshihara90b ; Okamoto04 ; Iwai06a ; Ikegami07 ; Okamoto06 ; Mitrano14 , transition-metal oxides like vanadium oxides Cavalleri04 , cuprates Demsar99 , and manganites Rini07 . In the following we study the one-dimensional organic mixed-stack crystals tetrathiavulvalene-chloranil (TTF-CA) that undergoes a ionic-neutral phase transition at K that can also be induced by light. Initiated by the groundbreaking experiments by Koshihara et al. Koshihara90a , ultrafast pump-probe experiments have been performed to examine the photo-induced phase transition PIPT in the femto- and picoseconds time range Koshihara90a ; Koshihara99 ; Suzuki99 ; Iwai06a . The understanding of these phenomena was boosted by theories of Nasu and Yonemitsu Nasu97 ; Nasu04 ; Yonemitsu06 ; Yonemitsu08 . In the case of TTF-CA open questions concern the relaxation of metastable domains, the related time scale, and the modification of the infrared spectrum due to photo-excitation; some of these have recently be addressed by time-resolved FTIR-spectroscopy Peterseim15 .
4.1 Neutral-Ionic Transition in TTF-CA
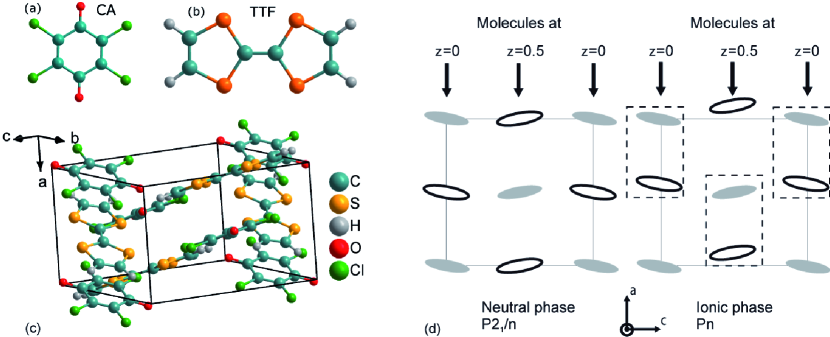
At ambient conditions the planar molecules of TTF and CA are equidistantly arranged in alternating stacks along the -direction (Fig. 7). Since the charge transfer as determined from optical experiments is rather small Girlando82 ; Girlando83 ; Jacobsen83 , this state is referred to as the neutral phase; upon cooling the charge transfer increases slightly. At K a phase transition occurs where the molecules dimerize along the stack with intermolecular distances 3.504 Å and 3.685 Å LeCointe95 , and the ionicity increases from 0.3 to about 0.6 ; Fig. 7(d) displays a sketch of the arrangement. Accordingly the dielectric constant diverges at the transition with a pronounced frequency dependent response Tomic15 . The application of 11 kbar pressure shifts the transition to room temperature Mitani87 ; Dengl14 .
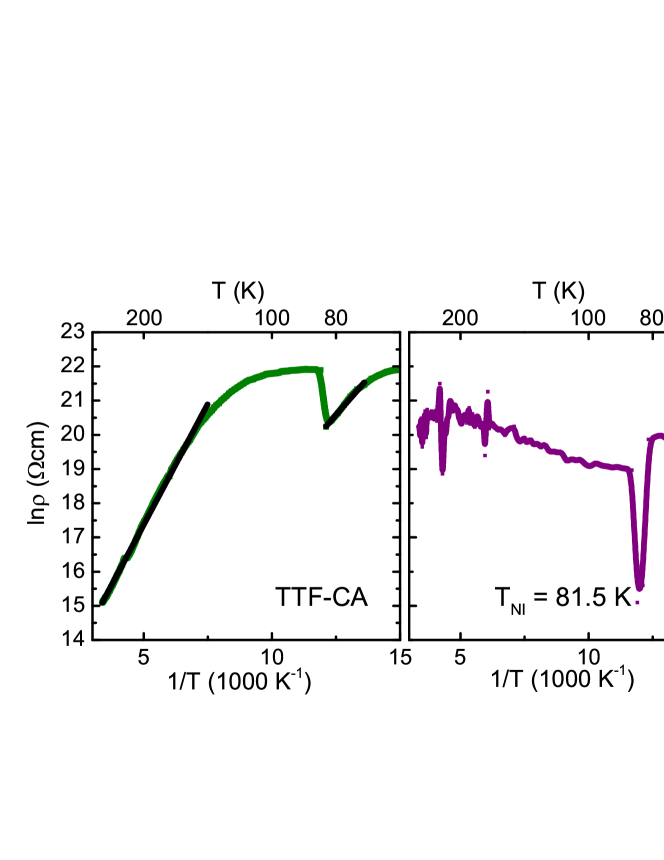
The resistivity of TTF-CA along the stacking direction increases upon cooling, following an activated behavior as displayed in the Arrhenius plot of Fig. 8. At , drops by one order of magnitude before it increase again at lower temperatures. The strong enhancement of the conductivity is attributed to the rising number of neutral-ionic domain walls in the neutral phase which also explains the dielectric behavior and non-linear transport Okamoto91 . Alternatively it was suggested, that the multiphonon Peierls coupling leads upon approaching the phase transition to a progressive shift of spectral weight and of the coupling strength toward the phonons at lower frequencies, ending in a soft-mode behavior only for the lowest-frequency phonon near the transition temperature Masino06 ; Girlando08 . In the proximity of the phase transition, the lowest-frequency phonon becomes overdamped due to anharmonicity induced by its coupling to electrons.
In Fig. 9 the mid-infrared reflectivity and the optical conductivity of TTF-CA are presented for temperatures above and below the neutral ionic transition. In this energy range the intramolecular modes of the TTF and CA molecules can be identified and assigned Girlando78 ; Girlando83 ; Bozio79 ; Peterseim15 ; some of them are sketched in panels (c) and (d). Along the -direction the symmetric ag as well as the infrared-active b3u modes of CA and TTF can be observed whereas the first one is only infrared active due to the emv-coupling. Above the phase transition in the neutral phase the TTF and CA molecules are not dimerized and thus the ag modes are only weakly infrared-active and the optical conductivity is low.
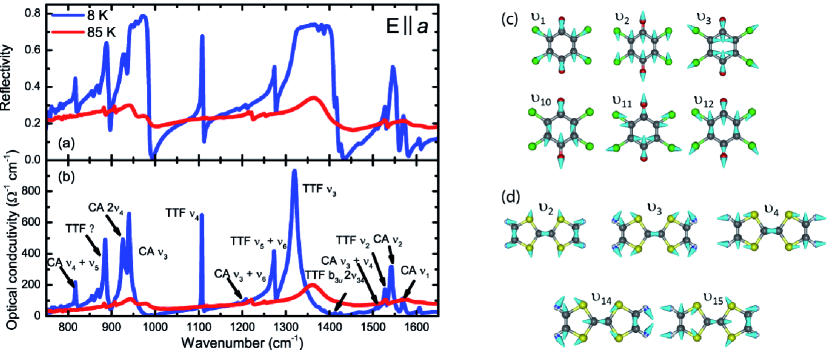
In the ionic phase the point inversion symmetry is lost and the molecules become dimerized: the intensity of ag modes is enhanced enormously. Time-resolved measurements thus allow us to explore the dynamics at the neutral-ionic phase transition by looking at the change in dimerization of the TTF and CA molecules, the increase of the ionicity. We can investigate the building of metastable domains until they eventually annihilate.
4.2 Experimental Details
For photo-induced experiments a Nd:YAG laser (B.M Industries/Thales, YAG-502DNS-DPS920) was operated in the second harmonics nm (2.35 eV) of the fundamental wavelength (1064 nm). The pulse length is 8 ns. The repetition rate can be selected internally and externally between 1 Hz and 20 Hz. The laser intensity is adjusted continuously by a Brewster plate in addition to neutral density filters between 0.1 and 0.5 optical density. The laser intensity was checked by a power and energy meter in front of the sample. The long term stability of the laser power is better than 5%.
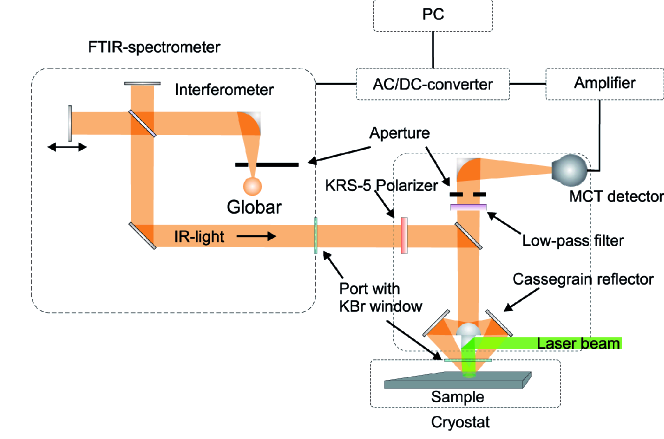
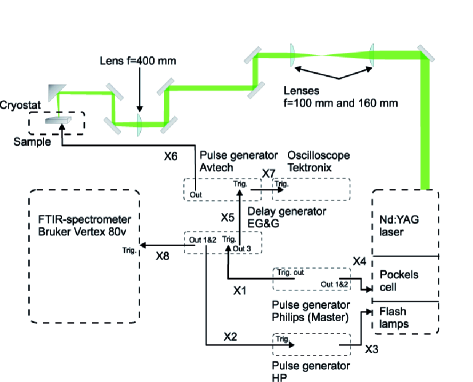
A telescope arrangement reduces the diameter of the laser beam from 1 cm by a factor of 2, illustrated in Fig. 11. The laser beam is directed from the optical bench to the infrared microscope via several mirrors (see Fig. 10). There, it is deflected on the sample by a aluminum coated mirror mounted below the Schmidt-Cassegrain objective of the Bruker HYPERION infrared microscope. A lens ( mm) focuses the beam on the sample, by varying the focal length. The light is circular polarized. The laser system and optical setup are spatially decoupled from the spectrometer and mounted on an optical table to suppress possible external vibrations.
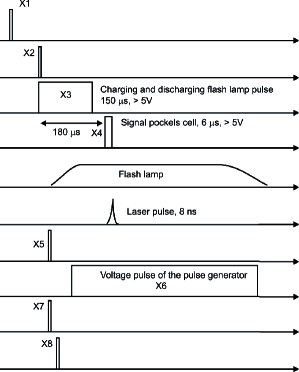
The laser pulse sequence is controlled externally to ensure the temporal synchronization between the laser, the pulse generators and the FTIR-spectrometer, as depicted in Fig. 11. The charging of the flash lamps is triggered by an external signal as well as the Pockels cell generating the laser pulse. Therefore, a HP pulse generator (PM 5786 B) sends the trigger signal X1 to the delay generator (EG&G Princeton Applied Research Model 4144). One of the delay generator output signals X2 is forwarded to a second pulse generator (HP 214B) which releases a further delayed pulse X3 with a minimum length of 150 s and minimum height of 5 V. It initializes the charging of the flash lamps of the laser system. After signal X3 drops to zero the lamps are charged with a delay of 1.5 ms. It also activates the discharge of the lamp with a delay of 15 s. About 30 s after the end of the charging and discharge pulse X3 a further voltage signal X4 from the first HP PM 5768 B pulse generator (length 6 s, 6 V) is sent to the Pockels cell generating the laser pulse. In the case of the photoconductivity measurements the delayed trigger signal X5 from the delay generator activates the pulse generator (Avtech Electrosystems Ltd., Ottawa) to apply a voltage pulse X6 to the sample. The synchronizing pulse X7 of the Avtech device goes to the Tektronix oscilloscope to start the acquisition of the photocurrent. The third signal X8 from the delay generator is used to initialize the time-resolved infrared measurement of the FTIR-spectrometer.
4.3 Time-Resolved Infrared Studies
For the PIPT measurements we excite only one of the first transitions of TTF+ by the second harmonic of the Nd:YAG laser; all intermolecular transitions of CA- lie above present photon energy. Also excitations from lower lying bands into the valence band are possible. Suzuki et al. compared the dependence of the conversion efficiency on the photon energy; by excitation of intramolecular transitions no threshold intensity occurs to create neutral domains Suzuki99 .
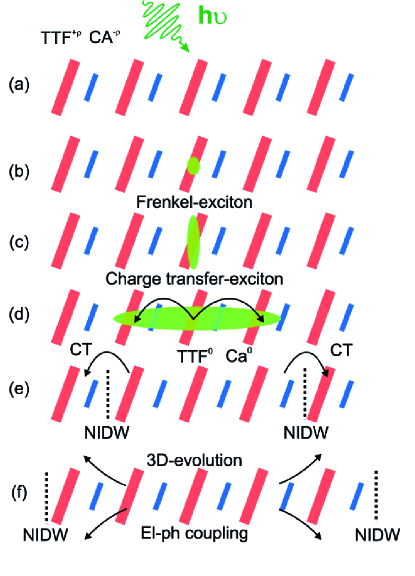
In Fig. 12 the optical generation of neutral domains is schematically illustrated. The light pulse will create intramolecular Frenckel-excitons, which are electron-hole pairs strongly localized on the excited molecules. They decay via various channels into several charge-transfer excitons Nasu04 and by that lead to a phase transition. In the case of direct excitation only one exciton is created, which is not enough to establish a macroscopic, metastable domain extended over several D0A0 pairs. With a sufficient number of photons a multiplicative, non-linear effect can be established, formating metastable domains. By the creation of the one-dimensional, neutral, non-dimerized region, neutral-ionic domain walls are formed between the neutral and ionic parts. The excitation energy of these domain walls is about 0.1 eV Mitani87 ; Okamoto91 and corresponds to the activation energy of 120 meV and 65 meV in the ionic phase Peterseim15 . This is in good agreement with predictions of an activation energy between 25 and 56 meV Nagaosa86a ; Nagaosa86b ; Soos07 . Afterwards, the electronic system couples to the crystal lattice and exciting phonons Iwai06a via electron-phonon coupling and hence, creates shock-waves. They can convert neighboring chains into neutral domains.
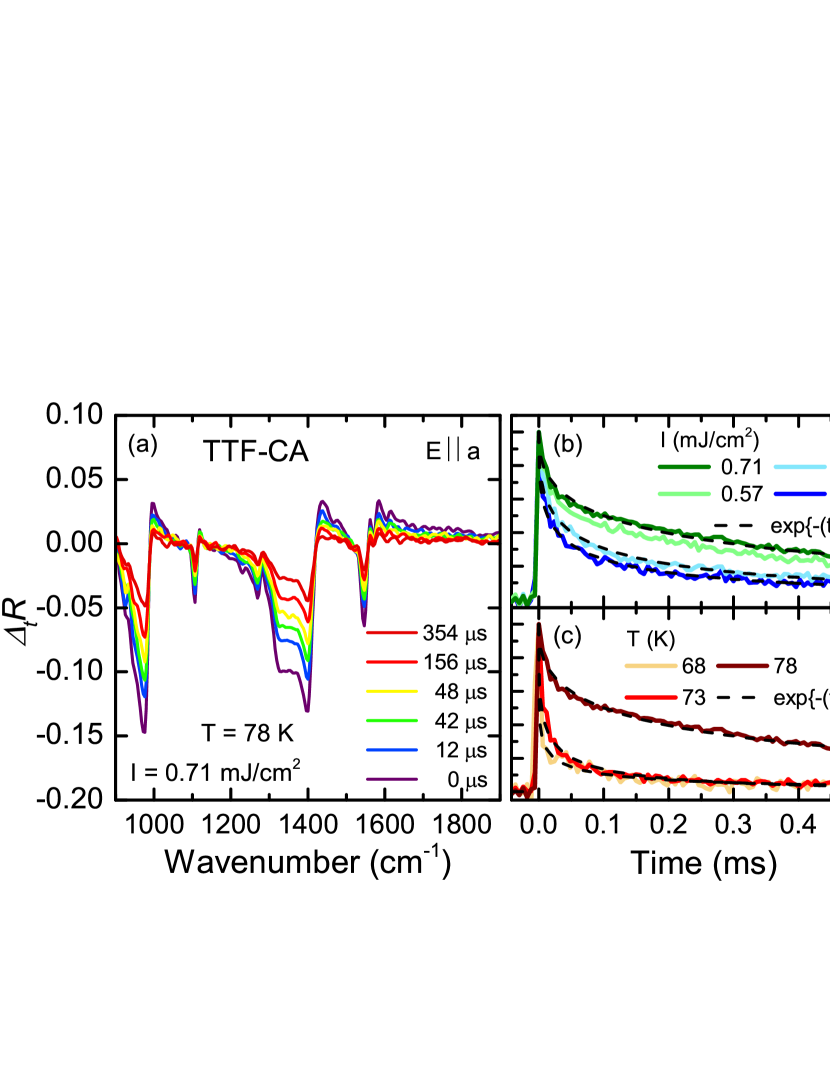
In Fig. 13(a) the time-dependent behavior of the reflectivity change at K is plotted for a laser pulse intensity of 0.71 mJ/cm2. It directly compares to the static reflectivity change plotted in Fig. 9(a). By photo excitation becomes negative within a short time which is below the experimental time resolution of 6 s. The direct comparison of the shape and the static reflectivity change reveal that the ionic phase was not only dissolved, but also a transition into a neutral state was induced. Within several hundreds of microseconds the signal relaxes back to zero which means that the ionic phase is reestablished. Moreover, no change of the spectral shape with the elapsed time and laser pulse intensity could be detected. By comparing the shape of with the corresponding difference of the reflectivity between 78 K and 85 K, we conclude that the vanishing of this features indicates the dissolving of the dimerization state between the TTF and CA molecules. Moreover, we suggest that metastable, non-dimerized neutral domains in the ionic matrix are created.
To trace the temporal evolution of the PIPT in dependence of the pump intensity and the sample temperature, we have chosen the very intense (ag) mode of TTF residing at 1390 cm-1 since we have asserted that the temporal evolution is the same for the whole spectra. The normalized is represented in Fig. 12(b) for different pulse intensities. At the beginning the signal decays very fast and at the end it flattens out. At the vicinity of the first component decays faster with decreasing laser intensity. A fit by a simple single or double exponential function Nasu04 does not yield satisfactory results. However, we obtain an excellet agreement when using a stretched-exponential function, which is also called Kohlrausch-William-Watt function
| (4) |
as depicted in Fig. 13(b) and (c). The fitting parameters and are a function of the laser intensity and decreases from 0.35 to 0.42 and from to s with decreasing laser intensities.
In Fig. 13(c) is displayed for various temperatures , 73, and 78 K. Far below , the temporal dynamics of the reflectivity drops very fast within the first 20 s and approaches asymptotically a constant value which is in contrast to the temporal profile at the vicinity (=78 K) of which constantly diminishes. Similar to the dependence of the fitting parameters on the laser intensity the effective recombination time as well as the stretching exponent decrease from s to s and from 0.42 to 0.23, respectively, with decreasing sample temperature.
The observed time profile can be explained by a random-walk annihilation process of the generated neutral-ionic domain walls. Our comprehensive time-resolved infrared study and the random-walk model Peterseim15 allow us to conclude that close to the phase transition, large domains are formed due to the valence instability. We find that the merger and interaction of the induced domains play an important role for the formation of the macroscopic domains and deduce from the model with decreasing laser intensity, the average domain size decreases. At lower temperatures the ionic phase is more robust; the average domain size is much smaller and changes less with laser intensity. The random walk of the neutral-ionic domain walls is the dominant factor for the relaxation of the metastable domains in the temperature range considered.
5 Summary
We have presented two examples where time-resolved infrared investigations using step-scan Fourier-transform spectroscopy provide insight in the molecular dynamics at the phase transition and molecular orientation. In the case of liquid crystals, the application of an electric field switches the orientation of the molecular dipoles changing the transmission of the cell for polarized infrared light. Watching the time evolution of the pronounced molecular vibrational modes allows us to extract the time constant of approximately 2 ms and its dependence on the applied voltage. The neutral-ionic phase transition of TTF-CA can be photo-excited with a short laser pulse, creating domain walls that are mobile and eventually annihilate. We follow the time-dependence of the vibrational modes activated by the changed dimerization and ionicity. The relaxation back to the initial state strongly depends on the temperature and laser intensity, it extends from a 3 s to almost 1 ms. For both examples we give details of the experimental setups and limitations. We demonstrate the applicability of step-scan Fourier-transform spectroscopy in a large dynamical range.
Acknowledgements.
We thank F. Schörg and F. Giesselmann for providing the liquid crystals and G. Untereiner for continuous help; E. Kurz and N. Frühauf supported us when building the cell and use of their clean room. Funding by the Deutsche Forschungsgemeinschaft (DFG) is acknowledged. T.P. thanks the Carl-Zeiss-Stiftung for financial support.References
- (1) R.J. Bell, Introduction to Fourier Transform Spectroscopy (Academic Press, New York, 1972)
- (2) H.U. Gremlich, H. Günzler, IR-Spektroskopie: Eine Einführung, 4th edn. (Wiley-VCH, Weinheim, 2003)
- (3) P.R. Griffiths, J.A. De Haseth, Fourier transform infrared spectrometry, 2nd edn. (Wiley-Interscience, Hoboken, N.J, 2007)
- (4) B. Smith, Fundamentals of Fourier Transform Infrared Spectroscopy, 2nd edn. (CRC Press, Taylor & Francis, Boca Raton, FL, 2011)
- (5) J. Sloan, E. Kruus, in Time Resolved Spectroscopy, vol. 18, ed. by R. Clark, R. Hester (John Wiley & Sons., Chichester, 1989)
- (6) G.D. Smith, R.A. Palmer, in Handbook of Vibrational Spectroscopy, vol. 1, ed. by J.M. Chalmers, P.R. Griffiths (John Wiley & Sons., Chichester, 2001), pp. 625–640
- (7) A. Laubereau, M. Stockburger (eds.), Time-resolved Vibrational Spectroscopy, vol. 4 (Springer, Berlin, 1985)
- (8) P.R. Griffiths, B.L. Hirsche, C.J. Manning, Vib. Spectrosc. 19, 165 (1999)
- (9) T.J. Johnson, A. Simon, J.M. Weil, G.W. Harris, Appl. Spectrosc. 47, 1376 (1993)
- (10) W. Uhmann, A. Becker, C. Taran, F. Siebert, Appl. Spectroscopy 45, 390 (1991)
- (11) B. Hessling, J. Herbst, R. Rammelsberg, K. Gerwert, Biophys. J. 73, 2071 (1997)
- (12) R. Rammelsberg, B. Hessling, H. Chorongiewski, K. Gerwert, Appl. Spectroscopy 51, 558 (1997)
- (13) R. Rammelsberg, S. Boulas, H. Chorongiewski, K. Gerwert, Vib. Spectrosc. 19, 143 (1999)
- (14) M. Schleeger, C. Wagner, M.J. Vellekoop, B. Lendl, J. Heberle, Analytical and Bioanalytical Chem. 394, 1869 (2009)
- (15) V.G. Gregoriou, J.L. Chao, H. Toriumi, R.A. Palmer, Chem. Phys. Lett. 179, 491 (1991)
- (16) N. Katayama, T. Sato, Y. Ozaki, K. Murashiro, M. Kikuchi, S. Saito, D. Demus, T. Yuzawa, H. Hamaguchi, Appl. Spectroscopy 49, 977 (1995)
- (17) N. Katayama, M.A. Czarnecki, M. Satoh, T. Watanabe, Y. Ozaki, Appl. Spectroscopy 51, 487 (1997)
- (18) A.L. Verma, B. Zhao, A. Bhattacharjee, Y. Ozaki, Phys. Rev. E 63, 051704 (2001)
- (19) J.Y. Huang, W.T. Shih, J. Phys.: Condens. Matter 18, 7593 (2006)
- (20) T. Peterseim, P. Haremski, M. Dressel, EPL (Europhysics Letters) 109, 67003 (2015)
- (21) T. Peterseim, T. Ivek, D. Schweitzer, M. Dressel, Phys. Rev. B 000, 12345 (2016)
- (22) J. Shao, F. Yue, X. Lu, W. Lu, W. Huang, Z. Li, S. Guo, J. Chu, Appl. Phys. Lett. 89, 182121 (2006)
- (23) J. Shao, W. Lu, F. Yue, X. Lu, W. Huang, Z. Li, S. Guo, J. Chu, Rev. Sci. Instrum. 78, 013111 (2007)
- (24) C. Rodig, F. Siebert, Appl. Spectroscopy 53, 893 (1999)
- (25) W. Herres, J. Gronholz, Understanding FT-IR data processing (1984). Bruker Analytlsche Messtechnlk GmbH, Karlsruhe, Germany
- (26) T. Peterseim, Organic conductors in equilibrium and nonequilibrium states: The interaction with electric and light pulses. Ph.D. thesis, Universität Stuttgart (2015)
- (27) S.M. Sze, K.K. Ng, Physics of semiconductor devices, 3rd edn. (Wiley-Interscience, Hoboken, N.J, 2007)
- (28) P.Y. Yu, M. Cardona, Fundamentals of semiconductors: Physics and materials properties, 4th edn. (Springer, Berlin, 2010)
- (29) G. Grüner, Density waves in solids (Addison-Wesley Pub. Co., Advanced Book Program, Reading, Mass., 1994)
- (30) A. Asamitsu, Y. Tomioka, H. Kuwahara, Y. Tokura, Nature 388, 50 (1997)
- (31) A. Sawa, Materials Today 11, 28 (2008)
- (32) R.S. Potember, T.O. Poehler, D.O. Cowan, Appl. Phys. Lett. 34, 405 (1979)
- (33) Y. Tokura, H. Okamoto, T. Koda, T. Mitani, G. Saito, Phys. Rev. B 38, 2215 (1988)
- (34) R. Kumai, Y. Okimoto, Y. Tokura, Science 284, 1645 (1999)
- (35) K. Inagaki, I. Terasaki, H. Mori, T. Mori, J. Phys. Soc. Jpn. 73, 3364 (2004)
- (36) T. Mori, T. Kawamoto, I. Terasaki, T. Kakiuchi, H. Sawa, Phys. Rev. B 75, 235103 (2007)
- (37) T. Ivek, I. Kovačević, M. Pinterić, B. Korin-Hamzić, S. Tomić, T. Knoblauch, D. Schweitzer, M. Dressel, Phys. Rev. B 86, 245125 (2012)
- (38) N.A. Clark, S.T. Lagerwall, Appl. Phys. Lett. 36, 899 (1980)
- (39) E.D. Palik (ed.), Handbook of Optical Constants of Solids, Author and Subject Indices for Volumes I, II, and III (Academic Press, San Diego, CA, 2009)
- (40) P.K. Biswas, A. De, N.C. Pramanik, P.K. Chakraborty, K. Ortner, V. Hock, S. Korder, Mat. Lett. 57, 2326 (2003)
- (41) K. Sakamoto, R. Arafune, N. Ito, S. Ushioda, Y. Suzuki, S. Morokawa, Jpn. J. Appl. Phys. 33, L1323 (1994)
- (42) A. Verma, B. Zhao, S. Jiang, J. Sheng, Y. Ozaki, Phys. Rev. E 56, 3053 (1997)
- (43) N.A. Clark, M.A. Handschy, S.T. Lagerwall, Mol. Cryst. Liq. Cryst. 94, 213 (1983)
- (44) M.A. Handschy, K.M. Johnson, G. Moddel, L.A. Pagano-Stauffer, Ferroelectrics 85, 279 (1988)
- (45) J.W. Goodby (ed.), Handbook of liquid crystals, 2nd edn. (Wiley-VCH, Weinheim, 2014)
- (46) S.Y. Koshihara, Y. Tokura, T. Mitani, G. Saito, T. Koda, Phys. Rev. B 42, 6853 (1990)
- (47) S.y. Koshihara, Y. Tokura, K. Takeda, T. Koda, A. Kobayashi, J. Chem. Phys. 92, 7581 (1990)
- (48) H. Okamoto, Y. Ishige, S. Tanaka, H. Kishida, S. Iwai, Y. Tokura, Phys. Rev. B 70, 165202 (2004)
- (49) S. Iwai, Y. Ishige, S. Tanaka, Y. Okimoto, Y. Tokura, H. Okamoto, Phys. Rev. Lett. 96, 057403 (2006)
- (50) K. Ikegami, K. Ono, J. Togo, T. Wakabayashi, Y. Ishige, H. Matsuzaki, H. Kishida, H. Okamoto, Phys. Rev. B 76, 085106 (2007)
- (51) H. Okamoto, K. Ikegami, T. Wakabayashi, Y. Ishige, J. Togo, H. Kishida, H. Matsuzaki, Phys. Rev. Lett. 96, 037405 (2006)
- (52) M. Mitrano, G. Cotugno, Clark, S. R., R. Singla, S. Kaiser, J. Stähler, R. Beyer, M. Dressel, L. Baldassarre, D. Nicoletti, A. Perucchi, T. Hasegawa, H. Okamoto, D. Jaksch, A. Cavalleri, Phys. Rev. Lett. 112, 117801 (2014)
- (53) A. Cavalleri, T. Dekorsy, H. Chong, J.C. Kieffer, R.W. Schoenlein, Phys. Rev. B 70, 161102 (2004)
- (54) J. Demsar, K. Biljaković, D. Mihailovic, Phys. Rev. Lett. 83, 800 (1999)
- (55) M. Rini, R. Tobey, N. Dean, J. Itatani, Y. Tomioka, Y. Tokura, R.W. Schoenlein, A. Cavalleri, Nature 449, 72 (2007)
- (56) S.y. Koshihara, Y. Takahashi, H. Sakai, Y. Tokura, T. Luty, J. Phys. Chem. B 103, 2592 (1999)
- (57) T. Suzuki, T. Sakamaki, K. Tanimura, S.y. Koshihara, Y. Tokura, Phys. Rev. B 60, 6191 (1999)
- (58) K. Nasu, Relaxations of Excited States and Photo-Induced Structural Phase Transitions (Springer, Berlin, 1997)
- (59) K. Nasu, Photoinduced phase transitions (World Scientific, Singapore, 2004)
- (60) K. Yonemitsu, K. Nasu, J. Phys. Soc. Jpn. 75, 011008 (2006)
- (61) K. Yonemitsu, K. Nasu, Phys. Rep. 465, 1 (2008)
- (62) A. Girlando, R. Bozio, C. Pecile, J.B. Torrance, Phys. Rev. B 26, 2306 (1982)
- (63) A. Girlando, F. Marzola, C. Pecile, J.B. Torrance, J. Chem. Phys. 79, 1075 (1983)
- (64) C.S. Jacobsen, J.B. Torrance, J. Chem. Phys. 78, 112 (1983)
- (65) M. Le Cointe, M.H. Lemée-Cailleau, H. Cailleau, B. Toudic, L. Toupet, G. Heger, F. Moussa, P. Schweiss, K.H. Kraft, N. Karl, Phys. Rev. B 51, 3374 (1995)
- (66) S. Tomic, M. Dressel, Rep. Prog. Phys. 78, 096501 (2015)
- (67) T. Mitani, Y. Tokura, Y. Kaneko, K. Takaoka, T. Koda, G. Saito, Synthetic Met. 19, 515 (1987)
- (68) A. Dengl, R. Beyer, T. Peterseim, T. Ivek, G. Untereiner, M. Dressel, J. Chem. Phys. 140, 244511 (2014)
- (69) H. Okamoto, T. Mitani, T. Komatsu, Y. Iwasa, T. Koda, G. Saito, Phys. Rev. B 43, 8224 (1991)
- (70) M. Masino, A. Girlando, A. Brillante, R.G. Della Valle, E. Venuti, N. Drichko, M. Dressel, Chem. Phys. 325, 71 (2006)
- (71) A. Girlando, M. Masino, A. Painelli, N. Drichko, M. Dressel, A. Brillante, R.G. Della Valle, E. Venuti, Phys. Rev. B 78, 045103 (2008)
- (72) A. Girlando, I. Zanon, R. Bozio, C. Pecile, J. Chem. Phys. 68, 22 (1978)
- (73) R. Bozio, I. Zanon, A. Girlando, C. Pecile, J. Chem. Phys. 71, 2282 (1979)
- (74) N. Nagaosa, J. Phys. Soc. Jpn. 55, 3488 (1986)
- (75) N. Nagaosa, J. Takimoto, J. Phys. Soc. Jpn. 55, 2745 (1986)
- (76) Z.G. Soos, A. Painelli, Phys. Rev. B 75, 155119 (2007)