Nikolaus Hansen
Inria
Research centre Saclay–Île-de-France
Compiled
Nomenclature
We adopt the usual vector notation, where bold letters, , are
column vectors, capital bold letters, , are matrices, and a
transpose is denoted by . A list of used abbreviations and
symbols is given in alphabetical order.
Abbreviations
CMA Covariance Matrix Adaptation
EMNA Estimation of Multivariate Normal Algorithm
ES Evolution Strategy
-ES, Evolution Strategy with
parents, with recombination of all parents, either
Intermediate or Weighted, and offspring.
RHS Right Hand Side.
Greek symbols
, population size, sample size, number of offspring,
see (5).
parent number, number of (positively) selected search points
in the population, number of strictly positive recombination weights, see (6).
, the variance
effective selection mass for the mean, see (8).
, sum of all weights, note that for , see also (30) and (55).
, sum of all positive weights.
, minus the sum of all
negative weights.
, step-size.
Latin symbols
, an orthogonal matrix. Columns of are
eigenvectors of with unit length and correspond to the
diagonal elements of .
, covariance matrix at generation .
, diagonal elements of .
, learning rate for the rank-one update of
the covariance matrix update, see
(28), (30), and
(47), and Table 1.
, learning rate for the rank- update of
the covariance matrix update, see
(3.2), (30), and
(47), and Table 1.
, decay rate for the cumulation path for the step-size
control, see (31) and (43), and
Table 1.
, decay rate for cumulation path for the rank-one update
of the covariance matrix, see (24) and (45),
and Table 1.
, learning rate for the mean.
, a diagonal matrix. The diagonal elements of
are square roots of eigenvalues of and
correspond to the respective columns of .
, diagonal elements of diagonal matrix ,
are eigenvalues of .
, damping parameter for step-size update, see
(32), (37), and (44).
Expectation value
, objective function
(fitness function) to be minimized.
.
, generation counter, iteration number.
, Identity matrix, unity matrix.
, mean value of the search
distribution at generation .
, search space dimension, see .
, multivariate normal distribution with zero mean
and unity covariance matrix. A vector distributed according to
has independent, -normally distributed
components.
,
multivariate normal distribution with mean and
covariance matrix . The matrix is
symmetric and positive definite.
, strictly positive real numbers.
, evolution path, a sequence of successive
(normalized) steps, the strategy takes over a number of
generations.
, where , recombination weights, see (6) and (3.2) and (49)–(55).
, -th offspring/individual from generation
. We also refer to , as search point, or object
parameters/variables, commonly used synonyms are candidate
solution, or design variables.
, -th best individual out of
, see (5). The index
denotes the index of the -th ranked individual
and , where is the objective function to be
minimized.
corresponding to .
0 Preliminaries
This tutorial introduces the CMA Evolution Strategy (ES), where CMA
stands for Covariance Matrix Adaptation.111Parts of this material have also been presented in [15]
and [17], in the context of
Estimation of Distribution Algorithms and Adaptive Encoding,
respectively. An introduction deriving CMA-ES from the
information-geometric concept of a natural
gradient can be found in [19].
The CMA-ES is a stochastic,
or randomized,
method for real-parameter (continuous domain) optimization of
non-linear, non-convex functions (see also Section 0.3
below).222While CMA variants for multi-objective
optimization and elitistic variants have been proposed, this
tutorial is solely dedicated to single objective optimization and
non-elitistic truncation selection, also referred to as
comma-selection. We try to motivate and derive the algorithm from
intuitive concepts and from requirements of non-linear, non-convex
search in continuous domain.
For a concise
algorithm description see
Appendix A. A respective Matlab source code is
given in Appendix C.
Before we start to introduce the algorithm in
Sect. 1, a few required fundamentals are summed up.
0.1 Eigendecomposition of a Positive Definite Matrix
A symmetric, positive definite matrix, , is
characterized in that for all holds
. The matrix has an orthonormal
basis of eigenvectors, , with
corresponding eigenvalues, .
That means for each holds
(1)
The important message from (1) is that
eigenvectors are not rotated by . This feature uniquely
distinguishes eigenvectors. Because we assume the orthogonal eigenvectors to be
of unit length, , and
(obviously this means , and it follows
). An basis of eigenvectors is practical,
because for any we can find coefficients ,
such that , and then we have
.
The eigendecomposition of obeys
(2)
where
is an orthogonal matrix, .
Columns of form an orthonormal basis of eigenvectors.
is a diagonal matrix with
eigenvalues of as diagonal elements.
is a diagonal matrix
with square roots of eigenvalues of as diagonal elements.
The matrix decomposition (2) is unique, apart from signs
of columns of and permutations of columns in and
respectively, given all eigenvalues are different.333Given eigenvalues are equal, any orthonormal basis of their
-dimensional subspace can be used as column vectors. For
there are infinitely many such bases.
Given the eigendecomposition (2), the inverse
can be computed via
From (2) we naturally define the square root of
as
(3)
and therefore
0.2 The Multivariate Normal Distribution
A multivariate normal distribution, , has a
unimodal, “bell-shaped” density, where the top of the bell (the
modal value) corresponds to the distribution mean, . The
distribution is uniquely determined by its
mean and its symmetric and positive definite covariance
matrix . Covariance (positive definite)
matrices have an appealing geometrical interpretation: they can be
uniquely identified with the (hyper-)ellipsoid
, as
shown in Fig. 1.
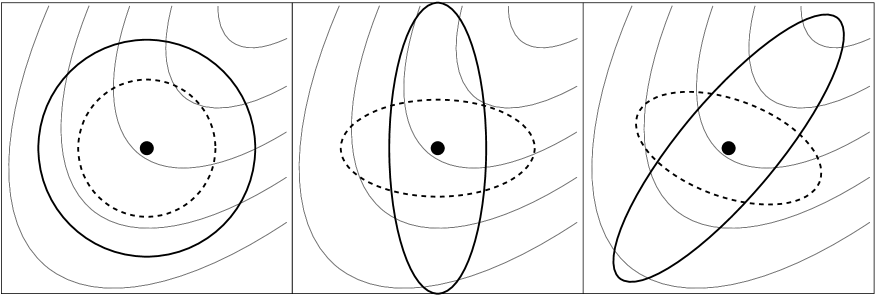
Figure 1: Ellipsoids depicting
one- lines of equal density of six different normal
distributions, where , is a diagonal
matrix, and is a positive definite full covariance
matrix. Thin lines depict possible objective function contour
lines
The ellipsoid is a surface of equal density of the distribution. The
principal axes of the ellipsoid correspond to the eigenvectors of
, the squared axes lengths correspond to the eigenvalues. The
eigendecomposition is denoted by
(see Sect. 0.1). If
, where and denotes the
identity matrix, and the ellipsoid is isotropic
(Fig. 1, left). If , then
is a diagonal matrix and the ellipsoid is axis parallel oriented
(middle). In the coordinate system given by the columns of , the
distribution is always uncorrelated.
The normal distribution can be written in
different ways.
(4)
where “” denotes equality in distribution, and
. The last row can be well
interpreted, from right to left
produces an spherical (isotropic) distribution
as in Fig. 1, left.
scales the spherical distribution within the coordinate
axes as in Fig. 1,
middle. has
independent components. The matrix can be interpreted as
(individual) step-size matrix and its diagonal entries are the standard
deviations of the components.
defines a new orientation for the ellipsoid, where the
new principal axes of the ellipsoid correspond to the columns of
. Note that has degrees of freedom.
Equation (4) is useful to compute
distributed vectors, because is a vector of
independent -normally distributed numbers that can easily be
realized on a computer.
0.3 Randomized Black Box Optimization
We consider the black box search scenario, where we want to
minimize an objective function (or cost function or
fitness function)
The objective is to find one or more search points (candidate
solutions), , with a function value, , as
small as possible. We do not state the objective of searching for a
global optimum, as this is often neither feasible nor relevant in
practice. Black box optimization refers to the situation,
where function values of evaluated search points are the only
accessible information on .444Knowledge about the underlying optimization problem might well enter the
composition of and the chosen problem encoding.
The search points to be evaluated can be freely chosen. We define the
search costs as the number of executed function evaluations,
in other words the amount of information we needed to acquire from
555Also is sometimes denoted as cost function, but it should
not to be confused with the search costs.. Any performance measure must consider the search costs together with
the achieved objective function value.666A performance measure can be obtained from a number of trials as,
for example, the mean number of function evaluations to reach a
given function value, or the median best function value obtained
after a given number of function evaluations.
A randomized black box search algorithm is outlined in
Fig. 2.
Figure 2: Randomized black box
search. is the objective function
In the CMA Evolution Strategy the search distribution, , is a
multivariate normal distribution. Given all variances and covariances, the
normal distribution has the largest entropy of all distributions in
.
Furthermore, coordinate directions are not distinguished in any way.
Both makes the normal distribution a particularly attractive candidate
for randomized search.
Randomized search algorithms are regarded to be robust in a rugged
search landscape, which can comprise discontinuities, (sharp) ridges,
or local optima. The covariance matrix adaptation (CMA) in particular
is designed to tackle, additionally, ill-conditioned and
non-separable777An -dimensional separable problem can be solved by
solving -dimensional problems separately, which is a
far easier task.
problems.
0.4 Hessian and Covariance Matrices
We consider the convex-quadratic objective function
, where the
Hessian matrix is a positive definite
matrix. Given a search distribution , there is
a close relation between and : Setting
on is equivalent to optimizing the
isotropic function
(where ) with
.888Also the initial mean value has to be transformed
accordingly.
That is, on convex-quadratic objective functions, setting the
covariance matrix of the search distribution to the inverse Hessian
matrix is equivalent to rescaling the ellipsoid function into a
spherical one. Consequently, we assume that the optimal covariance
matrix equals to the inverse Hessian matrix, up to a constant
factor.999Even though there is good intuition and strong empirical evidence
for this statement, a rigorous proof is missing.
Furthermore, choosing a covariance matrix or choosing a respective
affine linear transformation of the search space (i.e. of )
is equivalent [14], because for any full rank
-matrix we find a positive definite Hessian such
that .
The final objective of covariance matrix adaptation is
to closely approximate the contour lines of the objective function . On convex-quadratic functions this amounts to approximating the inverse Hessian matrix, similar to a quasi-Newton method.
In
Fig. 1 the solid-line distribution in the right figure
follows the objective function contours most suitably, and it is easy
to foresee that it will aid to approach the optimum the most.
The condition number of a positive
definite matrix is defined via the Euclidean norm:
,
where . For a
positive definite (Hessian or covariance) matrix holds
and , where
and are the largest and
smallest eigenvalue of .
1 Basic Equation: Sampling
In the CMA Evolution Strategy, a population of new search points
(individuals, offspring) is generated by sampling a multivariate normal
distribution.101010Recall that, given all (co-)variances, the normal distribution has
the largest entropy of all distributions in .
The basic equation for sampling the search points,
for generation number , reads111111Framed equations belong to the final algorithm of a CMA Evolution
Strategy.
denotes the same distribution on the left and right side.
is a multivariate
normal distribution with zero mean and covariance matrix , see
Sect. 0.2. It holds .
, -th offspring (individual, search point) from
generation .
, mean value of the search
distribution at generation .
, “overall” standard deviation, step-size, at
generation .
, covariance matrix at generation
. Up to the scalar factor , is the covariance
matrix of the search distribution.
, population size, sample size, number
of offspring.
To define the complete iteration step, the remaining question is, how
to calculate , , and for the next generation
. The next three sections will answer these questions,
respectively. An algorithm summary with all parameter settings and
matlab source code are given in Appendix A
and C, respectively.
2 Selection and Recombination: Moving the Mean
The new mean of the search distribution is a weighted
average of selected points from the sample
:
(6)
(7)
where
is the parent population size, i.e. the number of
selected points.
, positive weight coefficients for
recombination. For , Equation (6)
calculates the mean value of selected points.
, -th best individual out of
from (5). The index
denotes the index of the -th ranked individual
and , where is the objective function to be
minimized.
Equation (6) implements truncation selection by choosing
out of offspring points. Assigning
different weights should also be interpreted as a
selection mechanism. Equation (6) implements weighted intermediate
recombination by taking individuals into account for a
weighted average.
The measure121212Later, the vector will have elements. Here, for computing the norm,
we assume that any additional elements are zero.
(8)
will be repeatedly used in the following and can be paraphrased as effective sample size of the selected samples or variance effective selection mass. From the definition of
in (7) we derive , and
for equal recombination weights, i.e.
for all .
The notion of with different recombination weights generalizes the notion of with equal recombination weights in several aspects. The number (with equal recombination weights) is the amount of information used, expressed as number of independent sources.
Taking the weighted average of independent samples reduces the original variance by a factor of for equal weights and by a factor of for any weights, hence can be considered as the amount of used information.
To keep the variance unchanged, the average must be multiplied by .
However, the optimal step-size (given ) is proportional to [6, 33] for equal weights and proportional to for optimal recombination weights [4], respectively, see also Section 4.
Usually, indicates a
reasonable setting of . A simple and reasonable setting is
, and , where .
is a learning rate, usually set to .131313In the literature the notation is also common and is used as multiplier in (5) instead of in (9).
Equation (9) generalizes (6). If , as
it is the case with the default parameter setting (compare Table 1 in Appendix A), cancels out , and Equations (9) and (6) are identical.
Choosing can be advantageous on noisy functions.
With optimal step-size we have roughly , hence the “test steps” in (5) are in effect increased whereas the update step in (9) remains unchanged.
However, too large test steps negatively impact the performance because the ranking indices are determined too far away from the (current) region of relevance.
Arbitrary small test steps (when ) work generally well, within the limits of numerical precision, on unimodal and noisefree functions [1, 11].
3 Adapting the Covariance Matrix
In this section, the update of the covariance matrix, , is
derived. We will start out estimating the covariance matrix from a
single population of one generation (Sect. 3.1). For
small populations this estimation is unreliable and an adaptation
procedure has to be invented (rank--update,
Sect. 3.2). In the limit case only a single point can be
used to update (adapt) the covariance matrix at each generation
(rank-one-update, Sect. 3.3). This adaptation can be
enhanced by exploiting dependencies between successive steps applying cumulation
(Sect. 3.3.2). Finally we combine the rank- and
rank-one updating methods (Sect. 3.4).
3.1 Estimating the Covariance Matrix From Scratch
For the moment we assume that the population contains enough
information to reliably estimate a covariance matrix from the
population.141414To re-estimate the covariance matrix, , from a
distributed sample such that a sample size is needed, as can be observed in
numerical experiments.
For the sake of convenience we assume (see
(5)) in this section. For the formulae hold
except for a constant factor.
We can (re-)estimate the original covariance matrix using the
sampled population from (5), , via
the empirical covariance matrix
(10)
The empirical covariance matrix is an
unbiased estimator of : assuming the , to be random variables (rather than a realized sample),
we have that .
Consider now a slightly different approach to get an estimator for
.
(11)
Also the matrix is an unbiased estimator of . The
remarkable difference between (10) and
(11) is the reference mean value. For
it is the mean of the actually realized
sample. For it is the true mean value, ,
of the sampled distribution (see (5)). Therefore, the
estimators and can be interpreted
differently: while estimates the distribution
variance within the sampled points, estimates
variances of sampled steps, .
A minor difference between (10) and
(11) is the different normalizations
versus , necessary to get an
unbiased estimator in both cases. In (10) one degree
of freedom is already taken by the inner summand. In order to get a
maximum likelihood estimator,
in both cases must be
used.
Equation (11) re-estimates the original covariance
matrix. To “estimate” a “better” covariance matrix,
the same, weighted
selection mechanism as in (6) is used
[21].
(12)
The matrix is an estimator for the distribution of
selected steps, just as is an estimator of the
original distribution of steps before selection. Sampling from
tends to reproduce selected, i.e.successful steps,
giving a justification for what a “better” covariance
matrix means.
Following [15], we compare (12) with the
Estimation of Multivariate Normal Algorithm
EMNAglobal[30, 31]. The covariance matrix in
EMNAglobal reads, similar to (10),
(13)
where .
Similarly, applying the so-called Cross-Entropy method to continuous
domain optimization [34] yields the covariance
matrix , i.e. the
unbiased empirical covariance matrix of the best points.
In both cases the subtle, but most important difference
to (12) is, again, the choice of the reference mean
value.151515Taking a weighted sum, , instead of the mean,
, is an appealing, but less important,
difference.
Equation (13) estimates the variance within the selected
population while (12) estimates selected steps.
Equation (13) reveals always smaller variances than
(12), because its reference mean value is the minimizer
for the variances. Moreover, in most conceivable selection
situations (13) decreases the variances compared to
.
sampling
estimation
new distribution
Figure 3: Estimation of the covariance
matrix on to be minimized.
Contour lines (dotted) indicate that the strategy should
move toward the upper right corner. Above: estimation of
according to (12), where .
Below: estimation of
according to (13). Left: sample of
distributed points. Middle: the selected
points (dots) determining the entries for the estimation
equation (solid straight lines). Right: search distribution
of the next generation (solid ellipsoids). Given , estimation via
increases the expected variance in gradient
direction for all , while estimation via
decreases this variance for
any geometrically fast
Figure 3 demonstrates the estimation results on
a linear objective function for , , and
. Equation (12) geometrically increases the expected
variance in direction of the gradient (where the selection takes
place, here the diagonal), given ordinary settings for parent number
and recombination weights . Equation (13)
always decreases the variance in gradient direction geometrically
fast! Therefore, (13) is highly susceptible to
premature convergence, in particular with small parent populations,
where the population cannot be expected to bracket the optimum at any
time. However, for large values of in large populations with
large initial variances, the impact of the different reference mean
value can become marginal.
In order to ensure with (5), (6), and
(12), that is a reliable estimator, the
variance effective selection mass (cf. (8))
must be large enough: getting condition numbers (cf. Sect. 0.4) smaller than ten for on
, requires .
The next step
is to circumvent this restriction on .
3.2 Rank--Update
To achieve fast search (opposite to more robust or
more global search), e.g. competitive performance on ,
the population size must be small. Because typically (and ideally) also
must be small and we may assume, e.g., . Then, it
is not possible to get a reliable estimator for a good
covariance matrix from (12). As a remedy, information from
previous generations is used additionally. For example, after a
sufficient number of generations, the mean of the estimated covariance
matrices from all generations,
(14)
becomes a reliable estimator for the selected steps. To make
from different generations comparable, the different are
incorporated. (Assuming , (14) resembles the
covariance matrix from the Estimation of Multivariate Normal Algorithm
EMNAi [31].)
In (14), all generation steps have the same weight. To
assign recent generations a higher weight, exponential smoothing is
introduced. Choosing to be the unity matrix and a
learning rate , then reads
(15)
where
learning rate for updating the covariance
matrix. For , no prior information is retained and
. For , no learning takes
place and . Here,
is a reasonably choice.
such that and .
.
is the mutation vector expressed in the unique coordinate system where the sampling is isotropic and the respective coordinate system transformation does not rotate the original principal axes of the distribution.
This covariance matrix update is called rank--update
[23], because the sum of outer products in
(15) is of rank with probability one (given
non-zero weights).
This sum can even consist of a single term, if .
Finally, we generalize (15) to weight values which need neither sum to , nor be non-negative anymore [28, 27],
where
such that , and usually and .
The second line of (3.2) expresses the update in the natural coordinate system, an idea already considered in [12]. The identity covariance matrix is updated and a coordinate system transformation is applied afterwards by multiplication with on both sides.
Equation (3.2) uses weights, , of which about half are negative. If the weights are chosen such that , the decay on disappears and changes are only made along axes in which samples are realized.
Negative values for the recombination weights in the covariance matrix update have been introduced in the seminal paper of Jastrebski and Arnold [28] as active covariance matrix adaptation. Non-equal negative weight values have been used in [27] together with a rather involved mechanism to make up for different vector lengths. The default recombination weights as defined in Table 1 in Appendix A are somewhere in between these two proposals, but closer to [28]. Slightly deviating from (3.2) later on, vector lengths associated with negative weights will be rescaled to a (direction dependent) constant, see (46) and (47) in Appendix A. This allows to guaranty positive definiteness of . Conveniently, it also alleviates a selection error which usually makes directions associated with longer vectors worse.
The number is the backward time horizon
that contributes roughly of the overall information.
the backward time horizon, , where about of the
overall weight is summed up, is defined by
(18)
Resolving the sum yields
(19)
and resolving for , using the Taylor approximation for
, yields
(20)
That is, approximately of the information in is older
than generations, and, according to
(19), the original weight is reduced by a factor
of after
approximately generations.161616This can be shown more easily, because for
small , and for we get immediately
.
The choice of is crucial. Small values lead to slow
learning, too large values lead to a failure, because the covariance
matrix degenerates. Fortunately, a good setting seems to be largely
independent of the function to be optimized.171717We use the sphere model to
empirically find a good setting for the parameter , dependent
on and . The found setting was applicable to any
non-noisy objective function we tried so far.
A first order approximation for a good choice is
. Therefore, the characteristic time
horizon for (3.2) is roughly .
Experiments
suggest that is a rather conservative setting for large values of ,
whereas appears to be slightly beyond the limit of
stability. The best, yet robust choice of the exponent remains to
be an open question.
Even for the learning rate
, adapting the covariance matrix cannot be accomplished
within one generation. The effect of the original sample distribution
does not vanish until a sufficient number of generations. Assuming fixed
search costs (number of function evaluations), a small population size
allows a larger number of generations and therefore usually
leads to a faster adaptation of the covariance matrix.
3.3 Rank-One-Update
In Section 3.1 we started by estimating the complete covariance
matrix from scratch, using all selected steps from a single
generation. We now take an opposite viewpoint. We
repeatedly update the covariance matrix in the generation
sequence using a single selected step only. First, this
perspective will give another justification of the adaptation rule
(3.2). Second, we will introduce the so-called evolution
path that is finally used for a rank-one update of the covariance matrix.
3.3.1 A Different Viewpoint
We consider a specific method to produce -dimensional normal
distributions with zero mean. Let the vectors
, , span and let
denote independent -normally distributed random
numbers, then
(21)
is a normally distributed random vector with zero
mean and covariance matrix
.
The random vector (21) is generated by adding
“line-distributions”
.
The singular distribution generates the vector
with maximum likelihood considering all normal
distributions with zero mean.
The line distribution that generates a vector with the
maximum likelihood must “live” on a line that includes ,
and therefore the distribution must obey . Any other
line distribution with zero mean cannot generate at
all. Choosing reduces to choosing the maximum likelihood
of for the one-dimensional gaussian
, which is .
The covariance matrix has rank one, its only
eigenvectors are with eigenvalue
. Using equation (21), any normal
distribution can be realized if are chosen
appropriately. For example, (21) resembles
(4) with , using the orthogonal
eigenvectors , for , where
are the columns of . In general, the vectors
need not to be eigenvectors of the covariance matrix,
and they usually are not.
Considering (21) and a slight simplification of
(3.2), we try to gain insight into the adaptation rule for
the covariance matrix. Let the sum in (3.2) consist of a
single summand only (e.g. ), and let . Then, the rank-one update for the
covariance matrix reads
(22)
The right summand is of rank one and adds the maximum likelihood term
for into the covariance matrix . Therefore the
probability to generate in the next generation
increases.
An example of the first two iteration steps of (22)
is shown in Figure 4.
Figure 4: Change of the distribution
according to the covariance matrix update (22). Left: vectors and , and
.
Middle: vectors , , and
(the coefficients deduce from ), and
, where
. The distribution ellipsoid is
elongated into the direction of , and therefore increases
the likelihood of . Right:
,
where .
The distribution tends to
reproduce with a larger probability than the initial
distribution ; the distribution
tends to reproduce
with a larger probability than ,
and so forth. When denote the formerly
selected, favorable steps, tends to
reproduce these steps. The process leads to an alignment of the
search distribution to the distribution of
the selected steps. If both distributions become alike, as under
random selection, in expectation no further change of the covariance
matrix takes place [13].
3.3.2 Cumulation: Utilizing the Evolution Path
We have used the selected steps, , to update the covariance matrix in
(3.2) and (22). Because , the sign of the steps is irrelevant for the
update of the covariance matrix — that is, the sign
information is lost when calculating . To reintroduce the sign
information, a so-called evolution path is constructed [24, 26].
We call a sequence of successive steps, the strategy takes over a
number of generations, an evolution path. An evolution path can be
expressed by a sum of consecutive steps. This summation is referred
to as cumulation. To construct an evolution path, the
step-size is disregarded. For example, an evolution path of
three steps of the distribution mean can be constructed by
the sum
(23)
In practice, to construct the evolution path, , we use
exponential smoothing as in (3.2), and start with
.181818In the final algorithm (24) is still slightly modified,
compare (45).
, evolution path at generation .
. Again, is the backward time horizon of
the evolution path that contains roughly of the overall
weight (compare derivation of (20)). A time horizon
between and is effective.
The factor is a normalization constant for
. For and , the factor reduces to one, and
.
The (rank-one) update of the covariance matrix via the
evolution path reads [24]
(28)
An empirically validated choice for the learning rate in
(28) is . For and
, Equations (28), (22), and
(3.2) are identical.
Using the evolution path for the update of is a significant
improvement of (3.2) for small , because
correlations between consecutive steps are heavily exploited. The leading
signs of steps, and the dependencies between consecutive steps play a
significant role for the resulting evolution path .
We consider the two most extreme situations, fully correlated steps and entirely anti-correlated steps. The summation in (24) reads for positive correlations
∑_i=0^(1-)^i →1(for ) ,
and for negative correlations
Multipling these by , which is
applied to each input vector, we find that the length of the evolution
path is modulated by the factor of up to
(29)
due to the positive correlations, or its inverse due to negative correlations, respectively [19, Equations (48) and (49)].
With the number of function evaluations needed to adapt a
nearly optimal covariance matrix on cigar-like objective functions
becomes , despite a learning rate of [19]. A plausible interpretation of this effect is two-fold. First, the desired axis is represented in the path (much) more accurately than in single steps. Second, the learning rate is modulated: the increased length of the evolution path
as computed in (29) acts in effect similar to an increased learning rate by a factor of up to .
Equation (30) reduces to (3.2) for and to
(28) for . The equation combines the advantages of
(3.2) and (28). On the one hand, the information
from the entire population is used efficiently by the
so-called rank- update. On the other hand,
information of correlations between generations is exploited by using
the evolution path for the rank-one update.
The former is important in large populations, the latter is
particularly important in small populations.
4 Step-Size Control
The covariance matrix adaptation, discussed in the last section, does
not explicitly control the “overall scale” of the distribution, the
step-size. The covariance matrix adaptation increases or decreases
the scale only in a single direction for each selected step—or it decreases the scale
by fading out old information by a given, non-adaptive factor.
Less informally, we have two specific reasons to
introduce a step-size control in addition to the adaptation rule
(30) for .
1.
The optimal overall step length cannot be well approximated by
(30), in particular if is chosen larger than
one.
For example, on , given and
,
the optimal step-size equals approximately
with equal recombination weights
[6, 33] and
with optimal recombination weights [4].191919Because recombination then reduces the size of the realized step by a factor of or (under random selection or in large dimension), the effective optimal steps are proportional to or , respectively.
This
dependency on or can not be realized by (3.2) or (30).
2.
The largest reliable learning rate for the covariance matrix
update in (30) is too slow to achieve competitive change
rates for the overall step length.
To achieve optimal performance on with an Evolution
Strategy with weighted recombination, the overall step length
must decrease by a factor of about
within function
evaluations, as can be derived from progress formulas as in
[4] and
[6, p. 229]. That is, the time horizon for the
step length change must be proportional to or shorter. From
the learning rates and in (30) follows that the
adaptation is too slow to perform competitive on
whenever . This can be validated by simulations even
for moderate dimensions, , and small .
To control the step-size we utilize an evolution
path, i.e. a sum of successive steps (see also
Sect. 3.3.2). The method can be applied
independently of the
covariance matrix update and is denoted as cumulative path
length control, cumulative step-size control, or
cumulative step length adaptation (CSA). The length of an
evolution path is exploited, based
on the following reasoning, as depicted in Fig. 5.
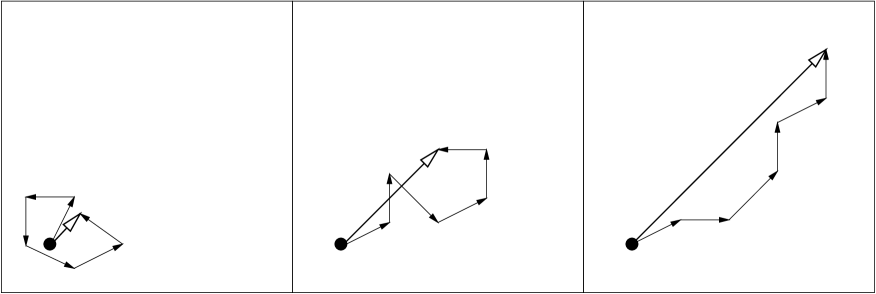
Figure 5: Three evolution paths of
respectively six steps from different selection situations
(idealized). The lengths of the single steps are all
comparable. The length of the evolution paths (sum of steps) is
remarkably different and is exploited for step-size control
•
Whenever the evolution path is short, single steps cancel each other
out (Fig. 5, left). Loosely speaking, they are
anti-correlated. If steps extinguish each other, the step-size
should be decreased.
•
Whenever the evolution path is long, the single steps are
pointing to similar directions (Fig. 5, right). Loosely
speaking, they are correlated. Because the steps are similar, the
same distance can be covered by fewer but longer steps into the same
directions. In the limit case, when consecutive steps have
identical direction, they can be replaced by any of the enlarged single
step. Consequently, the step-size should be increased.
•
In the desired situation the steps are (approximately)
perpendicular in expectation and therefore uncorrelated
(Fig. 5, middle).
To decide whether the evolution path is “long” or “short”, we
compare the length of the path with its
expected length under random selection202020Random selection means that the index (compare
(6)) is independent of the value of
for all , e.g. . ,
where consecutive steps are independent and therefore
uncorrelated (uncorrelated steps are the
desired situation). If selection biases the evolution path to be
longer then expected, is increased, and, vice versa, if
selection biases the evolution path to be shorter than expected,
is decreased. In the ideal situation, selection does not
bias the length of the evolution path and the length equals its
expected length under random selection.
In practice, to construct the evolution path, , the same
techniques as in (24) are applied. In contrast to
(24), a conjugate evolution path is constructed, because the expected length of the
evolution path from (24) depends on its direction
(compare (25)). Initialized with , the
conjugate evolution path reads
is the conjugate evolution path at generation
.
. Again, is the backward time
horizon of the evolution path (compare (20)). For small
, a time horizon between and is reasonable.
, where
is an eigendecomposition of , where
is an orthonormal basis of
eigenvectors, and the diagonal elements of the diagonal matrix
are square roots of the corresponding positive eigenvalues
(cf. Sect. 0.1).
For , we have and (31) replicates
(24). The transformation re-scales
the step within the coordinate system given by
.
The single factors of the transformation
can be explained as
follows (from right to left):
rotates the space such that the columns of ,
i.e. the principal axes of the distribution ,
rotate into the coordinate axes. Elements of the resulting vector
relate to projections onto the corresponding eigenvectors.
applies a (re-)scaling such that all axes become
equally sized.
rotates the result back into the original coordinate
system. This last transformation ensures that the principal axes of
the distribution are not rotated by the overall transformation and
directions of consecutive steps are comparable.
Consequently, the transformation makes the
expected length of independent of its direction, and for any
sequence of realized covariance matrices we have
under random selection , given
[13].
To update , we “compare” with its expected length
, that is
(32)
where
, damping parameter, scales the change magnitude
of . The factor is based on in-depth
investigations of the algorithm [13].
,
expectation of the Euclidean norm of a distributed
random vector.
For the second summand in (32) is zero,
and is unchanged, while is increased for
, and is decreased for
.
Alternatively, we might use the squared norm in
(32) and compare with its expected
value [5]. In this case (32) would
read
(33)
This update performs rather similar to (32), while it presumable leads to faster step-size increments and slower step-size decrements.
The step-size change is unbiased on the log scale,
because for
. The role of unbiasedness is discussed in
Sect. 5. Equations (31) and (32)
cause successive steps of the distribution mean to be
approximately -conjugate.
In order to show that successive steps are approximately -conjugate
first we remark that (31) and (32) adapt
such that the length of equals approximately .
Starting from of
(31) and assuming that the expected squared length of
is unchanged by selection (unlike its direction) we get
The length of the evolution path is an intuitive and
empirically well validated goodness measure for the overall step
length. For it is the best measure to our knowledge.212121Recently, two-point adaptation has shown to achieve
similar performance [20].
Nevertheless, it fails to adapt nearly optimal step-sizes on very
noisy objective functions [7].
5 Discussion
The CMA-ES is an attractive option for non-linear
optimization, if “classical” search methods, e.g. quasi-Newton
methods (BFGS) and/or conjugate gradient methods, fail due to a
non-convex or rugged search landscape (e.g. sharp bends,
discontinuities, outliers, noise, and local optima). Learning the
covariance matrix in the CMA-ES is analogous to learning the inverse
Hessian matrix in a quasi-Newton method. In the end, any
convex-quadratic (ellipsoid) objective function is
transformed into the spherical function . This can reduce
the number of -evaluations needed to reach a target -value
on ill-conditioned and/or non-separable problems by
orders of magnitude.
The CMA-ES overcomes typical problems that are often
associated with evolutionary algorithms.
1.
Poor performance on badly scaled and/or highly
non-separable objective functions. Equation (30) adapts
the search distribution to badly scaled and non-separable
problems.
2.
The inherent need to use large population sizes. A
typical, however intricate to diagnose reason for the failure of
population based search algorithms is the degeneration of the
population into a subspace.222222The same problem can be observed with the downhill simplex
method [32] in dimension, say, larger than ten.
This is usually prevented by
non-adaptive components in the algorithm and/or by a large
population size (considerably larger than the problem dimension).
In the CMA-ES, the population size can be freely chosen, because
the learning rates and in (30) prevent the degeneration even
for small population sizes, e.g. . Small population
sizes usually lead to faster convergence, large population sizes help to avoid
local optima.
3.
Premature convergence of the population. Step-size control in
(37) prevents the population to converge prematurely. It
does not prevent the search to end up in a local optimum.
Therefore, the CMA-ES is highly competitive on a
considerable number of test functions
[13, 21, 23, 25, 26]
and was
successfully applied to many real world problems.232323The author stopped to maintain the growing list of (at the time 120) published references to applications in 2009.
Finally, we discuss a few basic design principles that were applied
in the previous sections.
Change rates
We refer to a change rate as the expected parameter change per
sampled search point, given a certain selection situation. To
achieve competitive performance on a wide range of objective
functions, the possible change rates of the adaptive parameters need
to be adjusted carefully. The CMA-ES separately controls change rates
for the mean value of the distribution, , the covariance
matrix, , and the step-size, .
•
The change rate for the mean value , relative to the
given sample distribution, is determined by , and by the parent number and the
recombination weights. The larger , the smaller is the
possible change rate of .242424Given , then the mean change per generation is roughly
proportional to , while the optimal step-size is roughly proportional to .
Therefore, the net change with optimal step-size is proportional to
per generation.
Now considering the effect on the resulting convergence rate,
a closer approximation of the gradient adds another
factor of , such that the generational progress rate is
proportional to . Given , we have the remarkable
result that the convergence
rate per -evaluation is roughly independent of .
Similar holds for most evolutionary algorithms.
•
The change rate of the covariance matrix is explicitly
controlled by the learning rates and and therefore detached from
parent number and population size. The learning rate reflects the
model complexity. In evolutionary algorithms, the explicit control
of change rates of the covariances, independently of population
size and mean change, is a rather unique
feature.
•
The change rate of the step-size is explicitly controlled by the
damping parameter and is in particular independent from the
change rate of . The time constant ensures a
sufficiently fast change of the overall step length in particular
with small population sizes.
Invariance
Invariance properties of a search
algorithm denote identical behavior on a set, or a class of objective
functions. Invariance is an important property of the
CMA-ES.252525Special acknowledgments to Iván
Santibán̄ez-Koref for pointing this out to
me.
Translation invariance should be taken for granted in continuous
domain optimization. Translation invariance means that the search
behavior on the function ,
, is independent of .
Further invariances, e.g. invariance to certain linear transformations of the
search space, are highly desirable: they imply uniform performance on
classes of functions262626However, most invariances are linked to a state space transformation. Therefore, uniform performance is only observed after the state of the algorithm has been adapted.
and therefore allow for generalization of
empirical results. In addition to translation invariance, the CMA-ES exhibits the following invariances.
•
Invariance to order preserving (i.e. strictly monotonic)
transformations of the
objective function value. The algorithm only depends on the ranking of
function values.
•
Invariance to angle preserving (rigid) transformations of the search space (rotation,
reflection, and translation) if the initial search
point is transformed accordingly.
•
Scale invariance if the initial scaling,
e.g. , and the initial search
point, , are chosen
accordingly.
•
Invariance to a scaling of variables (diagonal invariance)
if the initial diagonal covariance matrix , and the initial
search point, , are chosen accordingly.
•
Invariance to any invertible linear transformation of the
search space, , if the initial covariance matrix
, and the initial
search point, , are
transformed accordingly. Together with translation invariance, this can
also be referred to as affine invariance, i.e. invariance to
affine search space transformations.
Invariance should be a fundamental design criterion for any search
algorithm. Together with the ability to efficiently adapt the
invariance governing parameters, invariance is a key to
competitive performance.
Stationarity or Unbiasedness
An important design criterion for a randomized search procedure
is unbiasedness of
variations of object and strategy parameters
[8, 26]. Consider random selection,
e.g. the objective function to be
independent of . Then the population mean is unbiased if its
expected value remains unchanged in the next generation, that is
. For the population
mean, stationarity under random selection is a rather intuitive
concept. In the CMA-ES, stationarity is respected for all parameters
that appear in the basic equation (5). The distribution mean
, the covariance matrix , and are unbiased.
Unbiasedness of does not imply that is unbiased.
Under random selection,
, compare
(32).272727Alternatively, if (37) were designed to be unbiased
for , this would imply that
, in our opinion
a less desirable alternative.
For distribution variances (or step-sizes) a bias toward increase or
decrease entails the risk of divergence or premature convergence,
respectively, whenever the selection pressure is low or when no
improvements are observed.
On noisy problems, a properly controlled bias towards increase can be
appropriate. It has the non-negligible disadvantage that the decision
for termination becomes more difficult.
Acknowledgments
The author wishes to gratefully thank Anne Auger, Christian Igel,
Stefan Kern, and Fabrice Marchal for the many valuable comments on the
manuscript.
References
[1]
Akimoto Y, Auger A, Hansen N.
Quality gain analysis of the weighted recombination evolution
strategy on general convex quadratic functions.
In Proceedings of the 14th ACM/SIGEVO Conference on Foundations
of Genetic Algorithms (FOGA ’17), pages 111–126. ACM, New York, NY, USA,
2017.
[2]
Akimoto Y, Hansen N.
Diagonal acceleration for covariance matrix adaptation evolution
strategies.
Evolutionary computation, 28(3):405–435, 2020.
[3]
Auger A, Hansen N.
A restart CMA evolution strategy with increasing population size.
In Proceedings of the IEEE Congress on Evolutionary
Computation, 2005.
[5] Arnold DV, Beyer HG.
Performance analysis of evolutionary optimization with cumulative step length adaptation.
IEEE Transactions on Automatic Control,
49(4):617–622, 2004.
[6]Beyer HG.
The Theory of Evolution Strategies.
Springer, Berlin, 2001.
[7]Beyer HG, Arnold DV.
Qualms regarding the optimality of cumulative path length control in
CSA/CMA-evolution strategies.
Evolutionary Computation, 11(1):19–28, 2003.
[8]Beyer HG, Deb K.
On self-adaptive features in real-parameter evolutionary algorithms.
IEEE Transactions on Evolutionary Computation, 5(3):250–270,
2001.
[9]
Collange G, Delattre N, Hansen N, Quinquis I, Schoenauer M.
Multidisciplinary optimisation in the design of future space
launchers.
In Breitkopf and Coelho, editors, Multidisciplinary
Design Optimization in Computational Mechanics, chapter 12, pages 487–496.
Wiley, 2010.
[10]
Dufossé P, Hansen N.
Augmented Lagrangian, penalty techniques and surrogate modeling for
constrained optimization with CMA-ES.
In Proceedings of the Genetic and Evolutionary Computation
Conference (GECCO ’21), pages 519–527, 2021.
[11]
Gissler A, Auger A, Hansen N.
Learning rate adaptation by line search in evolution strategies with
recombination.
In Proceedings of the Genetic and Evolutionary Computation
Conference (GECCO ’22), pages 630–638. ACM, New York, NY, USA, 2022.
[12]
Glasmachers T, Schaul T, Yi S, Wierstra D, Schmidhuber J.
Exponential natural evolution strategies.
In Proceedings of the 12th annual Genetic and Evolutionary Computation Conference, GECCO, pages 393–400. ACM, 2010.
[13]
Hansen N.
Verallgemeinerte individuelle Schrittweitenregelung in der
Evolutionsstrategie.Mensch und Buch Verlag, Berlin, 1998.
[14]
Hansen N.
Invariance, self-adaptation and correlated mutations in evolution
strategies.
In Schoenauer M, Deb K, Rudolph G, Yao X, Lutton E,
Merelo JJ, Schwefel HP, editors, Parallel Problem Solving from Nature - PPSN
VI, pages 355–364. Springer, 2000.
[15]
Hansen N.
The CMA evolution strategy: a comparing review.
In Lozano JA, Larranaga P, Inza I, and Bengoetxea E, editors,
Towards a new evolutionary computation. Advances on estimation of
distribution algorithms, pages 75–102. Springer, 2006.
[16]
Hansen N.
Benchmarking a BI-Population CMA-ES on the BBOB-2009 Function Testbed.
In the workshop Proceedings of the Genetic and Evolutionary Computation Conference, GECCO, pages 2389–2395. ACM, 2009.
[17]
Hansen N.
Variable Metrics in Evolutionary Computation.
Habilitation à diriger des recherches, Université Paris-Sud, 2010.
[18]
Hansen N.
Injecting External Solutions Into CMA-ES.
CoRR, arXiv:1110.4181, 2011.
[19]
Hansen N, Auger A.
Principled design of continuous stochastic search: From theory to practice.
In Y Borenstein and A Moraglio, eds.: Theory and Principled Methods for Designing Metaheustics. Springer, pages 145–180, 2014.
[20]
Hansen N, Atamna A, Auger A.
How to Assess Step-Size Adaptation Mechanisms in Randomised Search.
In Parallel Problem Solving from Nature – PPSN XIII, pages 60–69. Springer, 2014.
[21]
Hansen N, Kern S.
Evaluating the CMA evolution strategy on multimodal test functions.
In Xin Yao et al., editors, Parallel Problem Solving from Nature
– PPSN VIII, pages 282–291. Springer, 2004.
[22]
Hansen N, Niederberger SPN, Guzzella L, Koumoutsakos P.
A method for
handling uncertainty in evolutionary optimization with an application to
feedback control of combustion.
IEEE Transactions on Evolutionary Computation,
13(1):180–197, 2009.
[23]
Hansen N, Müller SD, Koumoutsakos P.
Reducing the time complexity of the derandomized evolution strategy
with covariance matrix adaptation (CMA-ES).
Evolutionary Computation, 11(1):1–18, 2003.
[24]
Hansen N, Ostermeier A.
Adapting arbitrary normal mutation distributions in evolution
strategies: The covariance matrix adaptation.
In Proceedings of the 1996 IEEE Conference on Evolutionary
Computation (ICEC ’96), pages 312–317, 1996.
[25]
Hansen N, Ostermeier A.
Convergence properties of evolution strategies with the derandomized
covariance matrix adaptation: The ()-CMA-ES.
In Proceedings of the 5th European Congress on Intelligent
Techniques and Soft Computing, pages 650–654, 1997.
[26]
Hansen N, Ostermeier A.
Completely derandomized self-adaptation in evolution strategies.
Evolutionary Computation, 9(2):159–195, 2001.
[27]
Hansen N, Ros R.
Benchmarking a weighted negative covariance matrix update on the BBOB-2010 noiseless testbed.
In Proceedings companion of the 12th annual Genetic and Evolutionary Computation Conference, GECCO, pages 1673–1680. ACM, 2010.
[28]
Jastrebski G, Arnold DV.
Improving evolution strategies through active covariance matrix adaptation.
In Proceedings of the 2006 IEEE Congress on Evolutionary Computation, CEC, pages 2814–2821. IEEE, 2006.
[29]Kern S, Müller SD, Hansen N, Büche D,
Ocenasek J, Koumoutsakos P.
Learning probability distributions in continuous evolutionary
algorithms – a comparative review.
Natural Computing, 3:77–112, 2004.
[30]Larrañaga P.
A review on estimation of distribution algorithms.
In P. Larrañaga and J. A. Lozano, editors, Estimation of
Distribution Algorithms, pages 80–90. Kluwer Academic Publishers, 2002.
[31]Larrañaga P, Lozano JA, Bengoetxea E.
Estimation of distribution algorithms based on multivariate normal
and Gaussian networks.
Technical report, Dept. of Computer Science and Artificial
Intelligence, University of the Basque Country, 2001.
KZAA-IK-1-01.
[32]
Nelder JA, Mead R.
A simplex method for function minimization.
The Computer Journal 7.4:308-313, 1965.
[33]Rechenberg I.
Evolutionsstrategie ’94.
Frommann-Holzboog, Stuttgart, Germany, 1994.
[34] Rubenstein RY, Kroese DP.
The Cross-Entropy Method: a unified approach to combinatorial optimization, Monte-Carlo simulation, and machine learning.
Springer, 2004.
[35] Suttorp T, Hansen N, Igel C.
Efficient Covariance Matrix Update for Variable Metric Evolution Strategies.
Machine Learning 75(2): 167–197, 2009.
Appendix A Algorithm Summary: The -CMA-ES
Figure 6 outlines the complete algorithm282828With negative recombination weights in the covariance matrix, chosen here by default, the algorithm is sometimes denoted as aCMA-ES for active CMA [28].,
summarizing (5), (9), (24),
(30), (31), and (37).
Used symbols, in order of appearance, are:
Set parametersSet parameters , , , , ,
, , and according
to Table 1.InitializationSet evolution paths ,
, covariance matrix , and .Choose distribution mean and step-size
problem dependent.1Until termination criterion met, Sample new population of search points, for (38)(39)(40)Selection and recombination(41)(42)Step-size control(43)(44)Covariance matrix adaptation(45) if else (46)(47)1The optimum should presumably be within the initial cube . If the optimum is expected to be in the
initial search interval we may choose the initial search
point, , uniformly randomly in , and
. Different search intervals
for different variables can be reflected by a different
initialization of , in that the diagonal elements of
obey . However, the should not disagree by several orders of magnitude. Otherwise a
scaling of the variables should be applied.
Figure 6: The -CMA
Evolution Strategy. Symbols: see text
, for , are
realizations from a multivariate normal distribution with
zero mean and covariance matrix .
result from an eigendecomposition of the
covariance matrix with
(cf. Sect. 0.1). Columns of are an orthonormal basis
of eigenvectors. Diagonal elements of the diagonal matrix are
square roots of the corresponding positive eigenvalues. While
(39) can certainly be implemented using a Cholesky
decomposition of , the eigendecomposition is needed to correctly
compute for (43)
and (46).
, for . Sample of search
points.
, step of the
distribution mean disregarding step-size .
, see below.
, -th best point out of
from (40). The index
denotes the index of the -th ranked point, that
is .
is the number of strictly positive recombination weights.
is the variance
effective selection mass, see (8). Because , we have
.
,
see above. The matrix can be inverted by inverting
its diagonal elements. From the definitions we find that
, and
.
.
, where is the generation number.
The Heaviside function stalls the update of in
(45) if is large. This prevents a too fast
increase of axes of in a linear surrounding, i.e. when the
step-size is far too small. This is useful when the initial
step-size is chosen far too small or when the objective function
changes in time.
is of minor
relevance. In the (unusual) case of , it substitutes for
the second summand from (45) in (47).
is the sum of the recombination weights, see (49)–(55). We have and for the default population size , we meet the lower bound .
Default Parameters
The (external) strategy parameters are , , ,
, , , , and . Default
strategy parameter values are given in Table 1.
Table 1: Default Parameters (in 2016), where
,
,
,
, and is the sum
of all positive, and the sum of all negative -values,
i.e., .
Apart from for , all parameters are taken from [16]
with only minor modifications
Selection and Recombination:(48)(49)(50)(51)(52)(55)(56)Step-size control:(57)Covariance matrix adaptation:(58)(59)(60)
An in-depth discussion of most parameters is given in
[26].
The given setting for the default negative weights was introduced in 2016.
The setting is somewhere between uniform weights [28]
and mirrors of the positive weight values [4, 27].
The choice is a compromise between avoiding increasingly large negative values which lead to a large variance reduction in a single direction in while still giving emphasis on the selection differences in particular for weights close to the median rank. We attempt to scale all negative weights such that the factor in front of in (47) becomes . That is, we have by default no decay on and the variance added to the covariance matrix by the positive updates equals, in expectation, to the variance removed by the negative updates.
Choosing in the order of is only viable if , that is, if the variance effective update information from positive weights, , is not much larger than that from negative weights, . In the default setting, is about to times larger than , because the curve versus flattens out for increasing . In (55) we use the bound , see (51), to (i) get a meaningful value for any choices of , and (ii) preserve the effect from letting go to zero (eventually turning off the covariance matrix adaptation entirely).
The apparent circular dependency between , , , ,
and again can be resolved:
the variance effective selection mass depends
only on the relative relation between the positive weights, such that
. That is, and can be
computed already from of (49), from which can be computed,
from which can be computed, from which the remaining negative weights
can be computed.
Finally, we also bound the negative weights via (55)
to guaranty positive definiteness of via (46),
thereby, possibly, re-introducing a decay on .
With the default setting for population size and the default raw weight values, in Equation (55) leaves the weights unchanged.
Specifically, to guaranty positive definiteness of the covariance matrix, we can bound the maximal variance subtracted in a single direction by the variance remaining after the decay on is applied in (47), disregarding any added variance (worst case).
Defining to be the sum of the absolute values of all negative weights, and assuming a (Mahalanobis-)variance of from each negative summand of the weighted sum in (47), we require
(61)
Solving for yields
(62)
We use as multiplier for setting in (55) and normalize the variance from each respective summand via (46) to , thereby bounding the variance reduction from negative weight values to the factor .
A Python implementation of the slightly intricate computation of the weights (49)–(55) can be found here.
The cumulation parameter for (58) is chosen .
For learning a single direction in (almost) linear time, the setting seems sufficient [19].
Larger values are in general more robust to avoid feedback oscillations or instabilities and might allow for more freedom in the setting of .
However, on the cigar function the relationship between times dimension () and the evaluations divided by dimension to reach a given target becomes perfectly invariant with increasing dimension.292929
This invariance remains almost perfect when the learning rates and are chosen instead of ( is however not a reliable setting).
It changes to about when only the diagonal elements of the covariance matrix are adapted with a learning rate of .
Adopting a technique from [35, Eq. (11)], a generalized setting reads
(63)
With and , the setting is slightly more robust in larger dimension but remains invariant, see Figure 7.
When not all parameters of are subject to adaptation and , we suspect that is the reasonable choice.
The last summand of the denominator of (63) is chosen such that approaches when
approaches infinity.
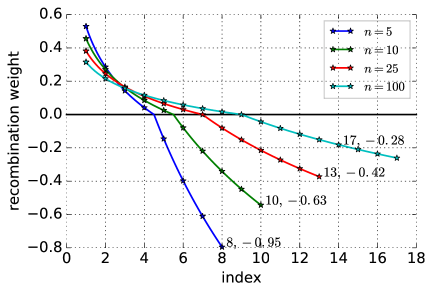
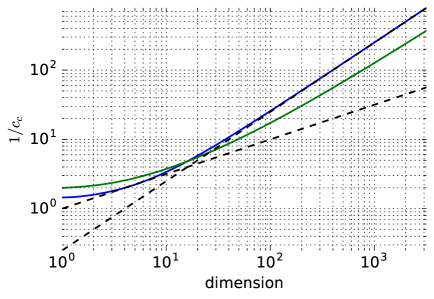
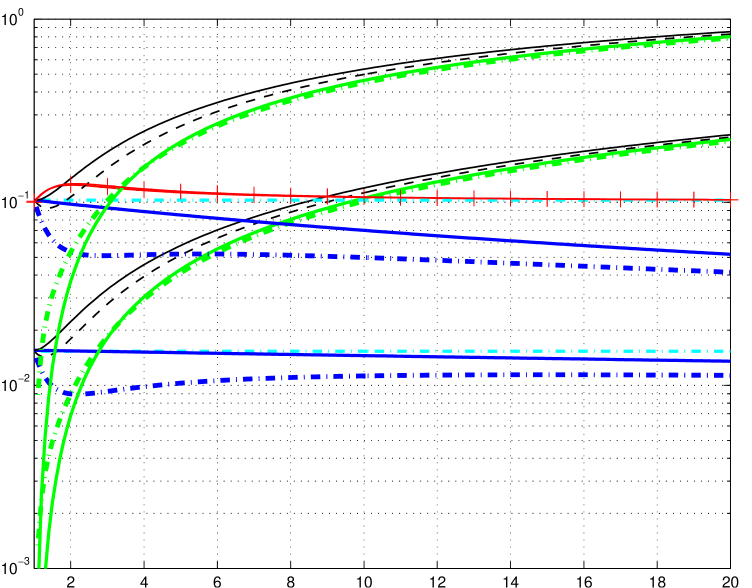
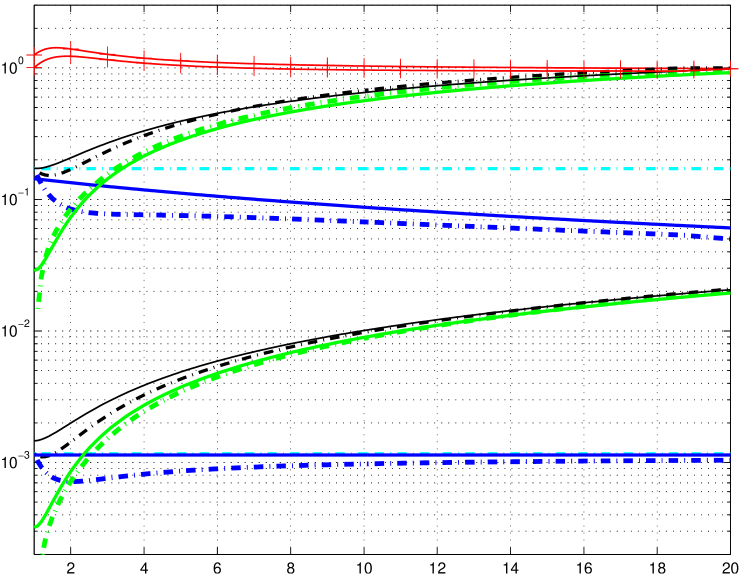
Figure 7:
Left: recombination weights from (55) in Table 1 for .
Also given are the (default) population size (corresponding to the last index) and the sum of weights. Positive weights sum to one.
Right: backward time horizon according to (58) (blue) and (63) (green), and and (both dashed) plotted against dimension . The blue line is above the green line by a factor of about for , respectively.
Similarly, the second summand of the denominator of (60), , is chosen such that
approaches one when approaches times the first summand.
Another technique, namely setting parameters depending on the degrees of freedom is developed in [2].
The default parameters of
(55)–(60) are in particular chosen to be a
robust setting and therefore, to our experience, applicable to a wide
range of functions to be optimized. We do not recommend to change this
setting, apart from increasing the population size in (48),303030Decreasing is not recommended. Too small values
have strong adverse effects on the performance.
and possibly decreasing on noisy functions.
If the -dependent default values for are used as given,
the population size has a significant influence on the global
search performance [21]. Increasing usually
improves the global search capability and the robustness of the CMA-ES,
at the price of a reduced convergence speed. The convergence speed
(per function evaluation) decreases at most linearly with . Independent restarts with
increasing population size [3], automated or manually
conducted, are a useful policy to perform well on most problems.
Appendix B Implementational Concerns
We discuss a few implementational questions.
B.1 Multivariate normal distribution
Let the
vector have independent, -normally
distributed components that can easily be sampled on a computer. To
generate a random vector
for (39), we set (see above symbol
descriptions of and and Sects. 0.1 and
0.2, and compare lines 52–53 and 83–84 in the source
code below). Given and
we have
(compare
(43) and lines 61 and 64 in the source code below).
B.2 Strategy internal numerical effort
In practice, the
re-calculation of and needs to be done not until about
generations. For reasonable
values, this reduces the numerical effort due to the
eigendecomposition from to per
generated search point, that is the effort of a matrix vector
multiplication.
On a Pentium 4, 2.5 GHz processor
the overall strategy internal time consumption is roughly
seconds per function evaluation
[29].
Remark that it is not sufficient to compute a Cholesky decomposition
of , because then (43) cannot be computed correctly.
B.3 Termination criteria
In general, the algorithm should be stopped whenever it becomes a
waste of CPU-time to continue, and it would be better to restart
(eventually with increased population size [3]) or to
reconsidering the encoding and/or objective function formulation. We
recommend the following termination criteria [3, 16] that
are mostly related to numerical stability:
•
NoEffectAxis: stop if adding a -standard deviation
vector in any principal axis direction of does not change
.313131More formally, we terminate if equals to
, where , and and are respectively the -th
eigenvalue and eigenvector of , with .
•
NoEffectCoord: stop if adding -standard
deviations in any single coordinate does not change
(i.e. equals for any ).
•
ConditionCov: stop if the condition number of the
covariance matrix exceeds .
•
EqualFunValues: stop if the range of the best
objective function values of the last generations is zero.
•
Stagnation: we track a history of the best and the median fitness in each iteration over the last 20% but at least and no more than iterations. We stop, if in both histories the median of the last (most recent) 30% values is not better than the median of the first 30%.
•
TolXUp: stop if
increased by more than . This usually indicates a far too
small initial , or divergent behavior.
Two other useful termination criteria should be considered problem dependent:
•
TolFun: stop if the range of the best objective
function values of the last
generations and all function values of the recent generation is
below TolFun. Choosing TolFun depends on the
problem, while is a conservative first guess.
•
TolX: stop if the standard deviation of the normal distribution is
smaller than TolX in all coordinates and is smaller than
TolX in all components. By default we set TolX to
times the initial .
B.4 Flat fitness
In the case of equal function
values for several individuals in the population, it is feasible to
increase the step-size (see lines 92–96 in the source code
below). This method can interfere with the termination criterion
TolFun. In practice, observation of a flat fitness should
be rather a termination criterion and consequently lead to a
reconsideration of the objective function formulation.
B.5 Boundaries and Constraints
The handling of boundaries and
constraints is to a certain extend problem dependent. We discuss a few
principles and useful approaches.
Best solution strictly inside the feasible domain
If the optimal solution is not too close to the infeasible
domain, a simple and sufficient way to handle any type of boundaries and constraints is
1.
setting the fitness as
(64)
where is larger than the worst fitness in the feasible
population or in the feasible domain (in case of minization) and
is a constant feasible point, preferably in the middle of the
feasible domain.
2.
re-sampling any infeasible solution until it
become feasible.
Repair available
as for example with box-constraints.
Simple repair
It is possible to simply repair infeasible individuals before the update equations are applied. This is not recommended, because the CMA-ES makes implicit assumptions on the distribution of solution points, which can be heavily violated by a repair. The main resulting problem might be divergence or too fast convergence of the step-size. However, a (re-)repair of changed or injected solutions for their use in the update seems to solve the problem of divergence [18] (clipping the Mahalanobis distance of the step length to obey seems to be sufficient). Note also that repair mechanisms might be intricate to implement, in particular if or are used for implementing the update equations in the original code.
Penalization
We evaluate the objective function on a repaired
search point, , and add a penalty
depending on the distance to the repaired solution.
(65)
The repaired solution is disregarded afterwards.
In case of box-boundaries, is set to
the feasible solution with the smallest distance
. In other words, components
that are infeasible in are set to the (closest) boundary
value in . A similar boundary handling
with a component-wise adaptive is described in
[22].
No repair mechanism available
The fitness of the
infeasible search point might similarly compute to
(66)
where, w.l.o.g., the (non-linear) constraints are satisfied for , and
the indicator function equals to one
for , zero otherwise, and equals, for example, to the median or -tile or best function
value of the feasible points
in the same generation. If no other information is available, might be computed as the squared distance of to the best or the closest feasible solution in the population or the closest known feasible solution. The latter is reminiscent to the boundary repair above.
This approach has not yet been experimentally
evaluated by the author. A different, slightly more involved approach is given in [9].
Similar and more recent approaches [10] have already found there way into the Python cma package.
In either case of (65) and (66),
should be chosen such that the differences in and the
differences in the second summand have a similar magnitude.
Appendix C MATLAB Source Code
This code does not implement negative weights, that is, for in Table 1.
  1 function xmin=purecmaes
  2   % CMA-ES: Evolution Strategy with Covariance Matrix Adaptation for
  3   % nonlinear function minimization.
  4   %
  5   % This code is an excerpt from cmaes.m and implements the key parts
  6   % of the algorithm. It is intendend to be used for READING and
  7   % UNDERSTANDING the basic flow and all details of the CMA *algorithm*.
  8   % Computational efficiency is sometimes disregarded.
  9
 10   % --------------------  Initialization --------------------------------
 11
 12   % User defined input parameters (need to be edited)
 13   strfitnessfct = ’felli’; % name of objective/fitness function
 14   N = 10;                  % number of objective variables/problem dimension
 15   xmean = rand(N,1);       % objective variables initial point
 16   sigma = 0.5;             % coordinate wise standard deviation (step-size)
 17   stopfitness = 1e-10;  % stop if fitness < stopfitness (minimization)
 18   stopeval = 1e3*N^2;   % stop after stopeval number of function evaluations
 19
 20   % Strategy parameter setting: Selection
 21   lambda = 4+floor(3*log(N));  % population size, offspring number
 22   mu = lambda/2;   % lambda=12; mu=3; weights = ones(mu,1); would be (3_I,12)-ES
 23   weights = log(mu+1/2)-log(1:mu)’;     % muXone recombination weights
 24   mu = floor(mu);      % number of parents/points for recombination
 25   weights = weights/sum(weights);       % normalize recombination weights array
 26   mueff=sum(weights)^2/sum(weights.^2); % variance-effective size of mu
 27
 28   % Strategy parameter setting: Adaptation
 29   cc = (4+mueff/N) / (N+4 + 2*mueff/N);  % time constant for cumulation for C
 30   cs = (mueff+2)/(N+mueff+5);  % t-const for cumulation for sigma control
 31   c1 = 2 / ((N+1.3)^2+mueff);  % learning rate for rank-one update of C and
 32   cmu = min(1-c1, 2*(mueff-2+1/mueff) / ((N+2)^2+2*mueff/2));  % for rank-mu update
 33   damps = 1 + 2*max(0, sqrt((mueff-1)/(N+1))-1) + cs; % damping for sigma
 34
 36   % Initialize dynamic (internal) strategy parameters and constants
 37   pc = zeros(N,1); ps = zeros(N,1);   % evolution paths for C and sigma
 38   B = eye(N);                         % B defines the coordinate system
 39   D = eye(N);                         % diagonal matrix D defines the scaling
 40   C = B*D*(B*D)’;                     % covariance matrix
 41   eigeneval = 0;                      % B and D updated at counteval == 0
 42   chiN=N^0.5*(1-1/(4*N)+1/(21*N^2));  % expectation of
 43                                       %   ||N(0,I)|| == norm(randn(N,1))
 44
 45   % -------------------- Generation Loop --------------------------------
 46
 47   counteval = 0;  % the next 40 lines contain the 20 lines of interesting code
 48   while counteval < stopeval
 49
 79     % Update B and D from C
 80     if counteval - eigeneval > lambda/(cone+cmu)/N/10  % to achieve O(N^2)
 81       eigeneval = counteval;
 82       C=triu(C)+triu(C,1)’; % enforce symmetry
 83       [B,D] = eig(C);       % eigen decomposition, B==normalized eigenvectors
 84       D = diag(sqrt(diag(D))); % D contains standard deviations now
 85     end
 86
 87     % Break, if fitness is good enough
 88     if arfitness(1) <= stopfitness
 89       break;
 90     end
 91
 92     % Escape flat fitness, or better terminate?
 93     if arfitness(1) == arfitness(ceil(0.7*lambda))
 94       sigma = sigma * exp(0.2+cs/damps);
 95       disp(’warning: flat fitness, consider reformulating the objective’);
 96     end
 97
 98     disp([num2str(counteval) ’: ’ num2str(arfitness(1))]);
 99
100   end % while, end generation loop
101
102   % -------------------- Final Message ---------------------------------
103
104   disp([num2str(counteval) ’: ’ num2str(arfitness(1))]);
105   xmin = arx(:, arindex(1)); % Return best point of last generation.
106                              % Notice that xmean is expected to be even
107                              % better.
108
109 % ---------------------------------------------------------------
110 function f=felli(x)
111   N = size(x,1); if N < 2 error(’dimension must be greater one’); end
112   f=1e6.^((0:N-1)/(N-1)) * x.^2;  % condition number 1e6
Appendix D Reformulation of Learning Parameter
For sake of consistency and clarity, we have reformulated the learning coefficients in (47) and replaced
The resulting coefficients are quite similar to the previous. In
contrast to the previous formulation, becomes monotonic in
and becomes virtually monotonic in
.
Another alternative, depending only on the degrees of freedom in the covariance matrix and additionally correcting for very small , reads
(72)
(73)
(74)
where is the degrees of freedom in the covariance
matrix. For , the coefficient is now chosen to be
larger than zero, as . Figure 8 compares the
new learning rates with the old ones.
Figure 8: Learning rates (solid)
and (dash-dotted) versus . Above: Equations
(70) etc. for . Below: Equations
(72) etc. for . Black: and
; blue: and ; green: and
; cyan: ; red:
, above divided by ten. For the
difference is maximal, because decreases much slower with
increasing and is non-monotonic in (a main
reason for the new formulation).