A QCD analysis of CMS inclusive differential Z production data at = 8 TeV
Rajdeep M Chatterjeea, Monoranjan Guchaita,
Ringailė Plačakytėb
a Department of High Energy Physics
Tata Institute of Fundamental Research
Homi Bhabha Road, Mumbai-400005, India.
b Deutsches Elektronen-Synchrotron DESY
Notkestr. 85, D-22607, Hamburg, Germany
Abstract
The parton distribution functions (PDFs) of the proton are one of the essential ingredients to describe physics processes at hadron colliders. The Z boson production data at the LHC have a potential to constrain PDFs, especially the gluon distribution. In this study the CMS measurement of the inclusive double differential Z boson production cross section in terms of transverse momentum and rapidity are compared to the next-to-leading order theory predictions at the center of mass energy, =8 TeV with an integrated luminosity of 19.71 . In addition, the sensitivity of this measurement to PDFs is studied within the framework of the HERAFitter. A moderate improvement to the gluon distribution is observed at the Bjorken region. However, in order to obtain further improvement to the gluon distribution in the global fits, the higher-order theory calculations accessible via fast techniques are necessary.
1 Introduction
The precision measurements of the Standard Model (SM) of particle physics are one of the top priority programmes at the LHC. The accurate theory predictions are necessary in order to completely exploit the potential of the SM measurements. Importantly, in the hadron colliders parton distribution functions (PDFs) are one of the necessary ingredients for theory predictions. Naively, the PDF represent the probability of finding a parton of flavour (where : g(gluons),q (quarks); q=u,d,c,s..) inside a proton carrying a fraction of the momentum of the proton at the scale , called the factorization scale related with the hard scale of the involved physical process. The PDFs cannot be derived from the first principles of Quantum Chromodynamics (QCD) [1] and have to be constrained experimentally. The PDFs are constrained primarily by the Deep Inelastic Scattering (DIS) data. Additional constraints come from the Fixed-target, Tevatron and LHC measurements [for more details, see for example, the reviews in Ref.[2, 3] and references therein].
Currently, various published SM measurements at the LHC with the center of mass energies 7 and 8 TeV are already used in the global PDF fits [4, 5, 6, 7]. Besides these global PDF fitting efforts, the sensitivity of the particular LHC measurement to PDFs are also studied. For example, PDFs are constrained using the measurement of the W and Z production to strange quark distribution in ATLAS [8], the CMS W charge asymmetry [9] and W in association with the charm quark measurements at 7 TeV [10], W boson production in association with a single charm quark in ATLAS [11], the inclusive jet cross sections from the LHC [12, 13, 14, 15], top quark pair production [16, 17] etc. In this current analysis, the impact to the PDFs of the CMS production cross section measurement of the Z boson decaying to a pair of muons [18, 19] is studied. This measurement is performed in various bins of transverse momentum () and rapidity () of the Z boson. The QCD analysis is performed at the Next-to-Leading order(NLO) in the framework of the HERAFitter [20]. Along with the CMS Z boson measurements, the inclusive HERA-I DIS [21] and the CMS W muon asymmetry data [9] are used in this study.
This note is organized as follows. In Sec.2 we discuss the inclusive Z boson production at the LHC while in Sec.3 the correlation studies of the different partons with the Z boson production are presented. The general settings of the QCD analysis and the results are presented in Sec.4 and 5 respectively followed by a summary in Sec.6.
2 Inclusive Z production at LHC
At the LHC experiment, the Z boson production cross section is one of the high priority measurements to understand the detector performance as well as for precision tests of the SM. The inclusive Z boson production at the LHC is initiated by the sub-processes,
| (1) |
at the leading order (LO), where . At the low region, GeV, the sub-process with initial state has significant contribution to the total cross section, while in the high region, , the sub-process becomes dominant ( 70 - 80%). These relative sub-process contributions are also valid at the NLO accuracy [12, 22, 23]. Therefore, the inclusive Z boson production cross section is one of the potential measurement to probe the gluon density inside the proton at the LHC [24].
The vector boson(W,Z) production in hadron colliders has a very rich physics potential and is well studied in the literature [25, 26, 27]. Currently, the inclusive Z boson production in its leptonic decay channel is computed at the next-to-next-to leading order(NNLO) level() by several groups [28, 29] and the K-factor which is defined to be the ratio of the NNLO and LO cross sections, is estimated to be about depending on the kinematic phase space. These NNLO predictions are equivalent to NLO for the Z+n-jet (n) process which is of the same order(). It is to be noted that these NLO predictions work quite well for the high regime. However, for the low range where the soft gluon emission with very low transverse momentum takes place, the NLO predictions may become unstable. In this low region, the fixed order perturbative calculation fails due to the presence of large logarithmic terms . Therefore, in order to make the calculation realistic at this low transverse momentum region, the large logarithms must be re-summed to all orders of . In Ref. [30, 31] the soft gluon non perturbative effects are taken into account re-summing all logarithm terms in the Z boson production and it can be computed using the software package ResBos.
The full NNLO QCD corrections () to the and distributions in association with jets became available very recently [32, 33, 34, 35]. However, before that an attempt has been made to compute the two loop QCD corrections to the process using the helicity amplitudes [36] method.
At the LHC, both the CMS and the ATLAS collaborations have measured the inclusive Z boson production cross section in proton-proton collisions at the center of mass energies of =7 [37] and 8 TeV [19]. These measurements are performed by identifying the Z boson in both the electron and muon channels and the results are presented in terms of the differential distributions of the Z boson. In particular, the CMS measurement relevant in the present context, the differential cross sections are obtained in terms of the and absolute of the Z boson [18, 19] based on the data sample of pp collisions at TeV corresponding to an integrated luminosity of 19.71 . The results are presented in five absolute rapidity bins ranging from 0-2.0 and the entire range has been divided into 10 bins reaching up to 1 TeV. The main goal of this current study is to test the sensitivity of the high data to the gluon PDF, hence the measurements of the first two bins (0-20 GeV and 20-40 GeV) are not included in the QCD analysis. The various sources of uncertainties related to the measurement techniques and the background estimation are obtained with the bin-to-bin correlation for each uncertainty source and accounted for in terms of covariance matrices. It is observed that the luminosity measurement is a main source of uncertainty amounting to 2.6% leading a total uncertainty 3-4% in the measurement [18, 19]. It is important to note that in this measurement no selection has been made on jets accompanied with the Z boson in order to avoid possibly a sizable (5-10%) contribution to the total systematic uncertainties from jet energy scale measurements. The measured cross sections are presented unfolding the detector effects at the parton level to be compared with higher order theory predictions. In the Ref [19], a comparison of data to the theoretical predictions from the FEWZ computation [38] for all rapidity bins is presented. The level of agreement between the data and the theoretical prediction is found to be of the 10%) across all and bins, which is within the uncertainties of the measurement and the theoretical prediction. The uncertainty in the theoretical predictions includes the variation of the QCD scales and PDF.
In the present QCD analysis, the inclusive Z boson differential cross sections are calculated at NLO using the MCFM [39] interfaced to ApplGrid [40]. The transversee momentum of the leading (sub-leading) muons are required to be greater than 25(10) GeV and less than 2.4(2.1) in absolute rapidity, whereas the dimuon invariant mass is selected to be within 81-101 GeV. The NLO CT10 PDF set [41] is used for the Z-boson event generation and the factorization () and the renormalization () scales are set to the dynamical scale . The uncertainties in the distribution due to the choices of QCD scales and PDF are also computed. The uncertainty due to the QCD scales is obtained by varying the scales, = { 1/2, 2}. It is observed that the QCD scale uncertainty is a size of about 5% at the low region and rises to 7% at the high region. The PDF uncertainty is derived following the asymmetric uncertainty prescription [42] by generating the spectrum for all the up and down type eigenvectors of the NNPDF2.3 [43] PDF set and found to be about 2-3%. Evidently, the scale uncertainty dominates over the other theoretical uncertainties.
The comparison between the MCFM theory predictions and the measured double differential Z boson cross section normalized to the inclusive cross section for various and bins corresponding to an integrated luminosity of 19.71 is presented in Fig.1. In addition, the ratios of the data and the theory predictions are also presented along with the PDF and QCD scale uncertainty band.
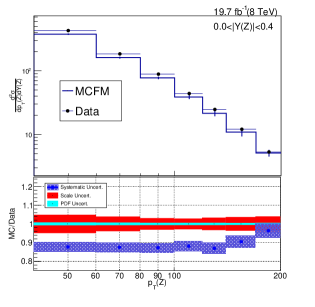
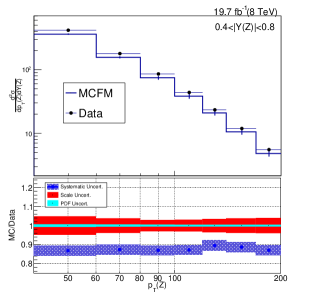
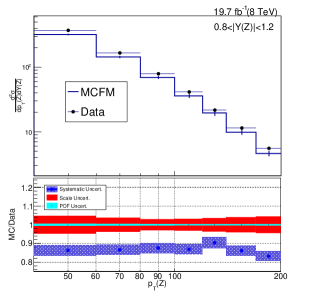
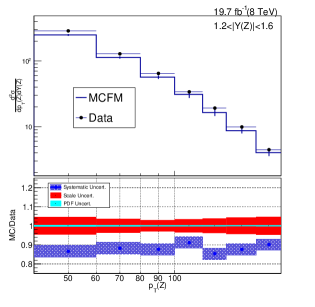
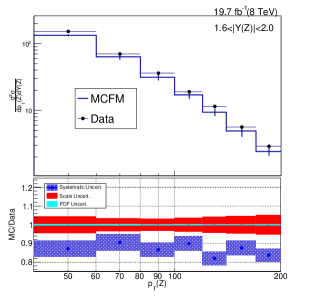
As can be seen in Fig. 1, a disagreement of about 10% exists between the measured cross section and the MCFM theory prediction across all the rapidity bins except for the last bin() where the discrepancy is even larger. Note that a similar level of agreement of the inclusive Z boson data is also observed with the theory predictions provided by FEWZ [19]. Recently, in the Ref. [44], the ATLAS and CMS data at 7 TeV for V+jet(V=W,Z) processes are compared with NNLO theory predictions.
3 Parton Correlation
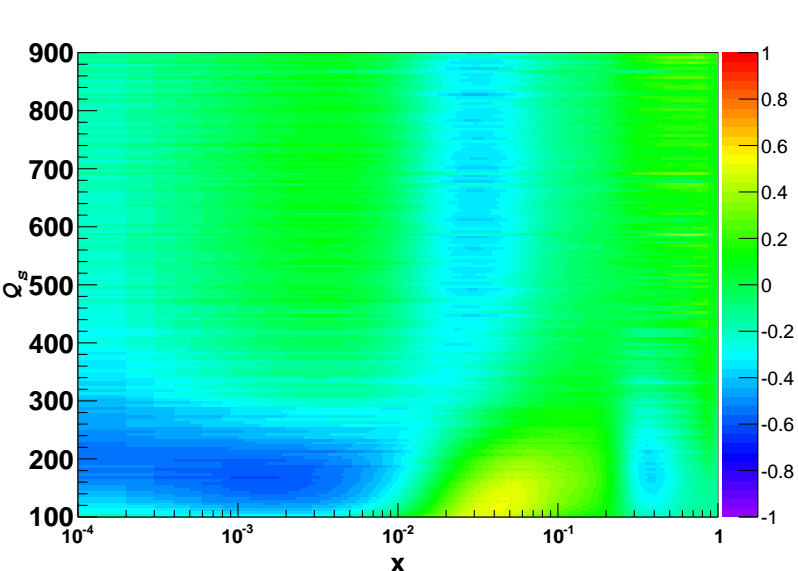
In order to understand the sensitivity of the initial PDFs to the Z boson production cross section, the correlation of the corresponding PDFs with the cross section is studied using the NNPDF2.3 [43] PDF set. The correlation function, for each -th parton(=g,u,d,s) is computed by evaluating means and standard deviations from the set of as,
| (2) |
where is the number of replicas in the NNPDF sets, is the inclusive Z boson production cross section computed using MCFM and is the PDF for a given parton and the factorization scale . In the denominator, the and are the standard deviations of cross sections for replicas of PDF sets and the PDF replicas themselves respectively.
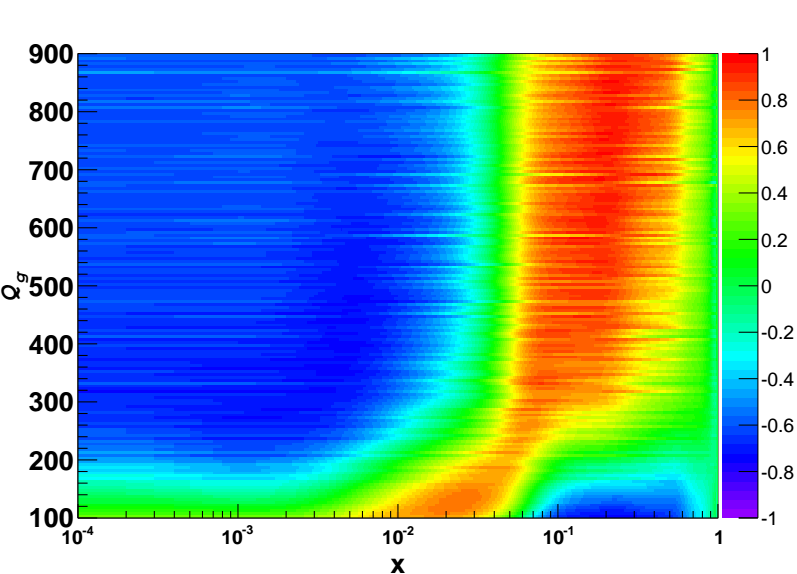
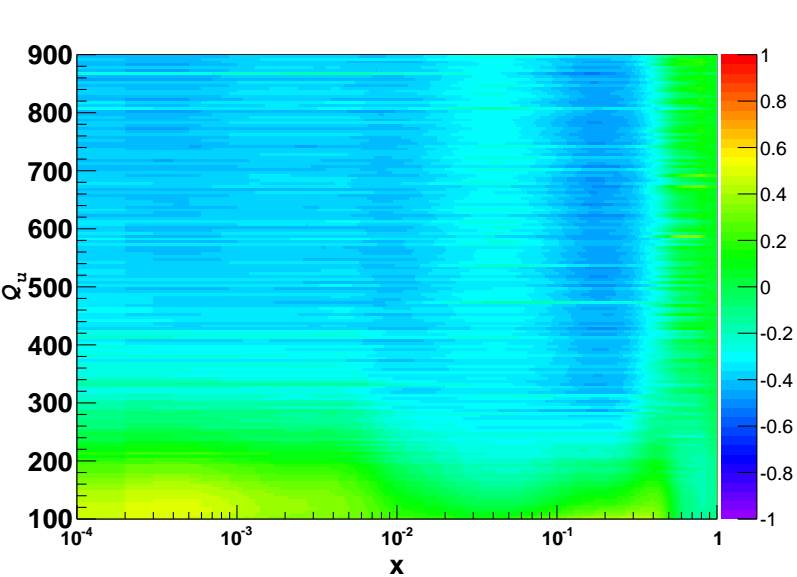
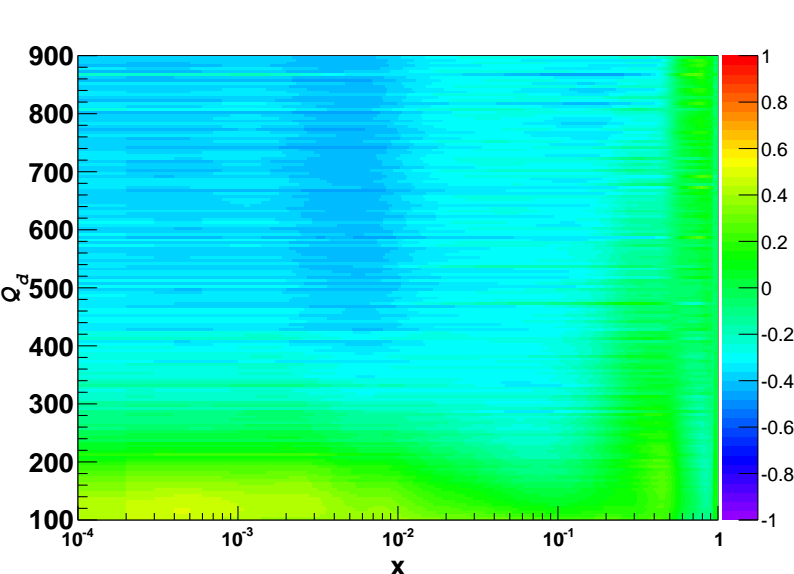
Fig. 2 presents the correlation coefficients() for the gluon, up, down and the strange quark PDFs in the - plane. The correlation co-efficient close to zero indicates that there is no correlation at all between the respective incoming parton and the production cross section. Similarly, higher values of means presence of a strong correlation of the corresponding parton and cross sections, where as negative values mean anti-correlation. The figure representing the gluon correlation (upper left panel) indicates that the inclusive Z boson cross section is strongly sensitive to gluon PDFs for the values of .
4 The QCD Analysis
The NLO QCD analysis is performed using the framework of the open source code HERAFitter(v1.1.0), the detailed description of which can be found in Ref.[20]. In this analysis, the initial parametrization for the PDFs is assumed at the starting scale of GeV2 and evolved to higher scales with the DGLAP [45, 46, 47, 48] equations using QCDNUM [49]. The combined data sets from the DIS neutral current (NC) and the charged current (CC) in and scattering at the H1 and ZEUS experiments as well as the CMS W muon charge asymmetry data are used in this study along with the data corresponding to the measurement of inclusive Z production, as described above. In order to exploit the precise CMS lepton charge asymmetry data which are used to improve the constraints of the PDFs of light quarks [9], the CMS measurement of W charge asymmetry is added as an additional input along with the inclusive data.
At the starting scale, , the PDFs are parametrized using a generic form:
| (3) |
Here is the normalization term and the behavior of the PDFs for low (high) values of Bjorken is regulated by the () term. The optimal parametrization for the PDF fit is found through a parametrization scan as described in [21]: In the beginning, the scan is performed starting from a parametrization with a basic polynomial form and then additional parameters are allowed to vary, one parameter at a time. This scanning process continues till the reduction in reached to a value less than unity.
The final parametrized form with 14 free parameters for the five PDFs, valence light quarks , the anti quark , where , and the gluon xg(x) is defined as:
| (4) |
The normalization parameters and are constrained by the QCD sum rules. A more expanded form for g(x) is used with the choice 25 following the approach of the MSTW group [50]. The strange quark relation to is defined as
| (5) |
where is the fraction of strange quarks, [2]. Additional constraints applied are and .
The sources of experimental uncertainties in the measurement of
the Z boson cross section are discussed in detail
in the Ref.[19]
and taken into account in the fit through a covariance matrix.
The uncertainty due to the choice
of parametrization given by the Eq.4 is evaluated by
assuming an alternate parametrization.
The parametrization uncertainties are estimated by including additional
terms one by one in the polynomial expansion of Eq.3 for all parton
densities following the procedure described in the Ref. [21].
The variation in the starting scale , is regarded as a
parametrization uncertainty and is estimated by varying it within the range
.
The parametrization uncertainty is constructed
as an envelope built from the maximal differences between the PDFs.
The model uncertainties in the QCD fit are evaluated
by varying
heavy quark masses and , strange quark fraction parameter
, and .
In order to obtain these uncertainties, the model parameters
are varied between its maximum and minimum values one at a time
in the fit.
The change of the fit due to this variation with respect to the
central fit obtained using the nominal
value of that parameter is estimated to be the uncertainty corresponding to
that model parameter.
The model uncertainties with variations are presented
in Table 1.
The experimental, model and parametrization uncertainties are
added in quadrature to obtain the total systematic uncertainty.
| Parameters | Nominal value | Lower limit | Upper limit |
|---|---|---|---|
| 0.31 | 0.23 | 0.38 | |
| [GeV] | 1.4 | 1.35(=1.8) | 1.65 |
| [GeV] | 4.75 | 4.3 | 5.0 |
| [GeV2] | 3.5 | 2.5 | 5.0 |
| [GeV2] | 1.9 | 1.5() | 2.5() |
5 Results
| Datasets | HERA I | HERA I +CMS(Asym) | HERA I + CMS full |
|---|---|---|---|
| NC HERA H1-ZEUS | 109/145 | 109/145 | 109/145 |
| NC HERA H1-ZEUS | 400/379 | 401/379 | 411/379 |
| CC HERA H1-ZEUS | 19/34 | 19/34 | 19/34 |
| CC HERA H1-ZEUS | 27/34 | 30/34 | 31/34 |
| CMS W electron asymmetry | – | 8.4/11 | 7.5/11 |
| CMS W muon asymmetry | – | 13/11 | 13/11 |
| CMS Inclusive Z data | – | – | 78.5/40 |
| Total | 555/578 | 580/600 | 668/640 |
| p value | 0.74 | 0.71 | 0.21 |
The QCD analysis results are presented in Table 2. The quality of the fit is found to be fairly good for the HERA-I data only and HERA-I with CMS W charge asymmetry data. The combined fit of HERA-I data with CMS W and Z production data is observed to be higher due to the fact that the disagreement between the Z-boson data and the corresponding MCFM theory prediction is relatively large. However, the total is found to be reasonable.
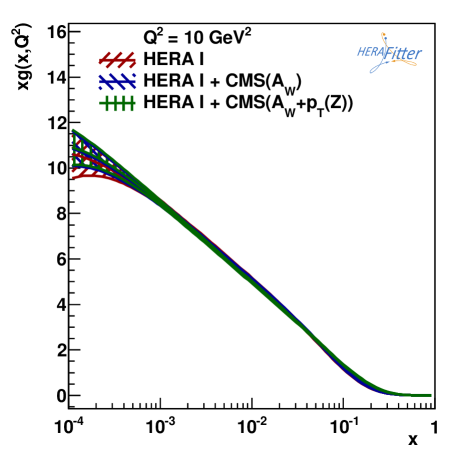
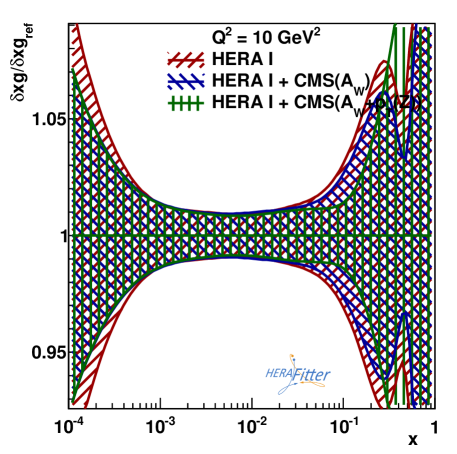
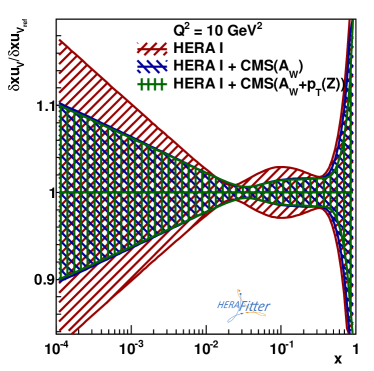
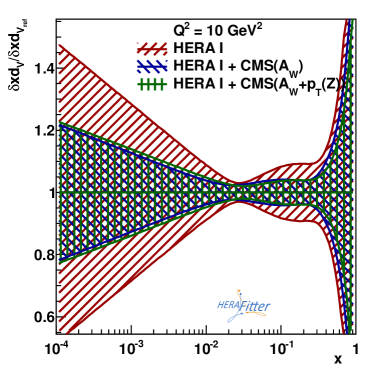
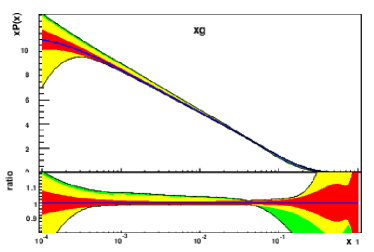
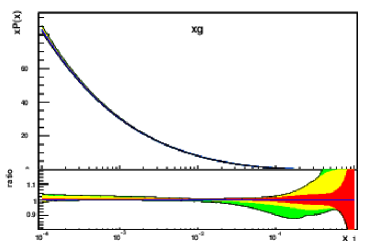
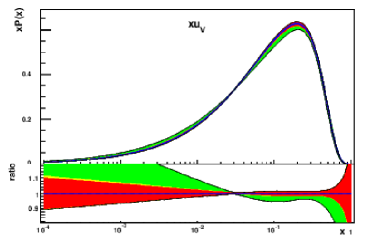
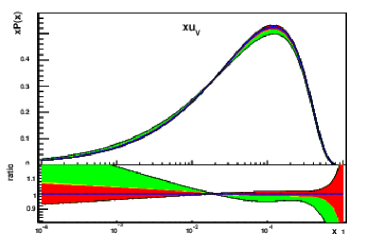
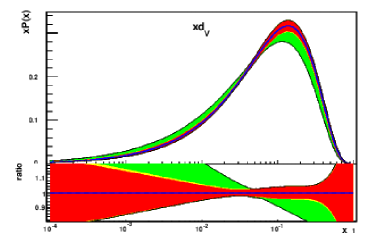
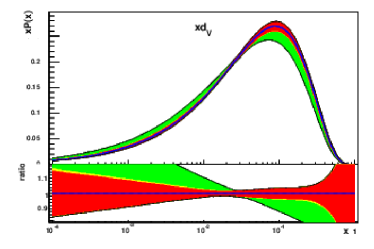
The impact of the CMS data to PDFs is illustrated by comparing the PDF fits with the HERA DIS data alone as shown for the gluon in Fig. 3 and u and d valence quarks in Fig. 4. In order to understand the improvement in gluon distribution due to the addition of the CMS data, the ratio of the relative uncertainties of the fitted gluon distribution obtained using the combined datasets and the DIS data only is presented in the same figure at the bottom panel. A change of shape of the gluon distribution due to the inclusion of the CMS Z boson data is visible at low , in particular around the value of where a strong correlation of the gluon PDF with the Z boson production cross section is observed, as shown in Fig. 2. In addition, the Fig. 4 shows that the CMS W charge asymmetry is more sensitive to the light quark distributions.
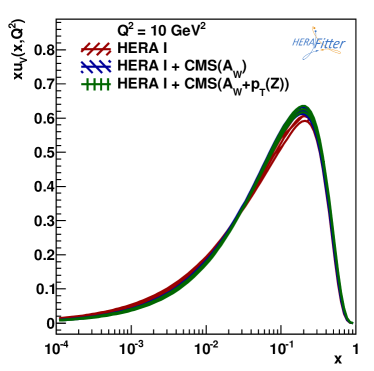
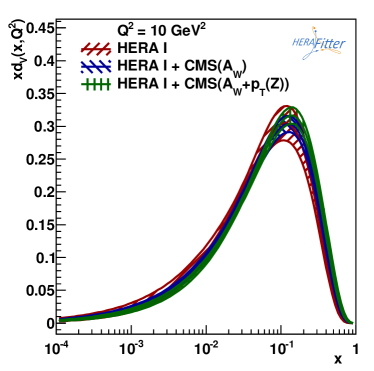
The constrained NLO distributions of the gluon, u and d valence quarks are shown in Fig. 5 for two values of 10 GeV2 and . In general, as observed, the uncertainty due to the parametrization is the dominant one.
6 Summary
The sensitivity of the CMS Z boson production measurement to PDFs at TeV is reported in this letter. The theory predictions corresponding to the CMS Z boson production measurement are obtained from the MCFM based calculations at NLO. The studies of the initial parton correlations with the Z boson cross section indicate the sensitivity of the gluon distribution in this process. A comparison between the measured Z boson cross section in various and bins and the corresponding MCFM based theory predictions at NLO shows an agreement at the level of 10%, however the shapes of the distributions of both the data and the theory agree reasonably well. Similar level of agreement is also observed by the calculations performed with FEWZ. As evaluated with the MCFM based theory predictions, the uncertainty due to the QCD scales is found to be the most dominant of the order of 5-7%. It is to be noted that the inclusive double differential Z boson cross section is measured with an overall precision of about 3-4% which is remarkably precise for any measurement at the hadron colliders.
The NLO QCD analysis is performed within the framework of the HERAFitter, fitting the CMS Z boson production and the W asymmetry measurements together with the HERA-I DIS charged and neutral current data. The results of this QCD analysis indicate the improvement(5-7%) in the gluon PDFs around the region of 0.1. The current analysis demonstrates the limited constraints on the gluon PDFs using inclusive Z boson data. Therefore, in order to describe the very precisely measured Z boson cross section, more accurate theoretical predictions accessible via the fast techniques to PDF fits are needed which are expected to reduce the level of disagreement between the data and theory.
References
- [1] J. M. Campbell, J. Huston, and W. Stirling, “Hard Interactions of Quarks and Gluons: A Primer for LHC Physics,” Rept.Prog.Phys. 70 (2007) 89, arXiv:hep-ph/0611148 [hep-ph].
- [2] A. Martin, W. Stirling, R. Thorne, and G. Watt, “Parton distributions for the LHC,” Eur.Phys.J. C63 (2009) 189–285, arXiv:0901.0002 [hep-ph].
- [3] J. Rojo et al., “The PDF4LHC report on PDFs and LHC data: Results from Run I and preparation for Run II,” J. Phys. G42 (2015) 103103, arXiv:1507.00556 [hep-ph].
- [4] L. A. Harland-Lang, A. D. Martin, P. Motylinski, and R. S. Thorne, “Parton distributions in the LHC era: MMHT 2014 PDFs,” Eur. Phys. J. C75 no. 5, (2015) 204, arXiv:1412.3989 [hep-ph].
- [5] S. Dulat, T. J. Hou, J. Gao, M. Guzzi, J. Huston, P. Nadolsky, J. Pumplin, C. Schmidt, D. Stump, and C. P. Yuan, “The CT14 Global Analysis of Quantum Chromodynamics,” arXiv:1506.07443 [hep-ph].
- [6] J. Rojo, “Progress in the NNPDF global analysis and the impact of the legacy HERA combination,” in Proceedings, 2015 European Physical Society Conference on High Energy Physics (EPS-HEP 2015). 2015. arXiv:1508.07731 [hep-ph].
- [7] S. Alekhin, J. Blumlein, and S. Moch, “The ABM parton distributions tuned to LHC data,” Phys. Rev. D89 no. 5, (2014) 054028, arXiv:1310.3059 [hep-ph].
- [8] ATLAS Collaboration Collaboration, G. Aad et al., “Determination of the strange quark density of the proton from ATLAS measurements of the and cross sections,” Phys.Rev.Lett. 109 (2012) 012001, arXiv:1203.4051 [hep-ex].
- [9] CMS Collaboration Collaboration, S. Chatrchyan et al., “Measurement of the muon charge asymmetry in inclusive production at 7 TeV and an improved determination of light parton distribution functions,” Phys.Rev. D90 no. 3, (2014) 032004, arXiv:1312.6283 [hep-ex].
- [10] CMS Collaboration Collaboration, S. Chatrchyan et al., “Measurement of associated W + charm production in pp collisions at = 7 TeV,” arXiv:1310.1138 [hep-ex].
- [11] ATLAS Collaboration, G. Aad et al., “Measurement of the production of a boson in association with a charm quark in collisions at 7 TeV with the ATLAS detector,” JHEP 05 (2014) 068, arXiv:1402.6263 [hep-ex].
- [12] B. J. A. Watt, P. Motylinski, and R. S. Thorne, “The Effect of LHC Jet Data on MSTW PDFs,” Eur. Phys. J. C74 (2014) 2934, arXiv:1311.5703 [hep-ph].
- [13] ATLAS Collaboration, G. Aad et al., “Measurement of the inclusive jet cross section in pp collisions at sqrt(s)=2.76 TeV and comparison to the inclusive jet cross section at sqrt(s)=7 TeV using the ATLAS detector,” Eur. Phys. J. C73 no. 8, (2013) 2509, arXiv:1304.4739 [hep-ex].
- [14] CMS Collaboration, V. Khachatryan et al., “Constraints on parton distribution functions and extraction of the strong coupling constant from the inclusive jet cross section in pp collisions at = 7 TeV,” Eur. Phys. J. C75 no. 6, (2015) 288, arXiv:1410.6765 [hep-ex].
- [15] J. Rojo, “Constraints on parton distributions and the strong coupling from LHC jet data,” arXiv:1410.7728 [hep-ph].
- [16] M. Czakon, M. L. Mangano, A. Mitov, and J. Rojo, “Constraints on the gluon PDF from top quark pair production at hadron colliders,” JHEP 07 (2013) 167, arXiv:1303.7215 [hep-ph].
- [17] M. Guzzi, K. Lipka, and S.-O. Moch, “Top-quark pair production at hadron colliders: differential cross section and phenomenological applications with DiffTop,” JHEP 01 (2015) 082, arXiv:1406.0386 [hep-ph].
- [18] CMS Collaboration Collaboration, “Measurement of Z production as a function of pT, Y,” Tech. Rep. CMS-PAS-SMP-13-013, CERN, Geneva, 2014.
- [19] CMS Collaboration, V. Khachatryan et al., “Measurement of the Z boson differential cross section in transverse momentum and rapidity in proton–proton collisions at 8 TeV,” Phys. Lett. B749 (2015) 187–209, arXiv:1504.03511 [hep-ex].
- [20] S. Alekhin, O. Behnke, P. Belov, S. Borroni, M. Botje, et al., “HERAFitter, Open Source QCD Fit Project,” arXiv:1410.4412 [hep-ph]. https://www.herafitter.org/HERAFitter/
- [21] H1 and ZEUS Collaboration Collaboration, F. Aaron et al., “Combined Measurement and QCD Analysis of the Inclusive e+- p Scattering Cross Sections at HERA,” JHEP 1001 (2010) 109, arXiv:0911.0884 [hep-ex].
- [22] S. A. Malik and G. Watt, “Ratios of W and Z cross sections at large boson as a constraint on PDFs and background to new physics,” JHEP 02 (2014) 025, arXiv:1304.2424 [hep-ph].
- [23] M. Klasen and M. Brandt, “Parton densities from LHC vector boson production at small and large transverse momenta,” Phys. Rev. D88 (2013) 054002, arXiv:1305.5677 [hep-ph].
- [24] D. V. Bandurin and N. B. Skachkov, “On the possibilities of measuring the gluon distribution using ’gamma / Z0 + jet’ events at Tevatron Run II and LHC,” in Proceedings, 11th International Workshop on Deep Inelastic Scattering (DIS 2003), pp. 546–551. 2004. arXiv:hep-ex/0403024 [hep-ex].
- [25] G. Altarelli, R. K. Ellis, and G. Martinelli, “Large Perturbative Corrections to the Drell-Yan Process in QCD,” Nucl. Phys. B157 (1979) 461.
- [26] G. Altarelli, R. K. Ellis, M. Greco, and G. Martinelli, “Vector Boson Production at Colliders: A Theoretical Reappraisal,” Nucl. Phys. B246 (1984) 12.
- [27] J. C. Collins, D. E. Soper, and G. F. Sterman, “Transverse Momentum Distribution in Drell-Yan Pair and W and Z Boson Production,” Nucl. Phys. B250 (1985) 199.
- [28] K. Melnikov and F. Petriello, “Electroweak gauge boson production at hadron colliders through O(alpha(s)**2),” Phys. Rev. D74 (2006) 114017, arXiv:hep-ph/0609070 [hep-ph].
- [29] S. Catani, L. Cieri, G. Ferrera, D. de Florian, and M. Grazzini, “Vector boson production at hadron colliders: a fully exclusive QCD calculation at NNLO,” Phys. Rev. Lett. 103 (2009) 082001, arXiv:0903.2120 [hep-ph].
- [30] C. Balazs and C. Yuan, “Soft gluon effects on lepton pairs at hadron colliders,” Phys.Rev. D56 (1997) 5558–5583, arXiv:hep-ph/9704258 [hep-ph].
- [31] G. Ladinsky and C. Yuan, “The Nonperturbative regime in QCD resummation for gauge boson production at hadron colliders,” Phys.Rev. D50 (1994) 4239, arXiv:hep-ph/9311341 [hep-ph].
- [32] R. Boughezal, J. M. Campbell, R. K. Ellis, C. Focke, W. T. Giele, X. Liu, and F. Petriello, “Z-boson production in association with a jet at next-to-next-to-leading order in perturbative QCD,” arXiv:1512.01291 [hep-ph].
- [33] R. Boughezal, C. Focke, X. Liu, and F. Petriello, “-boson production in association with a jet at next-to-next-to-leading order in perturbative QCD,” Phys. Rev. Lett. 115 no. 6, (2015) 062002, arXiv:1504.02131 [hep-ph].
- [34] R. Boughezal, X. Liu, and F. Petriello, “Phenomenology of the Z-boson plus jet process at NNLO,” arXiv:1602.08140 [hep-ph].
- [35] J. R. Andersen, J. J. Medley, and J. M. Smillie, “Z/gamma* plus Multiple Hard Jets in High Energy Collisions,” arXiv:1603.05460 [hep-ph].
- [36] T. Gehrmann, L. Tancredi, and E. Weihs, “Two-loop QCD helicity amplitudes for and ,” JHEP 04 (2013) 101, arXiv:1302.2630.
- [37] ATLAS Collaboration, G. Aad et al., “Measurement of the boson transverse momentum distribution in collisions at = 7 TeV with the ATLAS detector,” JHEP 09 (2014) 145, arXiv:1406.3660 [hep-ex].
- [38] Y. Li and F. Petriello, “Combining QCD and electroweak corrections to dilepton production in FEWZ,” Phys.Rev. D86 (2012) 094034, arXiv:1208.5967 [hep-ph].
- [39] J. M. Campbell and R. Ellis, “MCFM for the Tevatron and the LHC,” Nucl.Phys.Proc.Suppl. 205-206 (2010) 10–15, arXiv:1007.3492 [hep-ph].
- [40] T. Carli, D. Clements, A. Cooper-Sarkar, C. Gwenlan, G. P. Salam, et al., “A posteriori inclusion of parton density functions in NLO QCD final-state calculations at hadron colliders: The APPLGRID Project,” Eur.Phys.J. C66 (2010) 503–524, arXiv:0911.2985 [hep-ph].
- [41] H.-L. Lai, M. Guzzi, J. Huston, Z. Li, P. M. Nadolsky, et al., “New parton distributions for collider physics,” Phys.Rev. D82 (2010) 074024, arXiv:1007.2241 [hep-ph].
- [42] H.-L. Lai, J. Huston, Z. Li, P. Nadolsky, J. Pumplin, D. Stump, and C. P. Yuan, “Uncertainty induced by QCD coupling in the CTEQ global analysis of parton distributions,” Phys. Rev. D82 (2010) 054021, arXiv:1004.4624 [hep-ph].
- [43] The NNPDF Collaboration Collaboration, R. D. Ball et al., “Parton distributions for the LHC Run II,” arXiv:1410.8849 [hep-ph].
- [44] R. Boughezal, X. Liu, and F. Petriello, “A comparison of NNLO QCD predictions with 7 TeV ATLAS and CMS data for +jet processes,” arXiv:1602.05612 [hep-ph].
- [45] V. N. Gribov and L. N. Lipatov, “Deep inelastic e p scattering in perturbation theory,” Sov. J. Nucl. Phys. 15 (1972) 438–450. [Yad. Fiz.15,781(1972)].
- [46] L. N. Lipatov, “The parton model and perturbation theory,” Sov. J. Nucl. Phys. 20 (1975) 94–102. [Yad. Fiz.20,181(1974)].
- [47] G. Altarelli and G. Parisi, “Asymptotic Freedom in Parton Language,” Nucl. Phys. B126 (1977) 298.
- [48] Y. L. Dokshitzer, “Calculation of the Structure Functions for Deep Inelastic Scattering and e+ e- Annihilation by Perturbation Theory in Quantum Chromodynamics.,” Sov. Phys. JETP 46 (1977) 641–653. [Zh. Eksp. Teor. Fiz.73,1216(1977)].
- [49] M. Botje, “QCDNUM: Fast QCD Evolution and Convolution,” Comput.Phys.Commun. 182 (2011) 490–532, arXiv:1005.1481 [hep-ph].
- [50] R. Thorne, “A Variable-flavor number scheme for NNLO,” Phys.Rev. D73 (2006) 054019, arXiv:hep-ph/0601245 [hep-ph].